
- Moving the markets
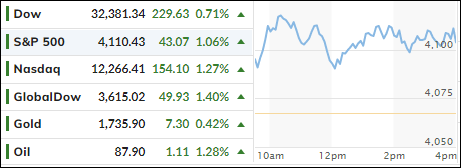
Stocks continued last week’s momentum to higher ground, as traders are still convinced that peak inflation is in the rear-view mirror, and that future rate hikes might be smaller because of it. That goes against Fed head Powell’s repeated assertions that he remains “strongly committed” to bring down inflation.
No matter how the CPI number will turn out tomorrow, the Fed meeting on Sept. 20-21 looms large with expectations being that they will deliver the 3rd consecutive 0.75% rate hike. In the meantime, a softer than expected CPI reading could maintain bullish momentum and soon create a new Domestic Buy signal for our Trend Tracking approach. At this time, we are not quite there yet, as you can see in section 3 below.
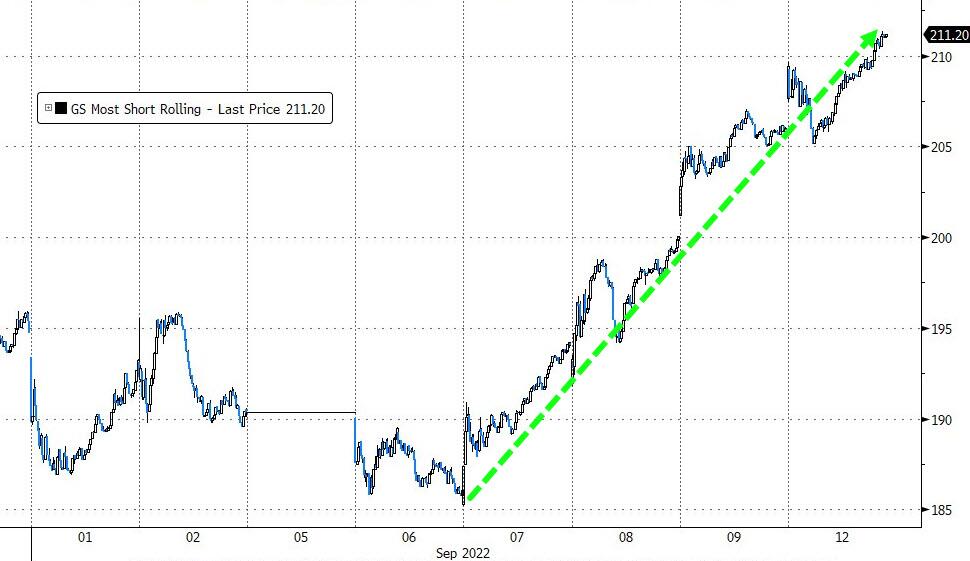
As is usually the case, no major rebound can materialize without a solid short squeeze. That was the case over the past 4 trading days, as the most shorted stocks got squeezed by some 14% off their lows, as ZeroHedge posted.
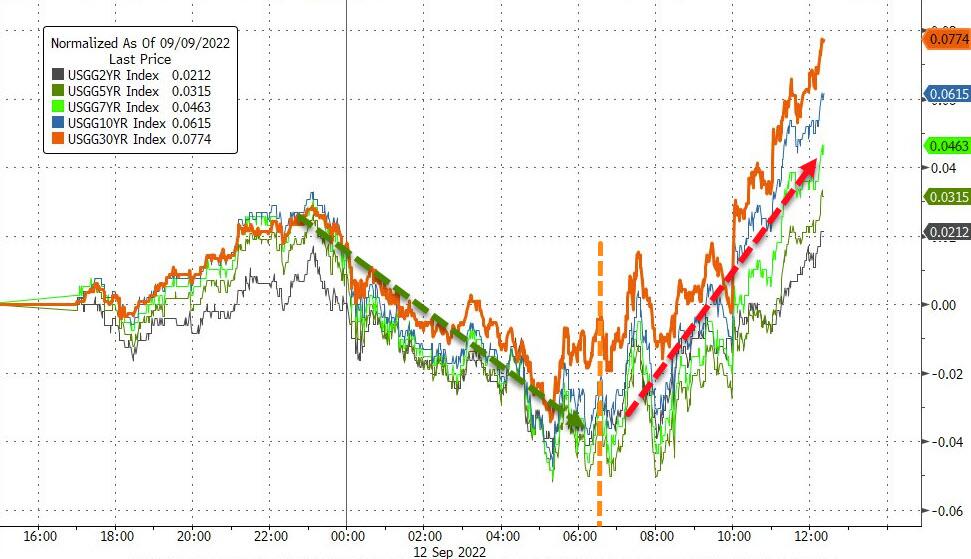
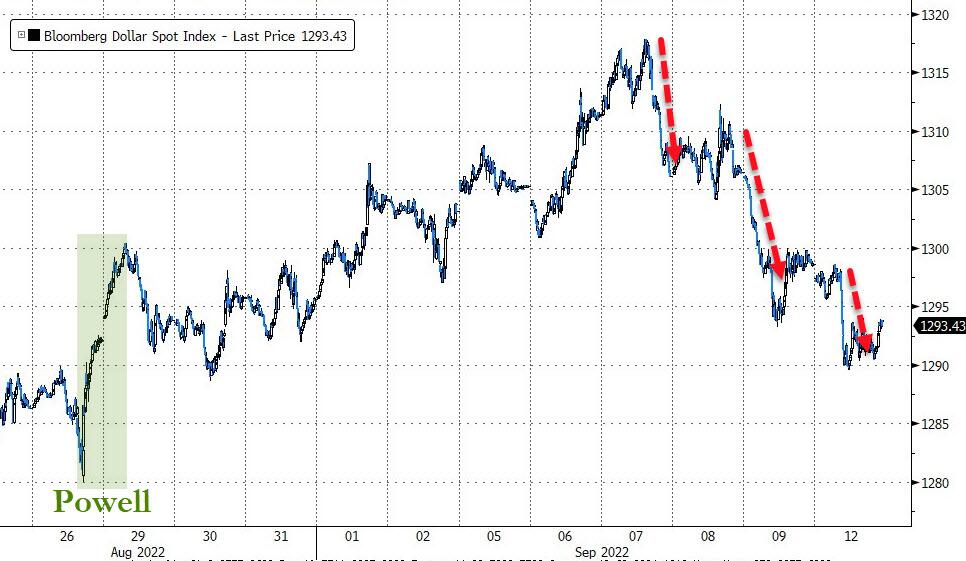
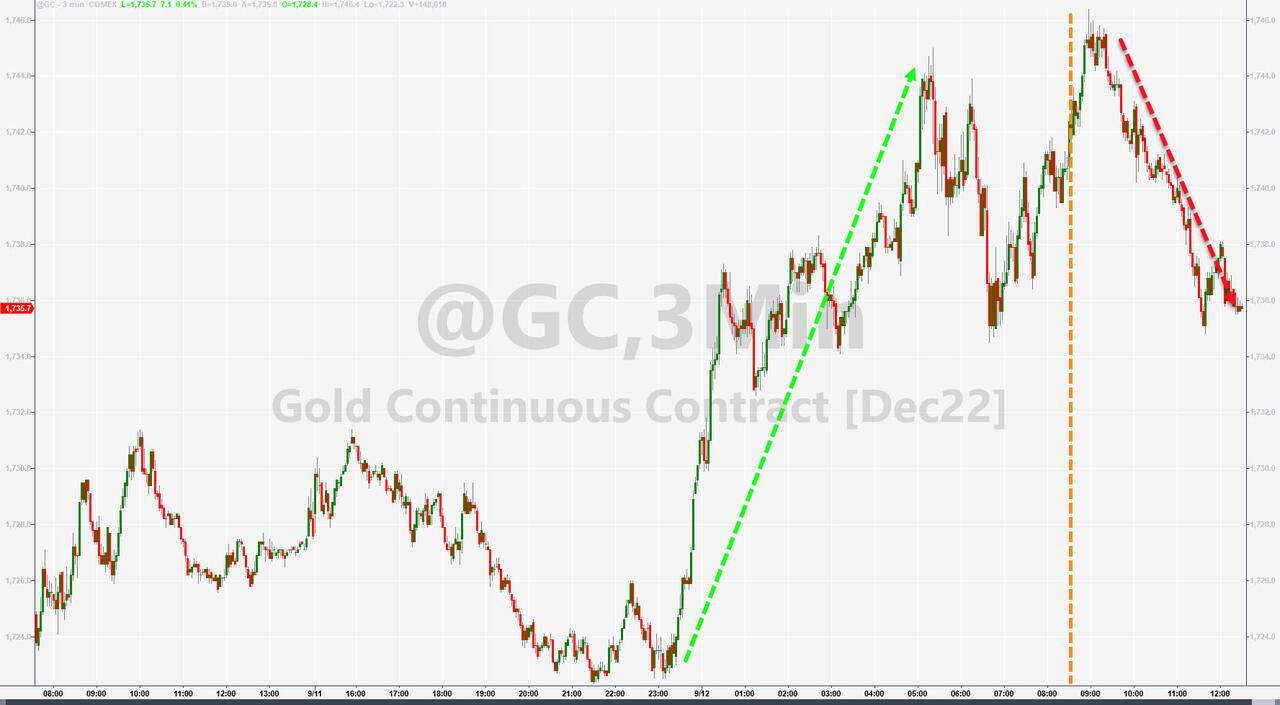
Bond yields rallied with the 10-year adding 6 basis points to close at 3.36%. The US Dollar tanked again, which allowed Gold to score another winning session above its $1,700 marker, despite a late day sell off.
With the CPI on deck tomorrow, traders may again ignore the Fed’s latest warning that one month’s report will not sway them in their fight against inflation.
2. ETFs in the Spotlight
In case you missed the announcement and description of this section, you can read it here again.
It features some of the 10 broadly diversified domestic and sector ETFs from my HighVolume list as posted every Saturday. Furthermore, they are screened for the lowest MaxDD% number meaning they have been showing better resistance to temporary sell offs than all others over the past year.
The below table simply demonstrates the magnitude with which these ETFs are fluctuating above or below their respective individual trend lines (%+/-M/A). A break below, represented by a negative number, shows weakness, while a break above, represented by a positive percentage, shows strength.
For hundreds of ETF choices, be sure to reference Thursday’s StatSheet.
For this closed-out domestic “Buy” cycle (2/24/2022), here’s how some of our candidates have fared. Keep in mind that our Domestic Trend Tracking Index (TTI) signaled a “Sell” on that date, which overrode the existing “Buys” shown for SPY and IYM:
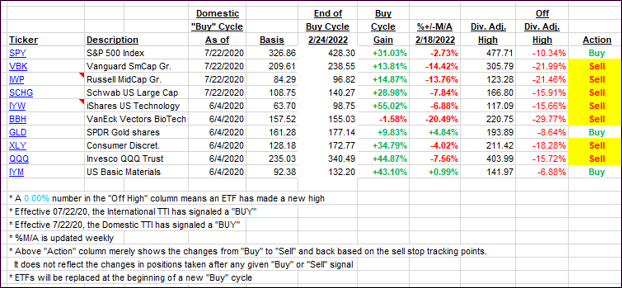
Click image to enlarge.
Again, the %+/-M/A column above shows the position of the various ETFs in relation to their respective long-term trend lines, while the trailing sell stops are being tracked in the “Off High” column. The “Action” column will signal a “Sell” once the -12% point has been taken out in the “Off High” column, which has replaced the prior -8% to -10% limits.
3. Trend Tracking Indexes (TTIs)
Our Domestic TTI moved closer to breaking its trend line to the upside which, if that position holds, will generate another “Buy” signal. But we are not there yet.
This is how we closed 09/12/2022:
Domestic TTI: -1.08% below its M/A (prior close -2.00%)—Sell signal effective 02/24/2022.
International TTI: -6.50% below its M/A (prior close -7.81%)—Sell signal effective 03/08/2022.
Disclosure: I am obliged to inform you that I, as well as my advisory clients, own some of the ETFs listed in the above table. Furthermore, they do not represent a specific investment recommendation for you, they merely show which ETFs from the universe I track are falling within the specified guidelines.
All linked charts above are courtesy of Bloomberg via ZeroHedge.
Contact Ulli