Below, please find the latest High-Volume ETF Cutline report, which shows how far above or below their respective long-term trend lines (39-week SMA) my currently tracked ETFs are positioned.
This report covers the HV ETF Master List from Thursday’s StatSheet and includes 312 High Volume ETFs, defined as those with an average daily volume of more than $5 million, of which currently 179 (last report: 105) are hovering in bullish territory. The yellow line separates those ETFs that are positioned above their trend line (%M/A) from those that have dropped below it.
In case you are not familiar with some of the terminology used in the reports, please read the Glossary of Terms. If you missed the original post about the Cutline approach, you can read it here.
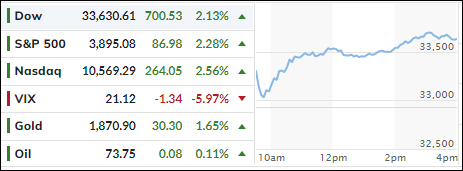
And so, the rollercoaster week has come to an end with the markets seeming to have broken out to the upside—at least for the time being.
The much-awaited December jobs report was interpreted as showing signs that inflation may be cooling, because of the Fed’s hawkish interest rate policy. The economy added 223k jobs, which was better than the expected 200k.
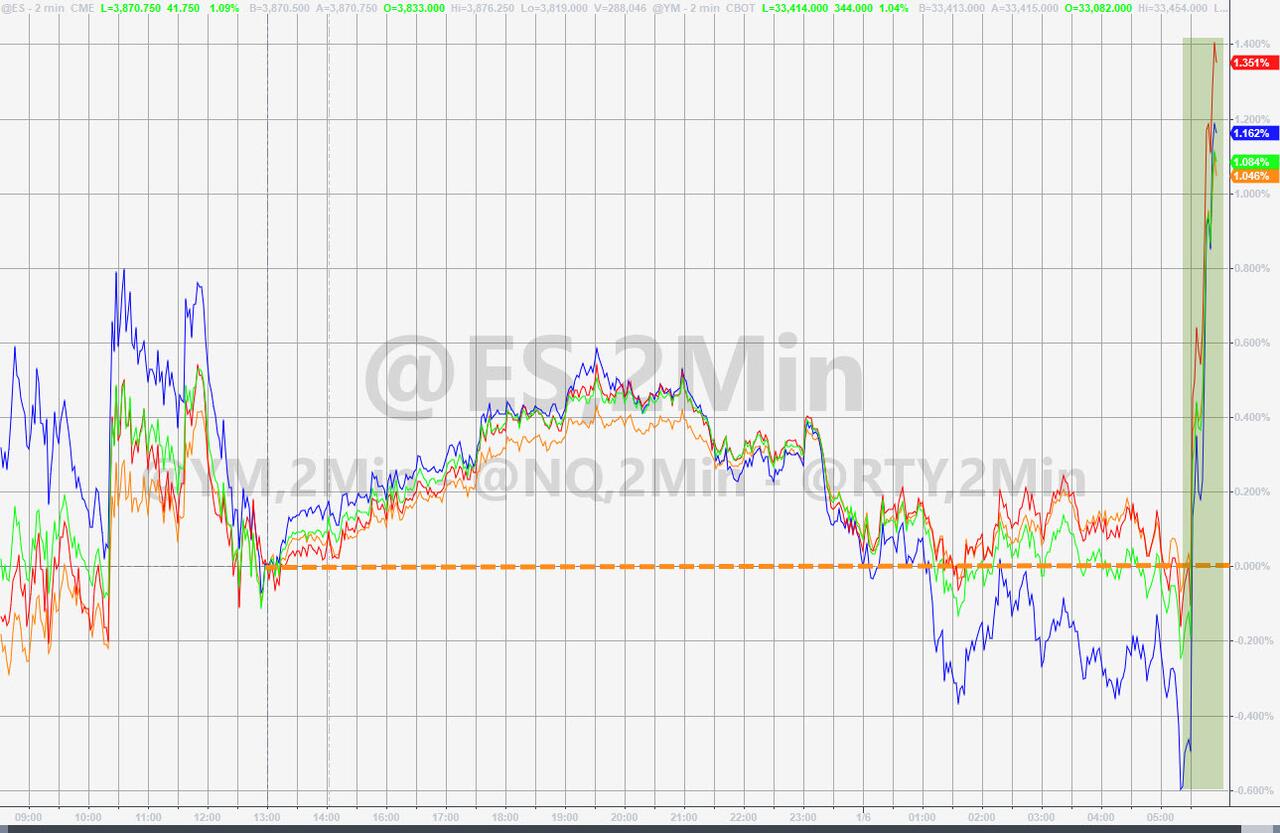
However more importantly, the bad news was that, at least for the working population, wages grew slower than anticipated by increasing only 0.3% on the month vs. 0.4% economists expected. That was good news for Wall Street, and the much-hyped theme that inflation is easing, which means that Fed might be pausing or pivoting soon. Consequently, the rate hike odds plunged.
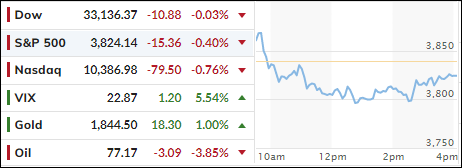
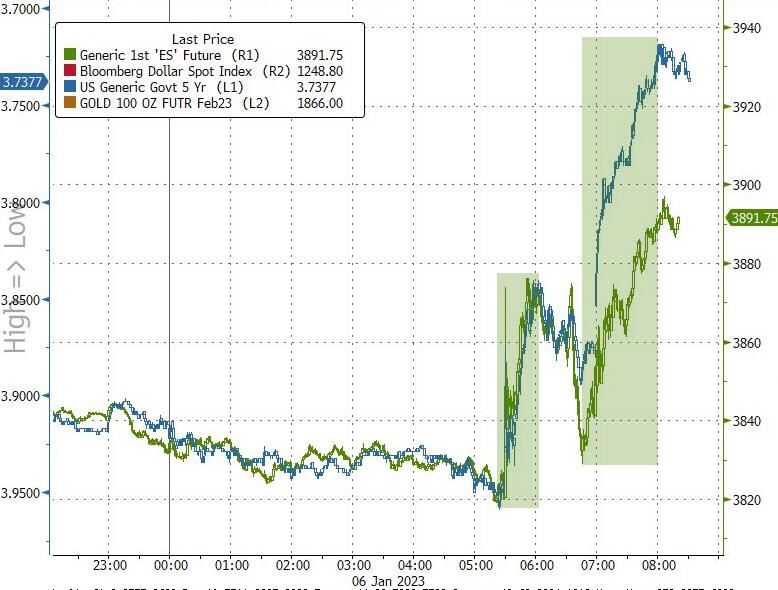
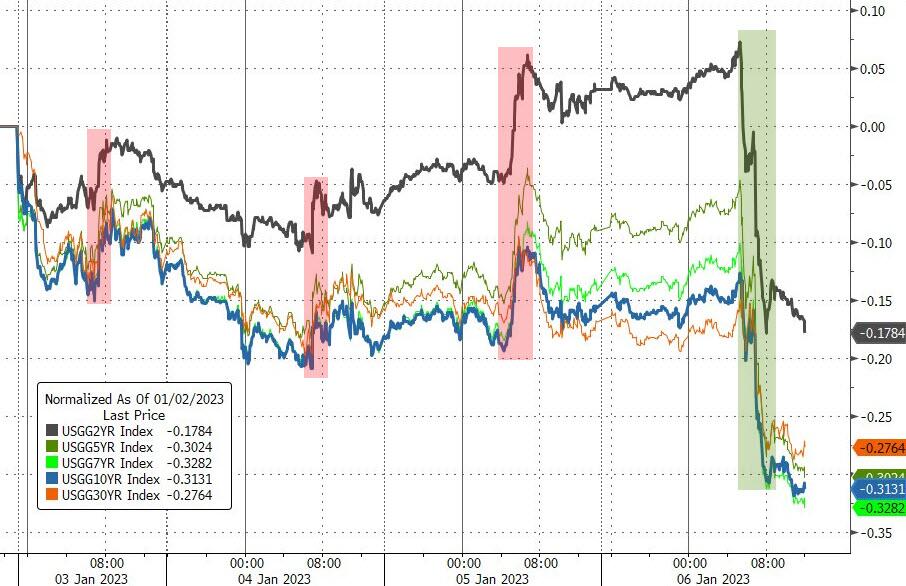
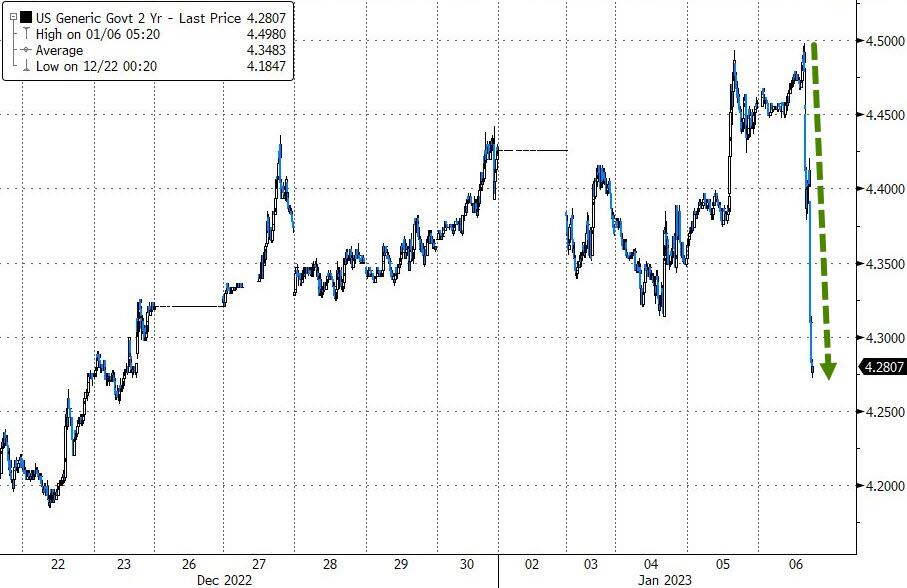
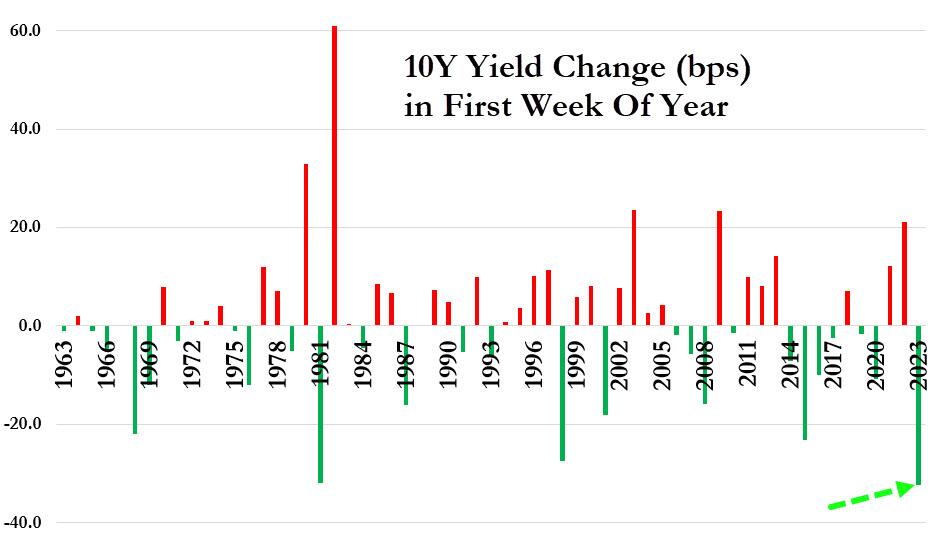
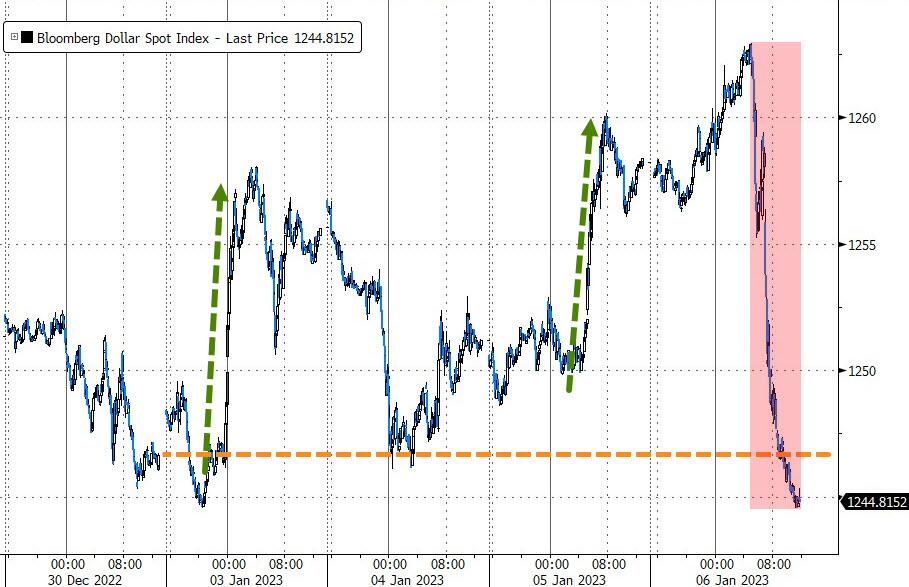
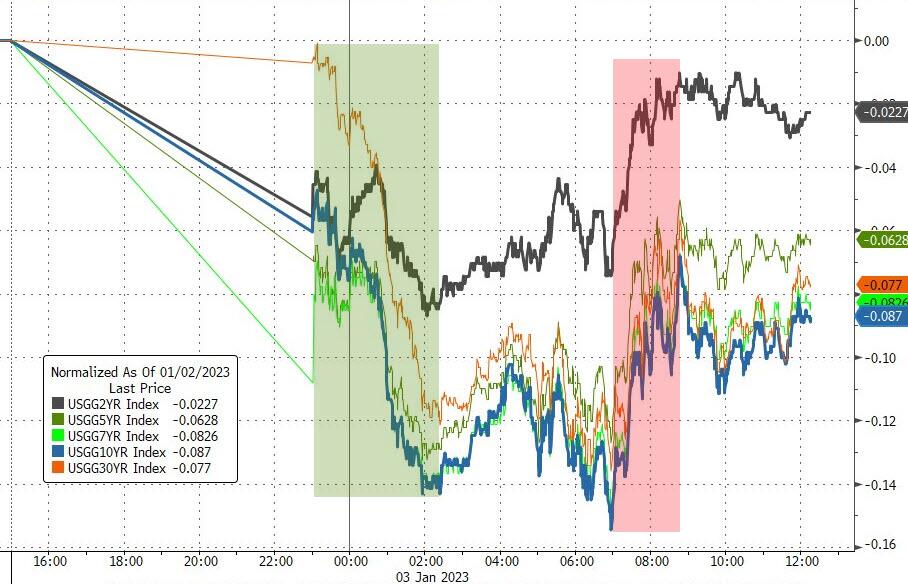
The major indexes shifted into overdrive, never looked back and ended up closing the session with over 2% gains. ZeroHedge called it a buying panic, and not just in equites but bonds as well, as the 2-year yield crashed in dramatic fashion. The 10-year plunged 33bps, which is its best start to a year on record, Bloomberg posted.
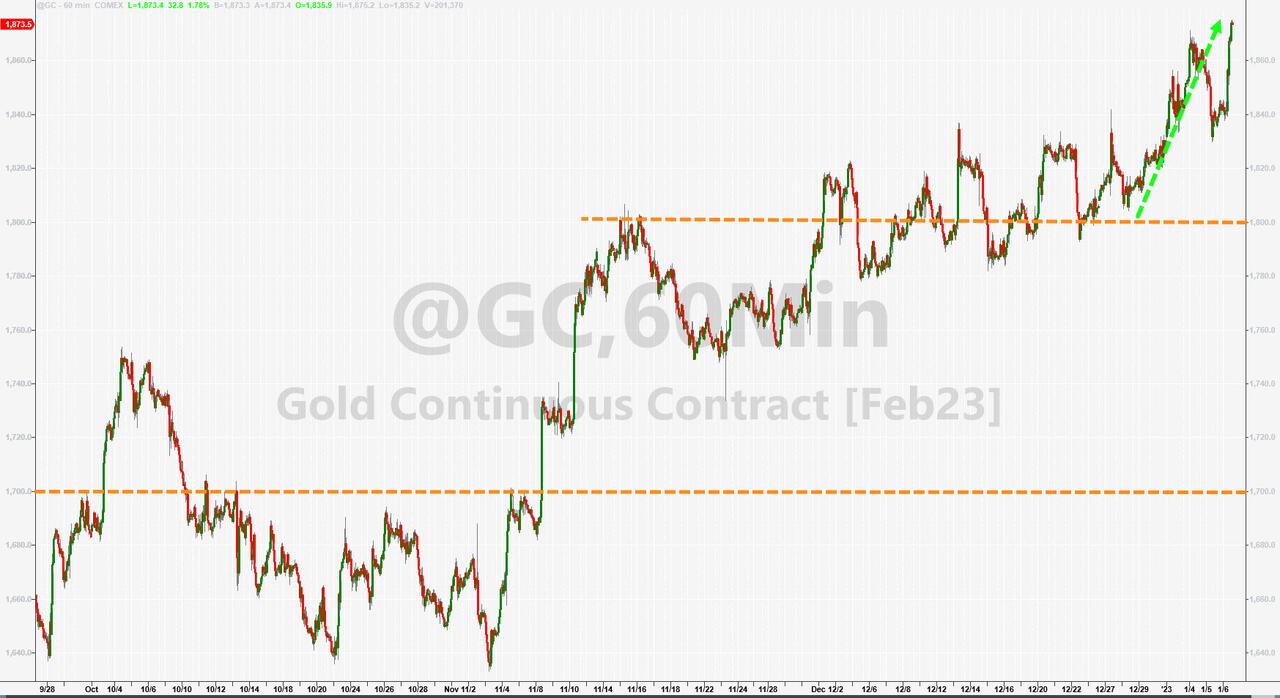
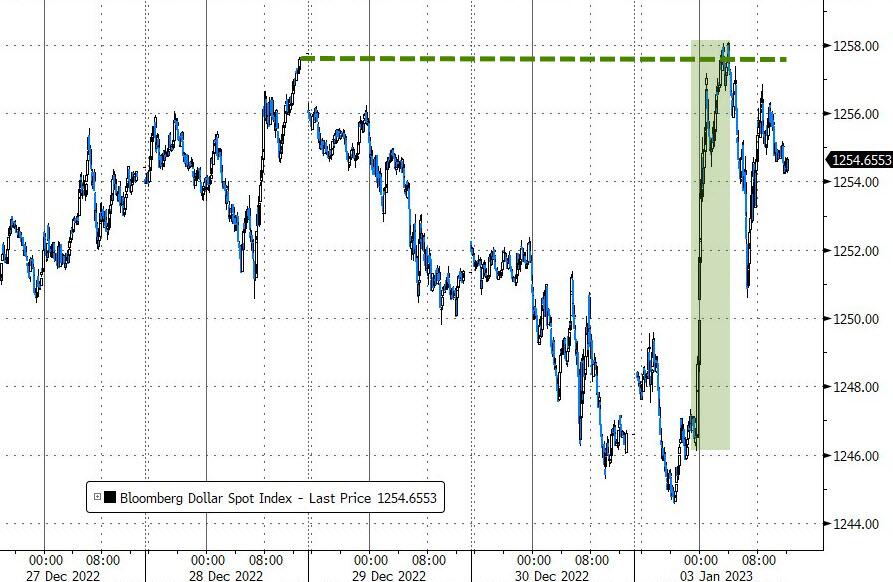
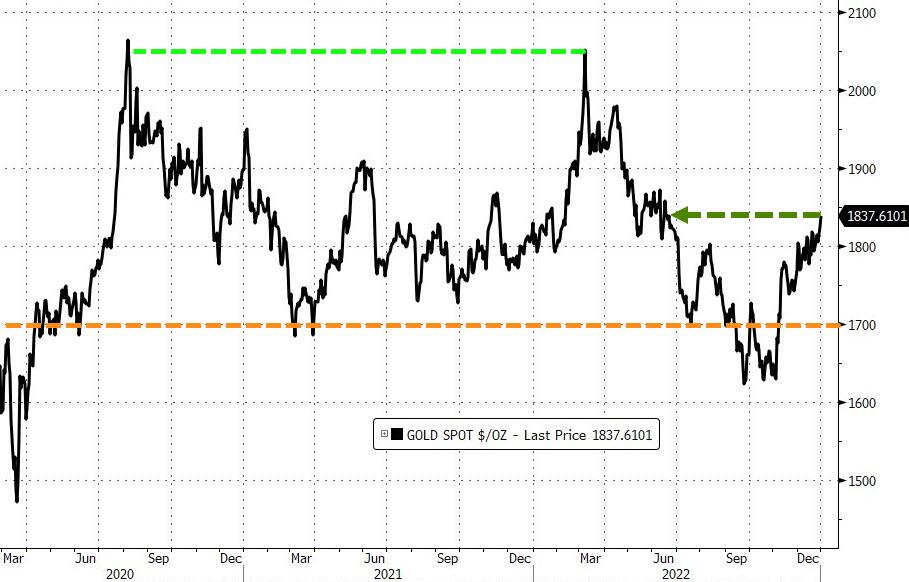
That caused the US Dollar to dump and Gold to spike, with the precious metal gaining +1.7% on the day and closing solidly above its $1,850 level. It has now rallied 15% from its November lows.
While the bullish beast was fed well for the day, the question remains whether this was simply an outlier or the beginning of a new bullish trend. The latter could end in a hurry, should the Fed decide next week to send out some of its minions to public forums reiterating that their hawkish stance has not changed.
ETF Data updated through Thursday, January 5, 2023
Methodology/Use of this StatSheet:
1. From the universe of over 1,800 ETFs, I have selected only those with a trading volume of over $5 million per day (HV ETFs), so that liquidity and a small bid/ask spread are assured.
2. Trend Tracking Indexes (TTIs)
Buy or Sell decisions for Domestic and International ETFs (section 1 and 2), are made based on the respective TTI and its position either above or below its long-term M/A (Moving Average). A crossing of the trend line from below accompanied by some staying power above constitutes a “Buy” signal. Conversely, a clear break below the line constitutes a “Sell” signal. Additionally, I use a 12% trailing stop loss on all positions in these categories to control downside risk.
3. All other investment arenas do not have a TTI and should be traded based on the position of the individual ETF relative to its own respective trend line (%M/A). That’s why those signals are referred to as a “Selective Buy.” In other words, if an ETF crosses its own trendline to the upside, a “Buy” signal is generated. Here too, I recommend trailing sell stop of 12%, or less, depending on your risk tolerance.
If you are unfamiliar with some of the terminology, please see Glossary of Termsand new subscriber information in section 9.
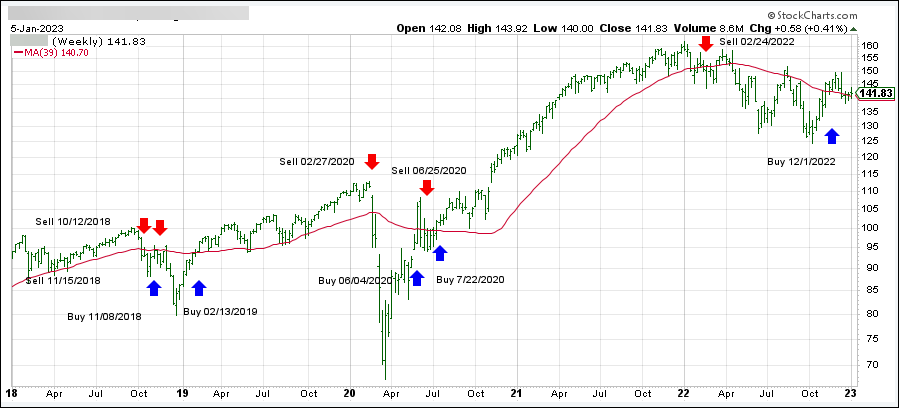
1. DOMESTIC EQUITY ETFs: BUY — since 12/01/2022
Click on chart to enlarge
Our main directional indicator, the Domestic Trend Tracking Index (TTI-green line in the above chart) has reclaimed its long-term trend line (red) by +0.57% and remains in “Buy” mode for the time being.
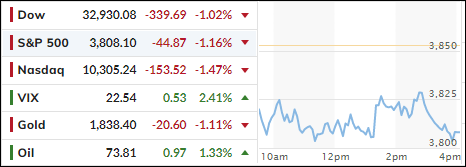
Yesterday’s rally of hope hit a brick wall this morning, as the markets appeared unable to string a couple of winning sessions together, thereby still being stuck trading in a broad trading range.
Good news was bad news again when ADP’s private payroll report showed that 235k jobs were added in December, which exceeded expectations. Wages also increased more than anticipated, which means that the labor market remains strong.
This is interpreted as bad news on Wall Street, since it will likely affect the Fed’s next moves by maintaining their hawkish policies, as gains in wage growth translates into potentially higher inflation, which supports their theme of continuing their rate hikes with the result that equities will succumb to bearish forces.
Tomorrow, the December jobs report will be on the agenda and, if it syncs up with today’s ADP numbers, we could see more downside momentum develop. Right now, market direction is clearly determined by the latest econ news releases, which can push equities in either direction.
Uncertainty reigns!
Continue reading…
2. “Buy” Cycle Suggestions
For the current Buy cycle, which started on 12/1/2022, I suggested you reference my most recent StatSheet for ETFs selections. However, if you came on board later, you may want to look at the most current version, which is published and posted every Thursday at 6:30 pm PST.
I also recommend for you to consider your risk tolerance when making your selections by dropping down more towards the middle of the M-Index rankings, should you tend to be more risk adverse. Likewise, a partial initial exposure to the markets, say 33% to start with, will reduce your risk in case of a sudden directional turnaround.
We are living in times of great uncertainty, with economic fundamentals steadily deteriorating, which will eventually affect earnings negatively and, by association, stock prices. I can see this current Buy signal to be short lived, say to the end of the year, and would not be surprised if it ends at some point in January.
In my advisor practice, we are therefore looking for limited exposure in value, some growth and dividend ETFs. Of course, gold has been a core holding for a long time.
With all investments, I recommend the use of a trailing sell stop in the range of 8-12% to limit your downside risk.
3. Trend Tracking Indexes (TTIs)
Our TTIs finally gave back some of yesterday’s advances but remain stuck on the bullish side of their respective trendlines.
This is how we closed 01/05/2023:
Domestic TTI: +0.57% above its M/A (prior close +1.62%)—Buy signal effective 12/1/2022.
International TTI: +3.49% above its M/A (prior close +3.99%)—Buy signal effective
12/1/2022.
Disclosure: I am obliged to inform you that I, as well as my advisory clients, own some of the ETFs listed in the above table. Furthermore, they do not represent a specific investment recommendation for you, they merely show which ETFs from the universe I track are falling within the specified guidelines.
All linked charts above are courtesy of Bloomberg via ZeroHedge.
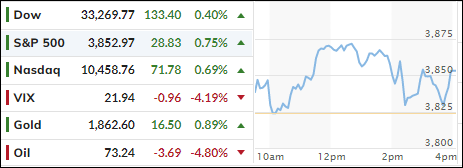
An early rally seemed to hit a brick wall, reversed, and headed south, but the major indexes bounced off their respective trend lines and closed the session in the green.
The culprit for this reversal was the release of the Fed’s latest meeting minutes (December), which showed that the bank will continue with their hawkish policies and remain aggressive with their efforts to fight inflation.
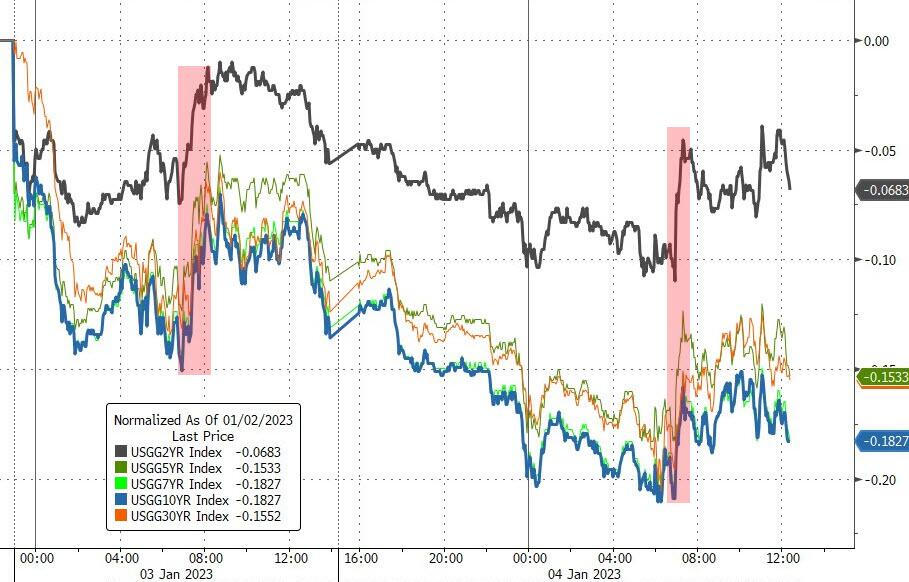
Helping the rebound were lower bond yields, despite the Fed confirming its stance on higher rates. They intend to do so until evidence appears that inflation has waned.
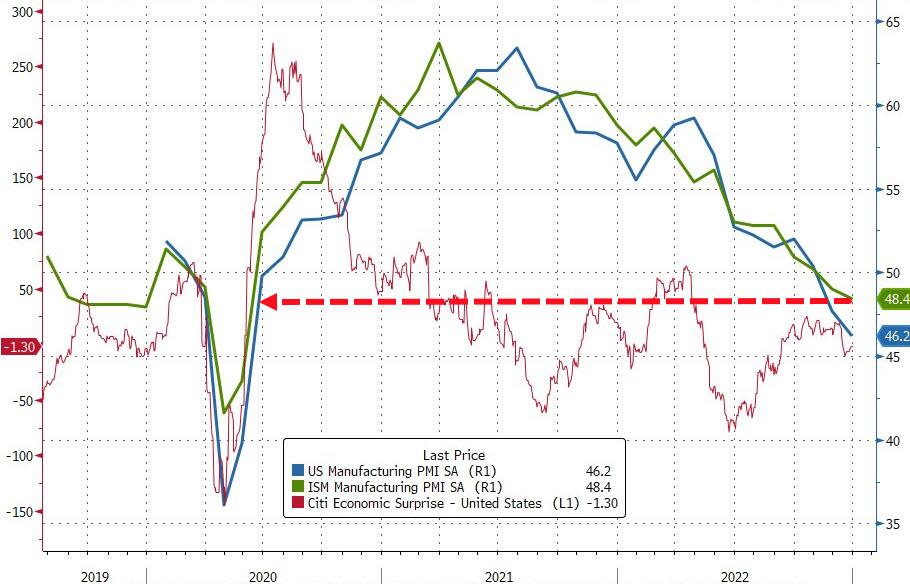
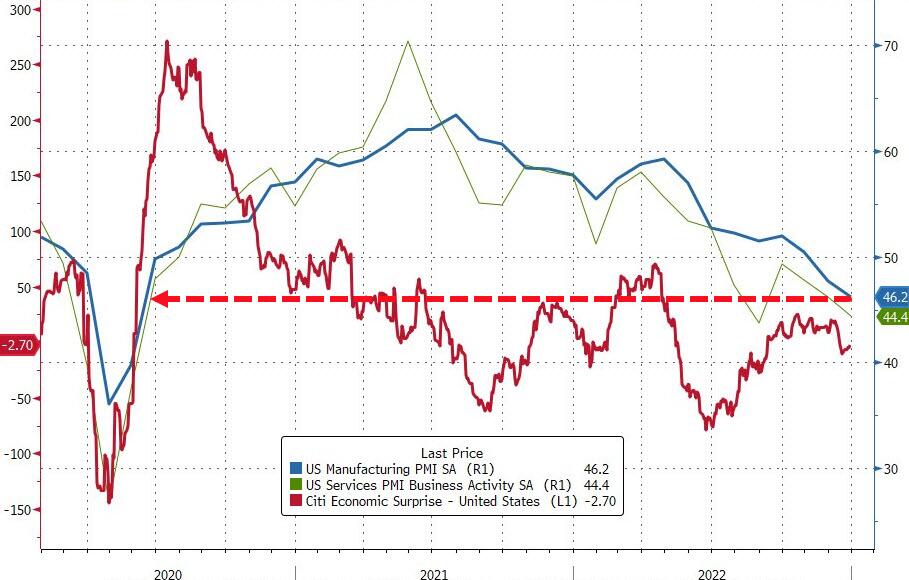
On the economic front, Manufacturing contracted for the 2nd month, as ZeroHedge reported, as “prices paid” and “new orders” plunged, while the index notched its longest stretch of declines since 1974-1975.
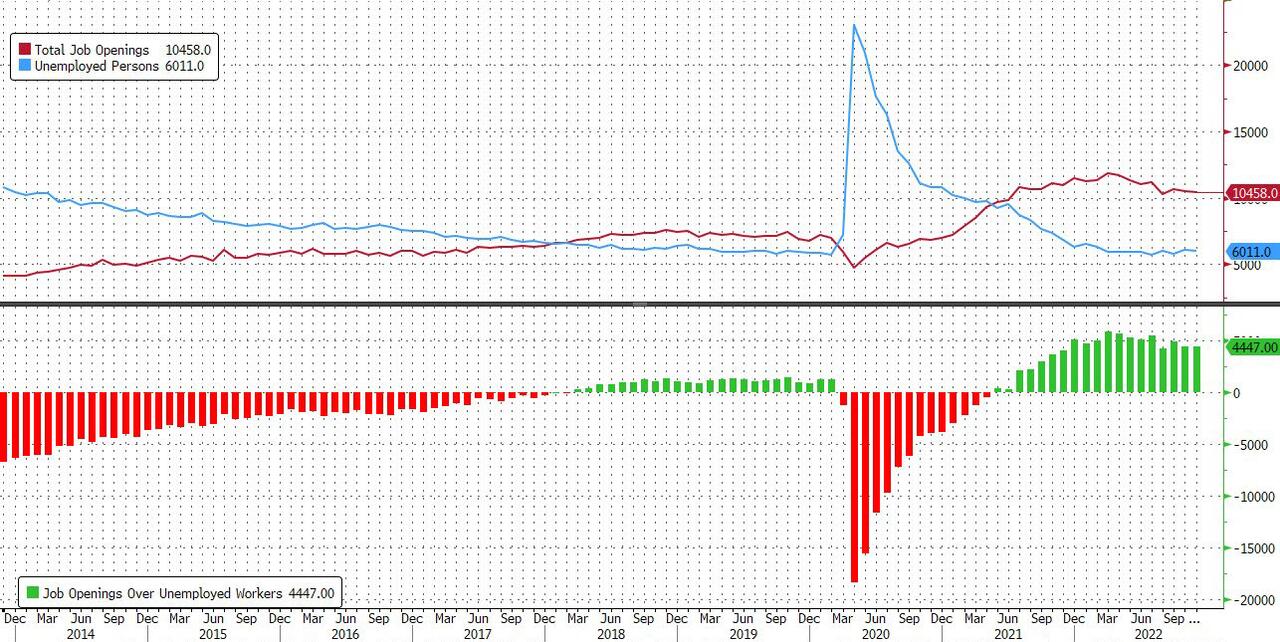
Job Openings came in hotter than expected, despite continued deterioration in hiring, which appears to be a reversal from the prior month. This means that for the second consecutive month there are 4.4 million more jobs than unemployed workers. Hmm…
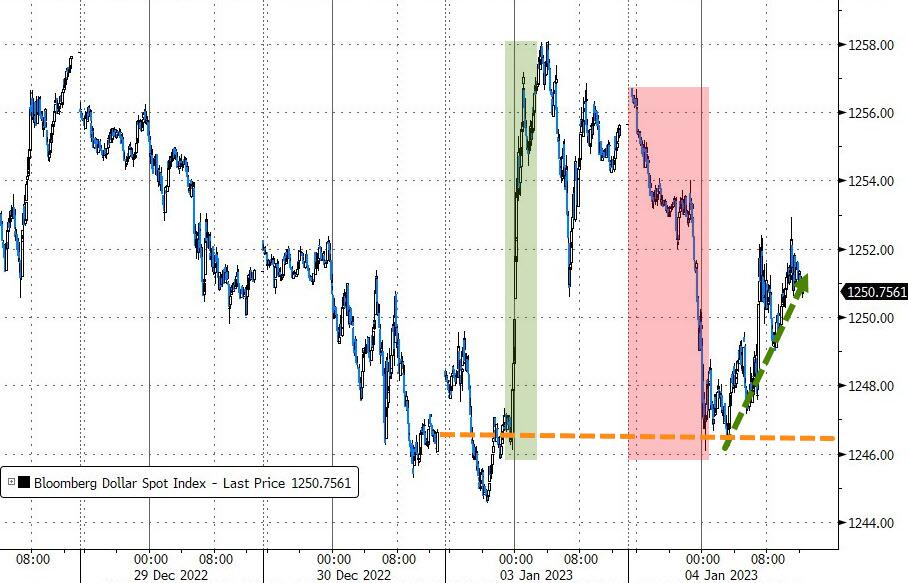
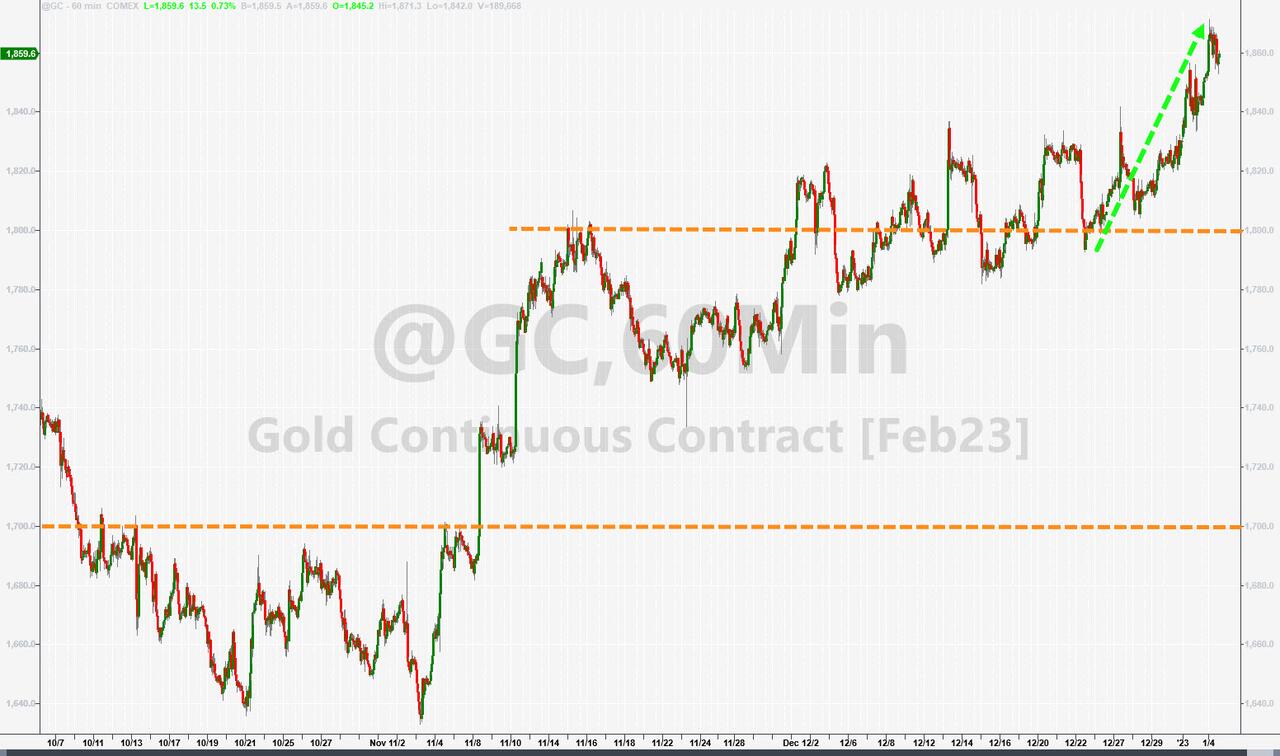
The US Dollar dipped and ripped but ended the session lower. Gold continued to be the steady Eddie and resumed its northerly path by topping $1,870 and reaching its highest level since last June 16th.
The first trading day of 2023 turned into a bit of tug-of-war between bulls and bears, as an early bounce gave way to slow and steady selling, but a last hour rebound kept the damage to a minimum.
The same stand-by problems like rising rates and high inflation continued to concern traders and algos alike, but it was the tech heavyweights Tesla and Apple, which carried forward their bearish theme of last year.
Tesla dumped another -12% and hit its lowest level since August 2020 due to less than expected 4th quarter deliveries. Apple struggled as well with the stock losing 3.7% on announcements that it will cut production due to weak demand caused by a struggling economy, as the tech wreck continues.
On the economic front, the US Manufacturing Index slipped at the fastest rate since May 2020 confirming that recessionary warnings are justified.
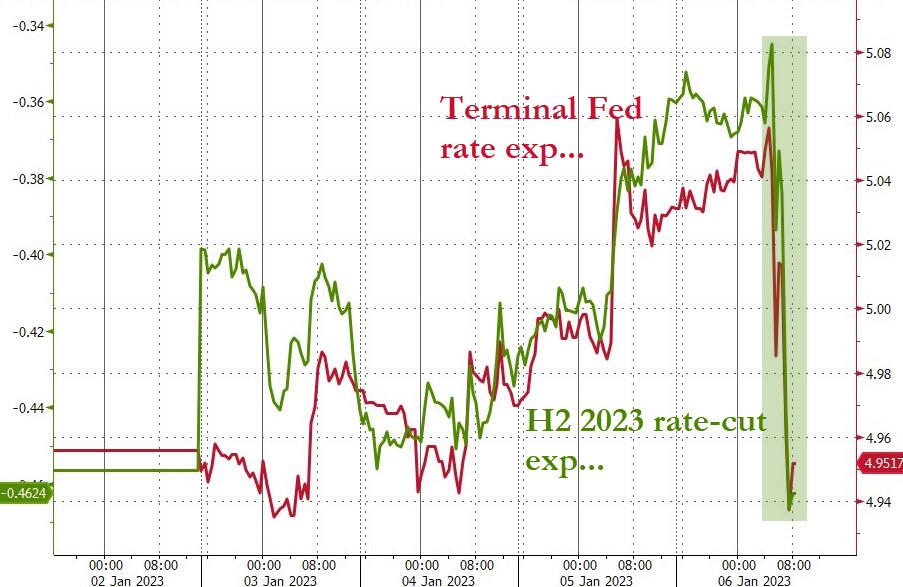
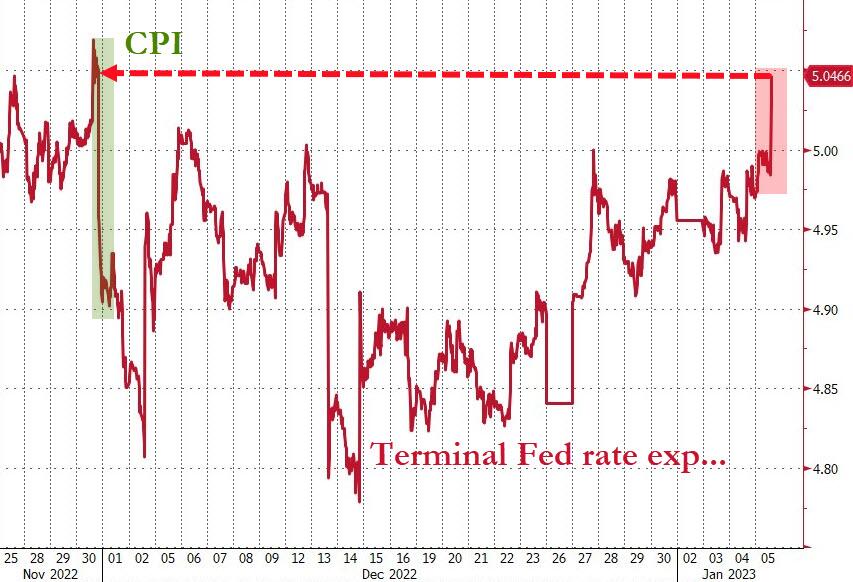
Despite a drop in bond yields, equities were not able to avoid the mid-day dump, as Terminal Fed rate expectations continued their northerly path. The US Dollar ramped higher today and, surprisingly, Gold followed suit and gained a solid 1%.
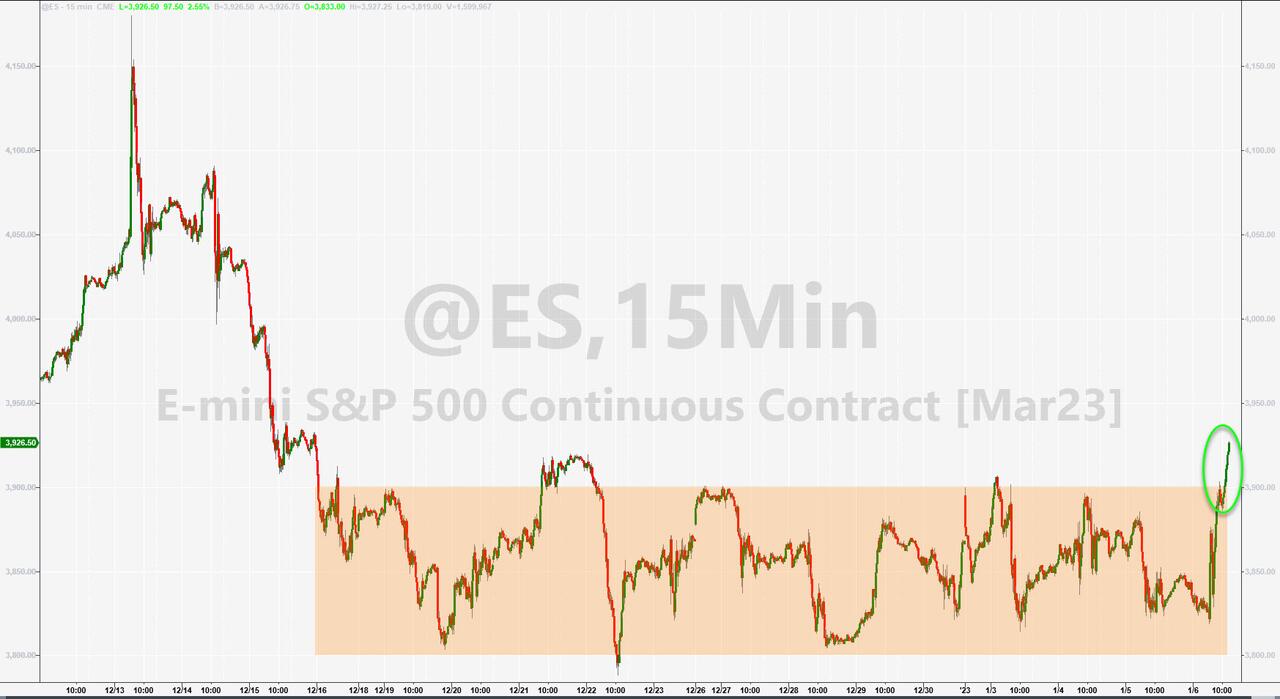
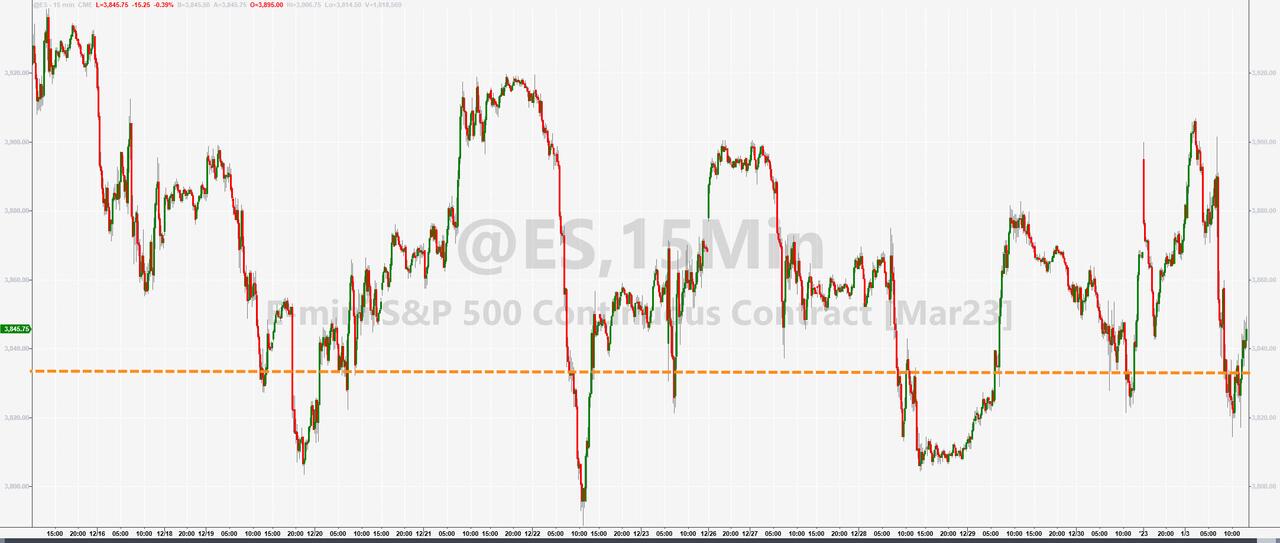
Looking at the big picture of the S&P 500, we can clearly see that trading in a narrow range remains the current theme. A breakout will certainly occur, but in which direction is the big unknown.

