
- Moving the markets
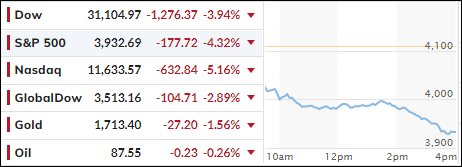
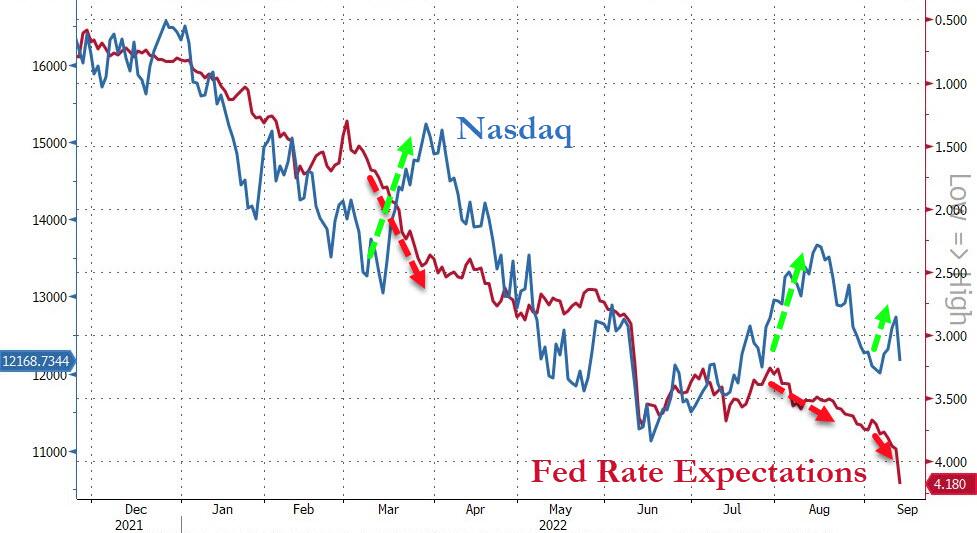
The wishful thinking of traders and algos alike, that peak inflation was behind us, came to a screeching halt today, when the latest CPI number showed a worse than expected reading of 8.3, and that a Fed pivot to lower rates is now nowhere on the horizon.
For months, I have commented ad nauseam that inflation is only in the beginning stages, even though last month’s CPI dropped a tad from the prior one, as if one lower reading represents a trend.
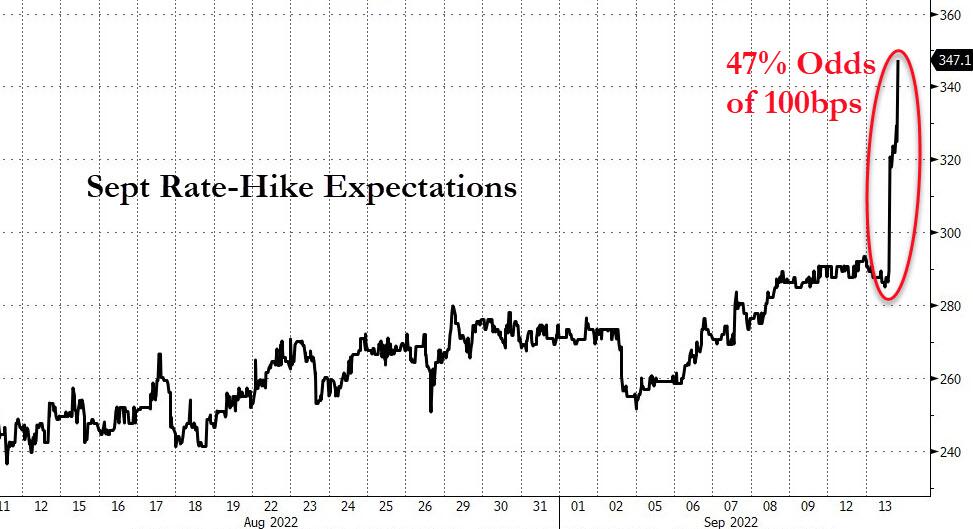
And just like that, the eager front runners, who pushed this market higher, starting after Labor Day, ran into the buzz saw of reality and surrendered all profits in one session. In other words, the dead-cat-bounce has died on the vine, as the Fed will now for sure hike rates at least 75bps next week—or even 100bps.
The major indexes tanked in unison, as not only the Fed’s hopeful pivot disappeared but also the odds of wishful soft landing. The Fed and his staff had made it abundantly clear over the past few weeks that fighting the inflation monster would be their main priority, a theme that was simply dismissed by traders and algos alike, so today, the piper had to be paid for that ignorance.
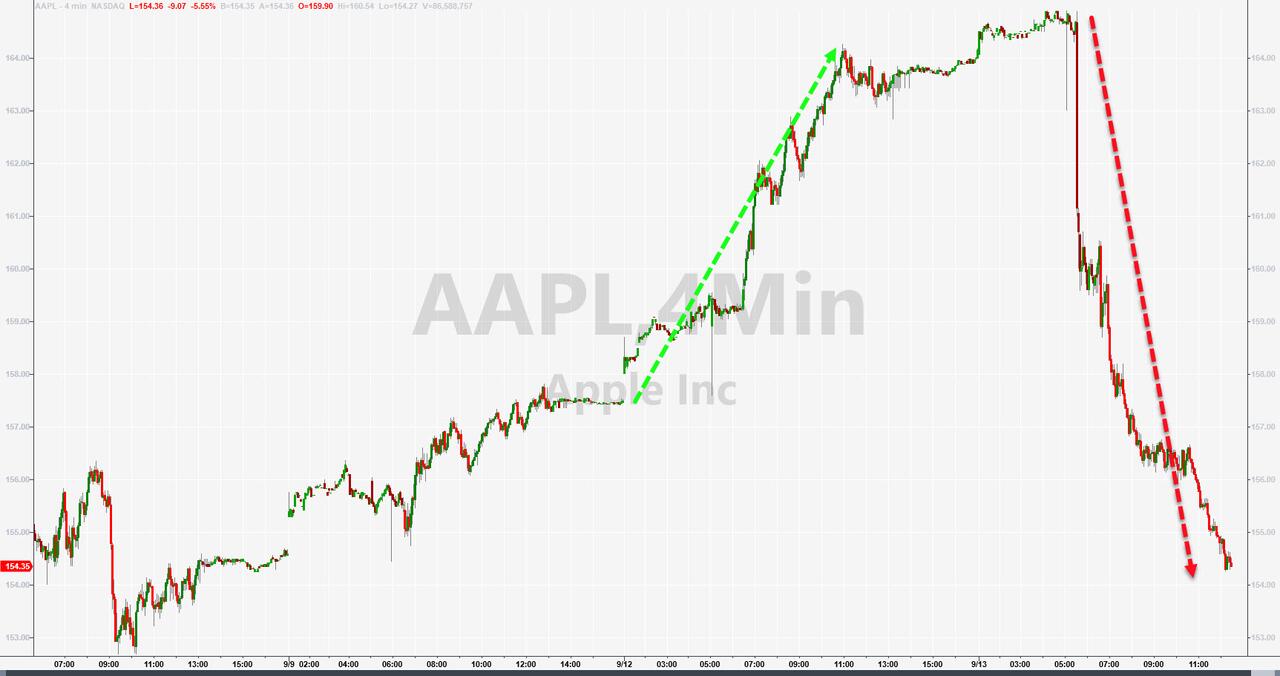
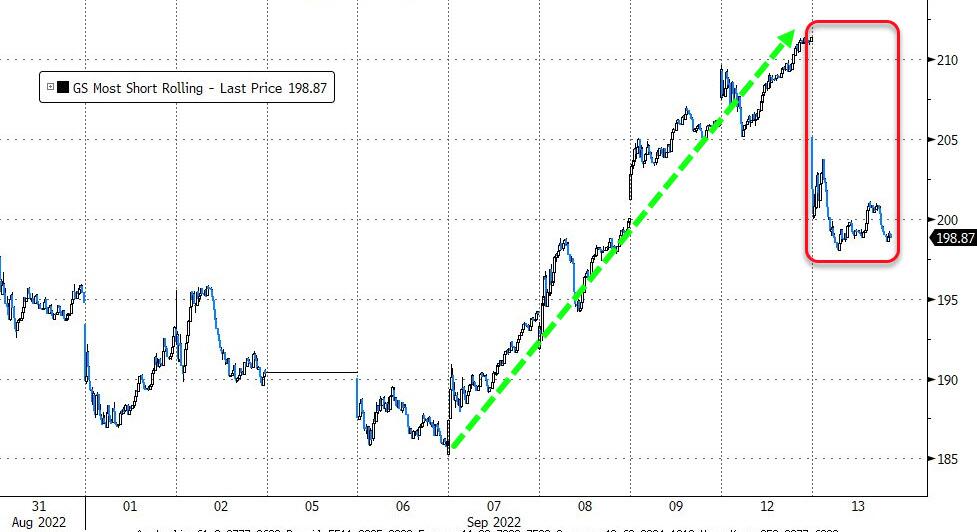
There was no place to hide in this ocean of red, and even Apple, after having its best day since May yesterday, suffered its worst day since May, as ZeroHedge pointed out. That’s the kind of idiotic market environment we’ve been in for a while, with the much talked about short squeeze abruptly coming to an end.
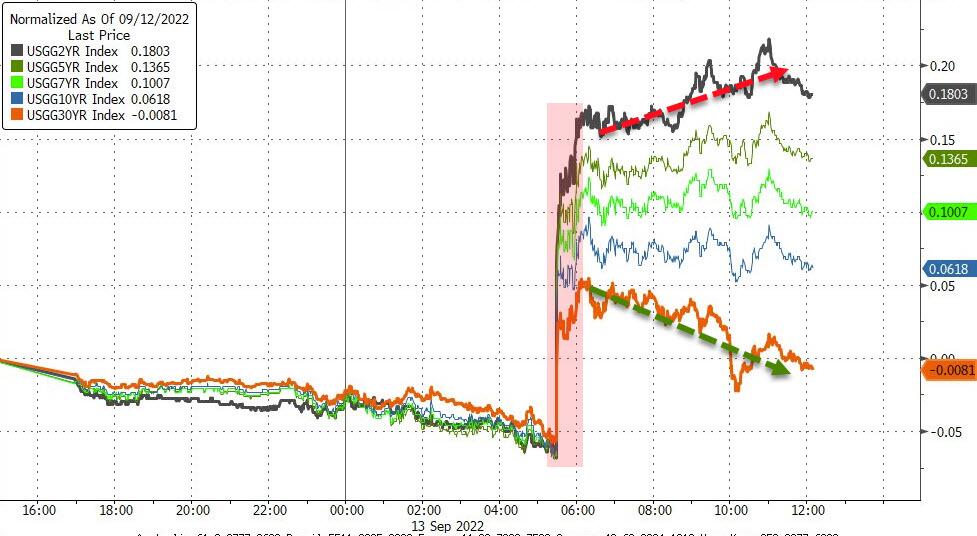
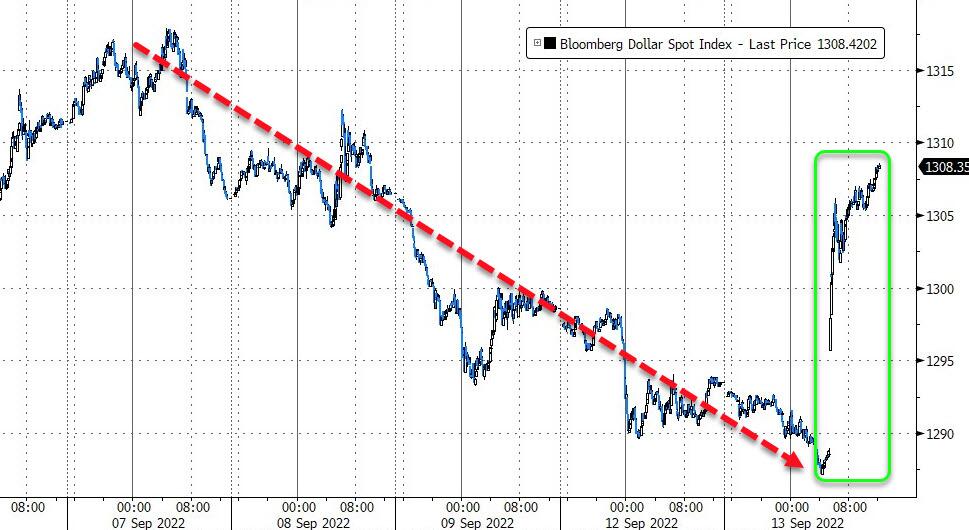
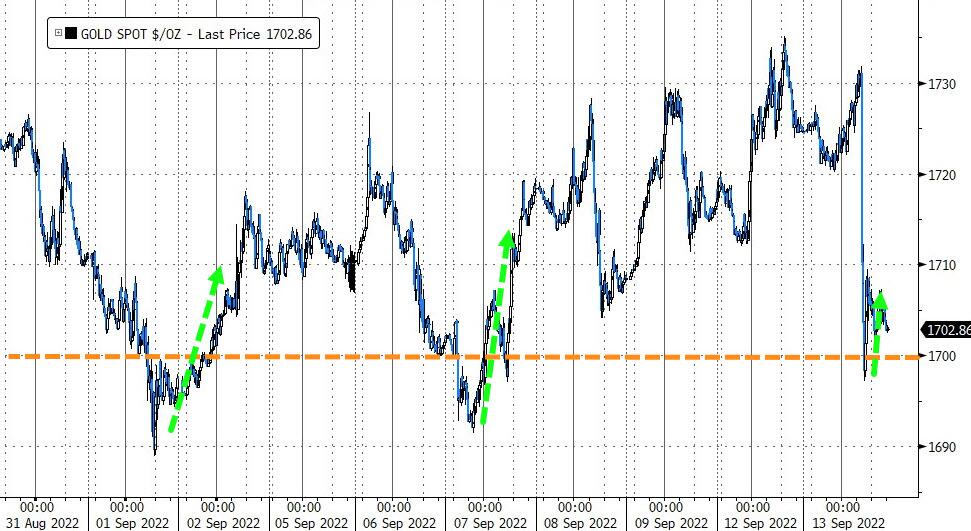
Bond yields screamed higher, as bond prices got slammed with the 10-year rallying 10bps to close at 3.42%. Rate hike expectations surged, while the US Dollar shifted in reverse and rallied thereby taking Gold back down, but the precious metal defended its $1,700 level.
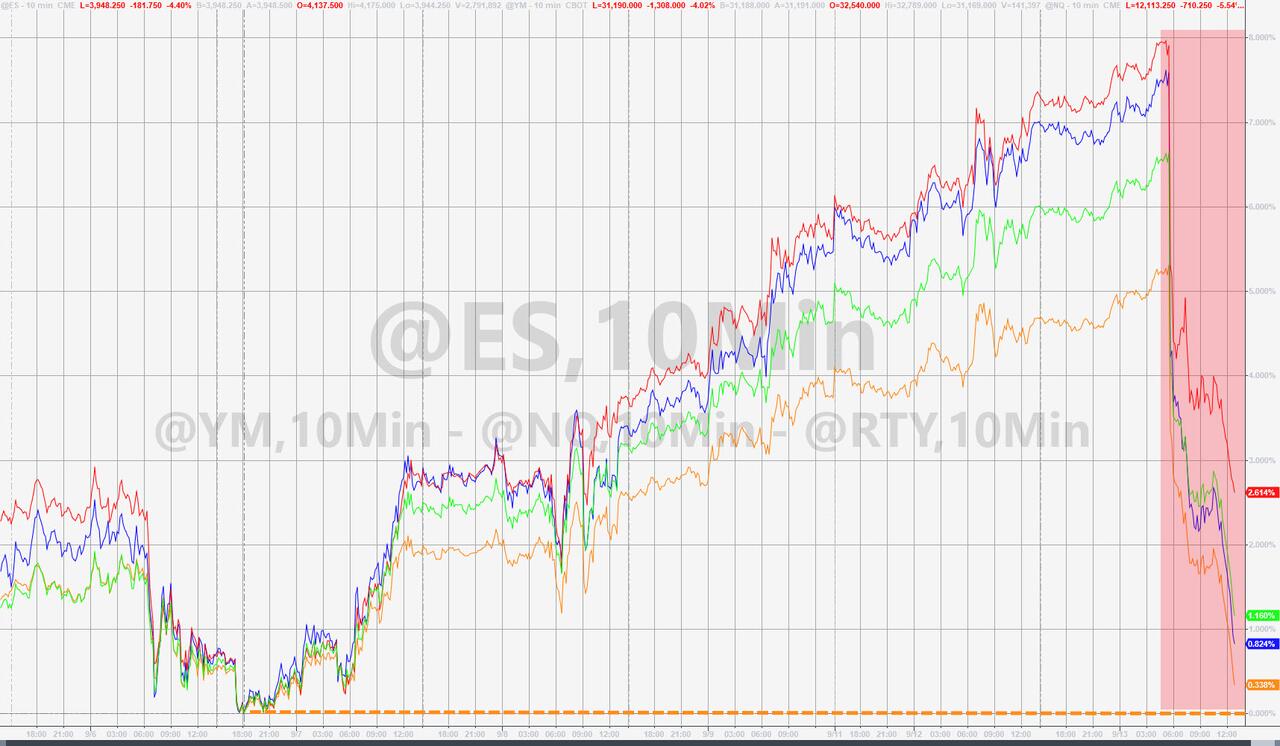
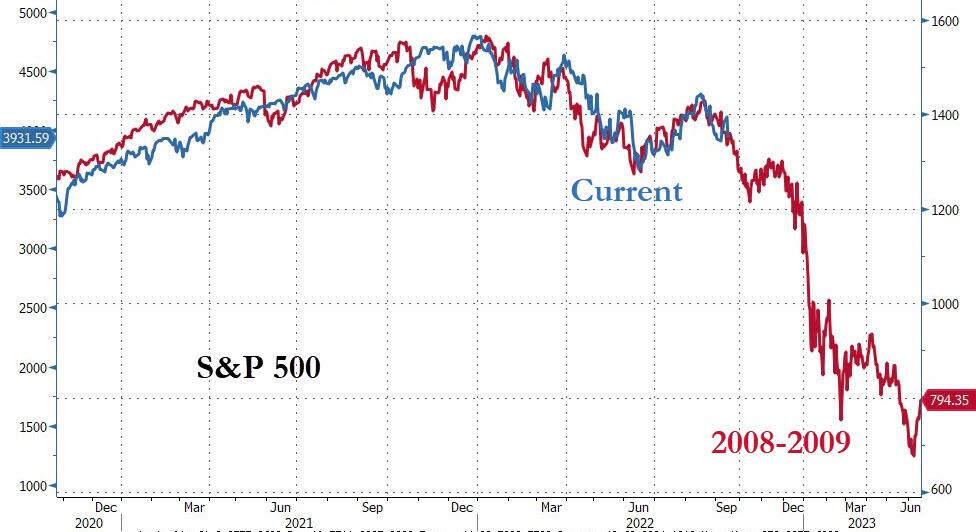
As ZH pointed out with this chart, it’s catch-down time for stocks, and with a $3.2 trillion options expirations day lurking on Friday, will the 2008-2009 analog hold?
As Trend followers, we are out of equities and will watch the show from the safety of the sidelines.
2. ETFs in the Spotlight
In case you missed the announcement and description of this section, you can read it here again.
It features some of the 10 broadly diversified domestic and sector ETFs from my HighVolume list as posted every Saturday. Furthermore, they are screened for the lowest MaxDD% number meaning they have been showing better resistance to temporary sell offs than all others over the past year.
The below table simply demonstrates the magnitude with which these ETFs are fluctuating above or below their respective individual trend lines (%+/-M/A). A break below, represented by a negative number, shows weakness, while a break above, represented by a positive percentage, shows strength.
For hundreds of ETF choices, be sure to reference Thursday’s StatSheet.
For this closed-out domestic “Buy” cycle (2/24/2022), here’s how some of our candidates have fared. Keep in mind that our Domestic Trend Tracking Index (TTI) signaled a “Sell” on that date, which overrode the existing “Buys” shown for SPY and IYM:
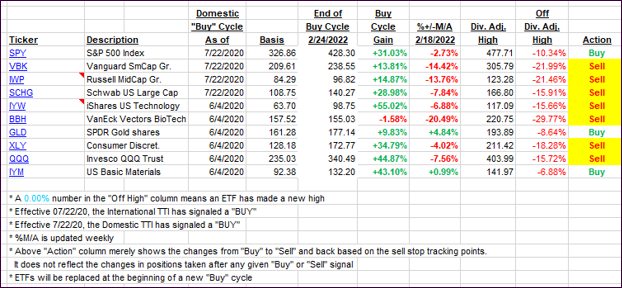
Click image to enlarge.
Again, the %+/-M/A column above shows the position of the various ETFs in relation to their respective long-term trend lines, while the trailing sell stops are being tracked in the “Off High” column. The “Action” column will signal a “Sell” once the -12% point has been taken out in the “Off High” column, which has replaced the prior -8% to -10% limits.
3. Trend Tracking Indexes (TTIs)
Our TTIs got crushed and sank deeper into bear market territory, as traders and algos had to pay a steep price for the incompetence of misreading not only inflation but also the Fed’s intentions.
This is how we closed 09/13/2022:
Domestic TTI: -5.00% below its M/A (prior close -1.08%)—Sell signal effective 02/24/2022.
International TTI: -9.15% below its M/A (prior close -6.50%)—Sell signal effective 03/08/2022.
Disclosure: I am obliged to inform you that I, as well as my advisory clients, own some of the ETFs listed in the above table. Furthermore, they do not represent a specific investment recommendation for you, they merely show which ETFs from the universe I track are falling within the specified guidelines.
All linked charts above are courtesy of Bloomberg via ZeroHedge.
Contact Ulli