
- Moving the markets
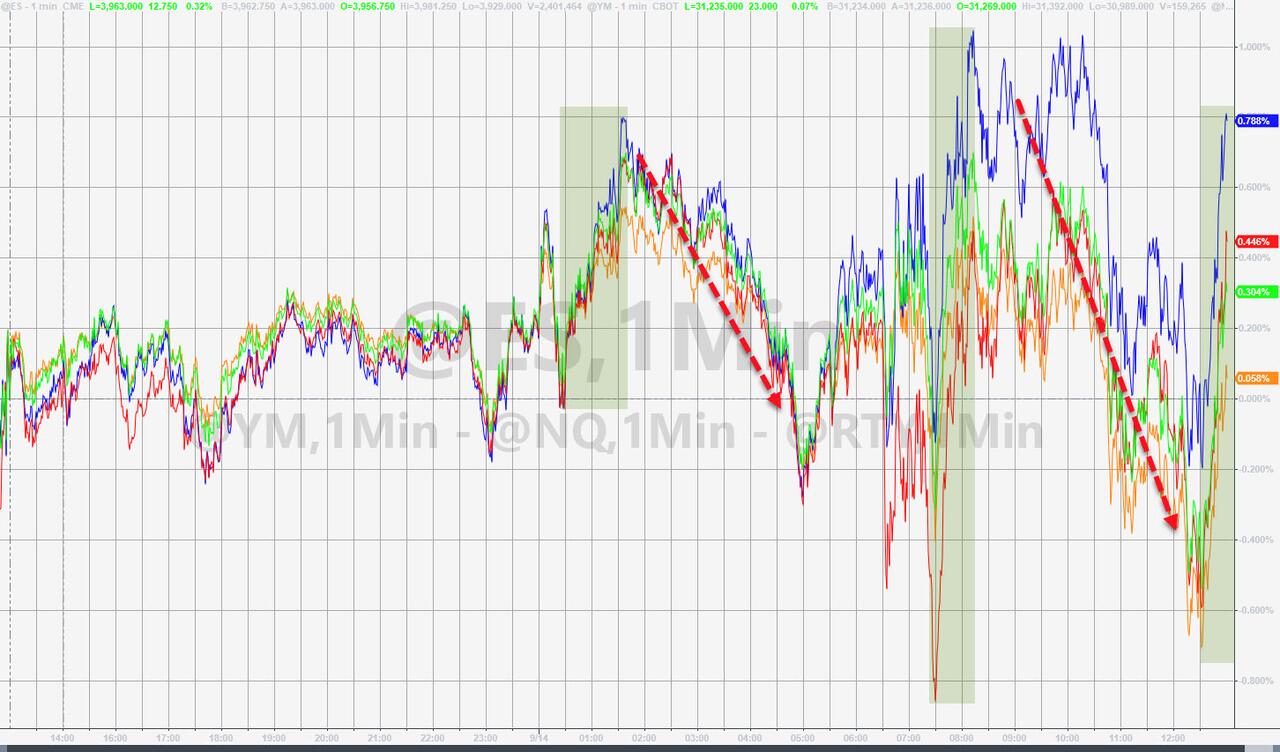
After yesterday’s bloodbath, it came as no surprise that dip buyers surfaced and nibbled hoping to catch the market equivalent of a falling knife. The major indexes vacillated above and below their respective unchanged lines but managed to eke out some small gains, thanks to a last hour rebound.
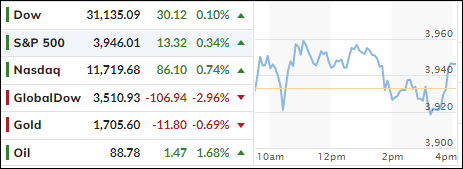
Trying to find some footing during this choppy and sloppy session was the goal, after the indexes notched their biggest one-day drop in more than two years. The Dow was the weakling and barely reached its unchanged line after an early 200-point drop.
Traders are now pondering the uneasy question as to whether equities will head back to their June lows, or even break through that marker and fall much further, as the certainty, that the Fed is serious about fighting inflation, has everyone on edge.
However, in the end, equities could face a double whammy, or a “death blow,” as ZeroHedge called it, when higher rates and lower earnings (from the upcoming economic slowdown) combine forces to push stocks to much lower levels.
After all, when lower rates and a growing economy support higher stock valuations, the opposite also holds true—and that looks to be the direction we are headed.
2. ETFs in the Spotlight
In case you missed the announcement and description of this section, you can read it here again.
It features some of the 10 broadly diversified domestic and sector ETFs from my HighVolume list as posted every Saturday. Furthermore, they are screened for the lowest MaxDD% number meaning they have been showing better resistance to temporary sell offs than all others over the past year.
The below table simply demonstrates the magnitude with which these ETFs are fluctuating above or below their respective individual trend lines (%+/-M/A). A break below, represented by a negative number, shows weakness, while a break above, represented by a positive percentage, shows strength.
For hundreds of ETF choices, be sure to reference Thursday’s StatSheet.
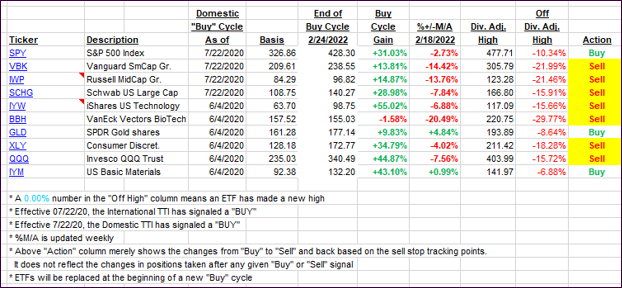
For this closed-out domestic “Buy” cycle (2/24/2022), here’s how some of our candidates have fared. Keep in mind that our Domestic Trend Tracking Index (TTI) signaled a “Sell” on that date, which overrode the existing “Buys” shown for SPY and IYM:
Click image to enlarge.
Again, the %+/-M/A column above shows the position of the various ETFs in relation to their respective long-term trend lines, while the trailing sell stops are being tracked in the “Off High” column. The “Action” column will signal a “Sell” once the -12% point has been taken out in the “Off High” column, which has replaced the prior -8% to -10% limits.
3. Trend Tracking Indexes (TTIs)
Our TTIs remained almost unchanged, as market direction was predominantly sideways.
This is how we closed 09/14/2022:
Domestic TTI: -5.00% below its M/A (prior close -5.00%)—Sell signal effective 02/24/2022.
International TTI: -9.21% below its M/A (prior close -9.15%)—Sell signal effective 03/08/2022.
Disclosure: I am obliged to inform you that I, as well as my advisory clients, own some of the ETFs listed in the above table. Furthermore, they do not represent a specific investment recommendation for you, they merely show which ETFs from the universe I track are falling within the specified guidelines.
All linked charts above are courtesy of Bloomberg via ZeroHedge.
Contact Ulli