Below, please find the latest High-Volume ETF Cutline report, which shows how far above or below their respective long-term trend lines (39-week SMA) my currently tracked ETFs are positioned.
This report covers the HV ETF Master List from Thursday’s StatSheet and includes 312 High Volume ETFs, defined as those with an average daily volume of more than $5 million, of which currently 234 (last report: 236) are hovering in bullish territory. The yellow line separates those ETFs that are positioned above their trend line (%M/A) from those that have dropped below it.
In case you are not familiar with some of the terminology used in the reports, please read the Glossary of Terms. If you missed the original post about the Cutline approach, you can read it here.
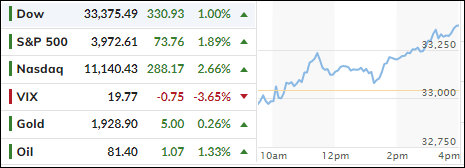
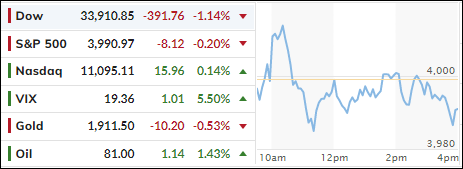
After getting hammered three days in a row, the major indexes finally found some bullish support, despite today’s activity being dominated by options expirations. Hope reigns supreme that equity weakness early in the week was only of a temporary nature.
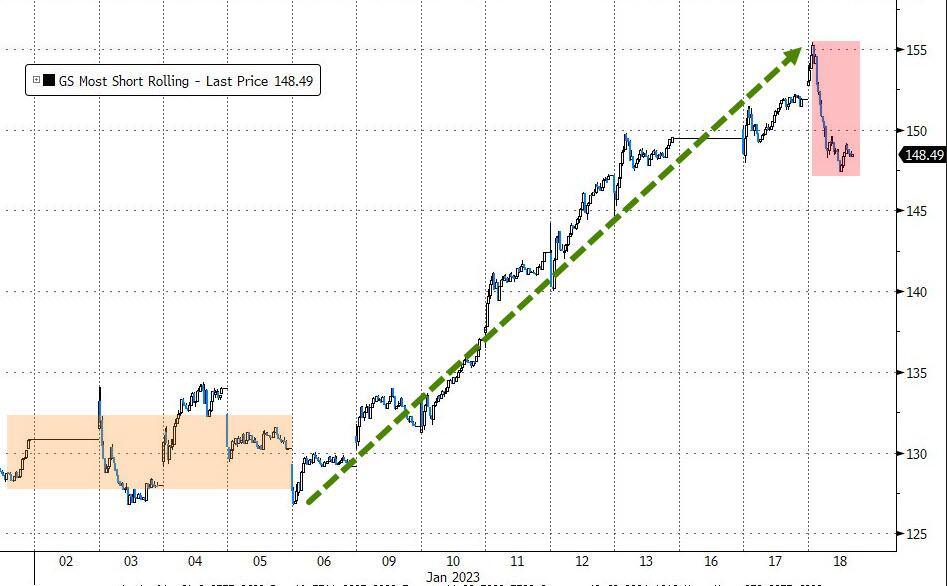
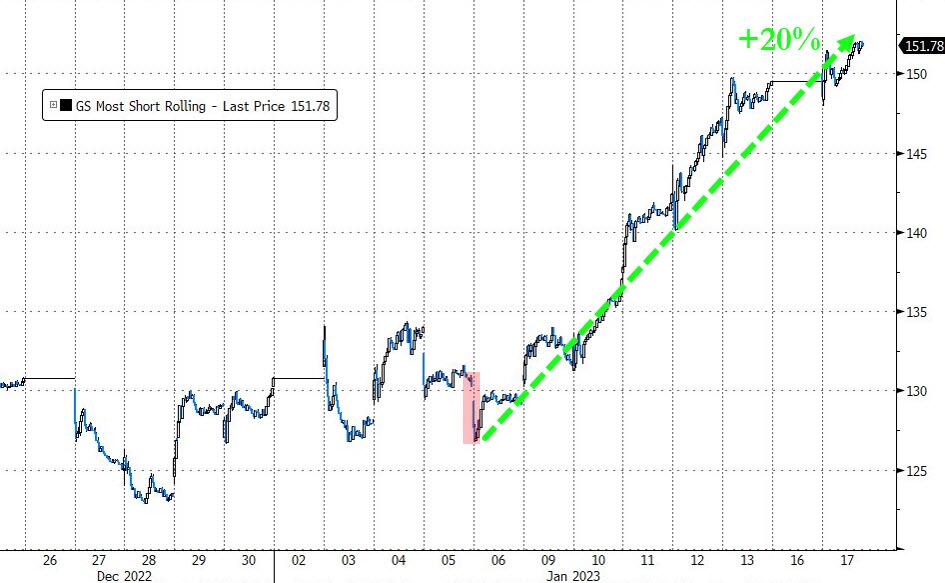
Helping the ascent to higher prices was the recently abandoned short squeeze, which returned after having been absent last Tuesday. The S&P rallied back to its 200-day M/A, which again caused the index to stall—again.
Also assisting the bulls was Netflix, whose shares gained 7% after posting more subscribers than expected, while Alphabet missed quarterly earnings, but its shares rose 5% due to the company’s announcement that 12,000 employees will be laid off.
With 10s of thousands of layoffs having been announced, along with horrific economic data points, JPM’s strategist Lakos-Bujas, was the only one assessing the current market scenario with a sense of reality:
Lately, equities have been shrugging off bad economic news and rising on weaker [economic] data and lower yields. However, we don’t see this relationship persisting and expect weaker guidance to put downward pressure on equities.
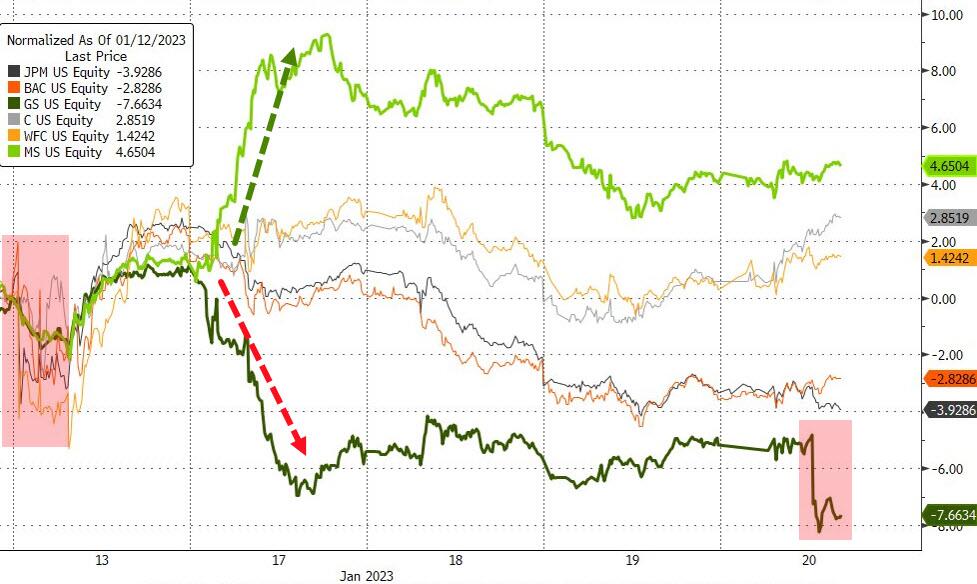
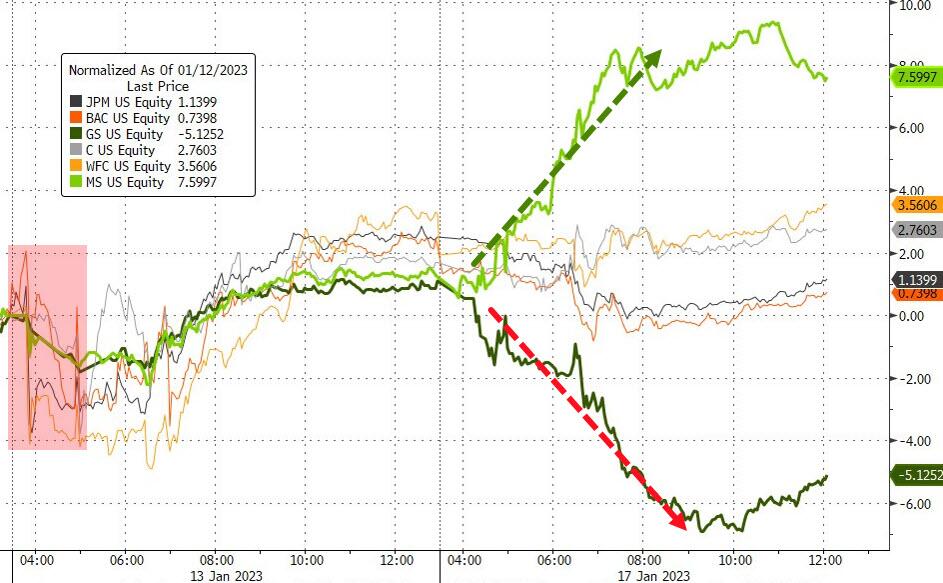
The big banks’ earnings picture was very mixed, as ZeroHedge pointed out, because Morgan Stanley led the pack to the upside, while Goldman Sachs was the downside leader.
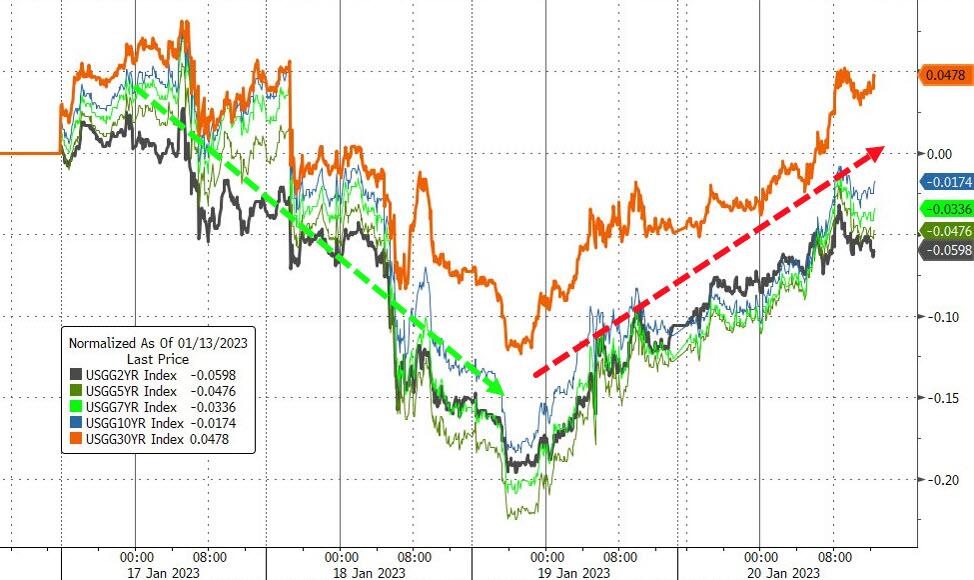
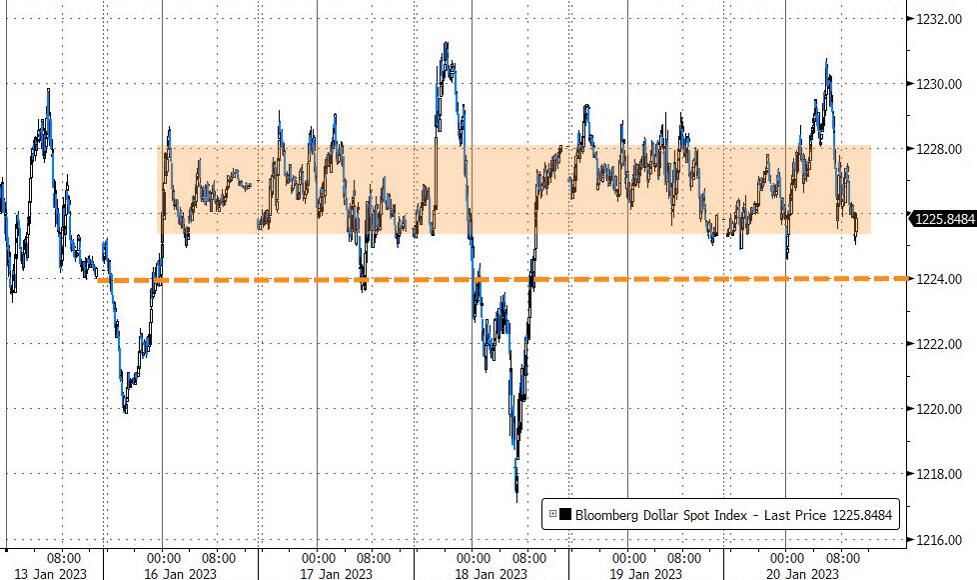
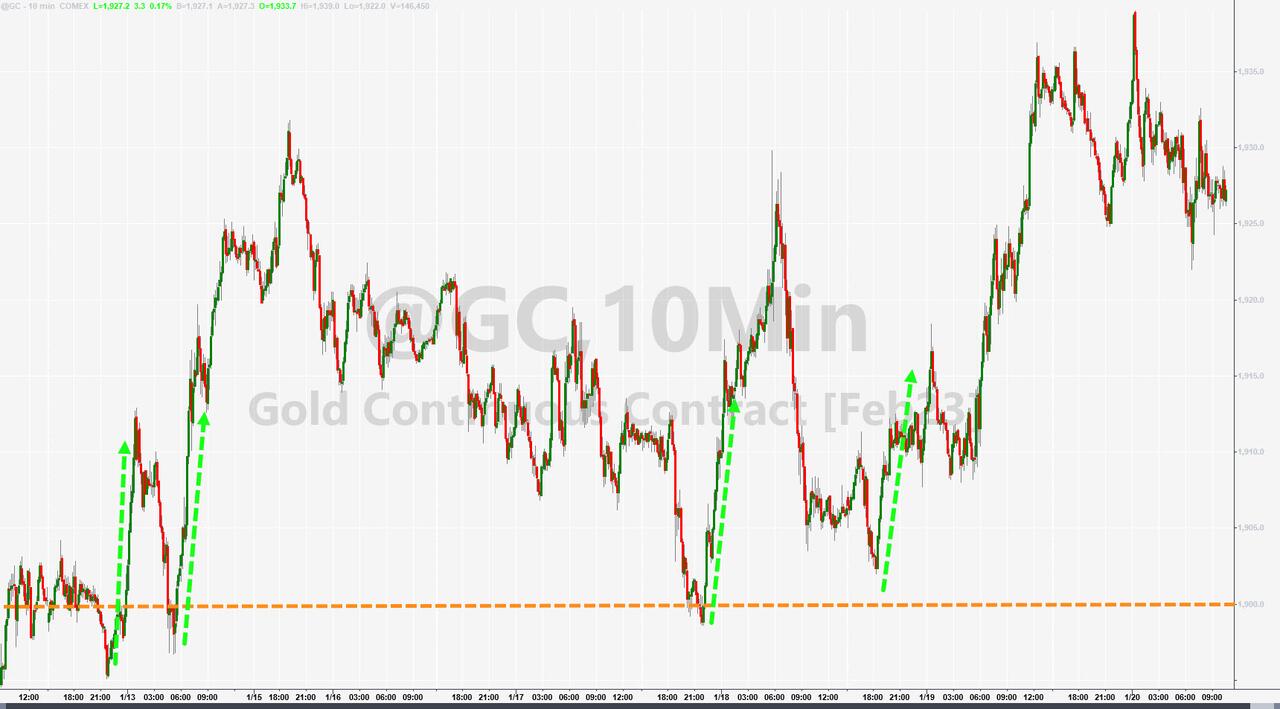
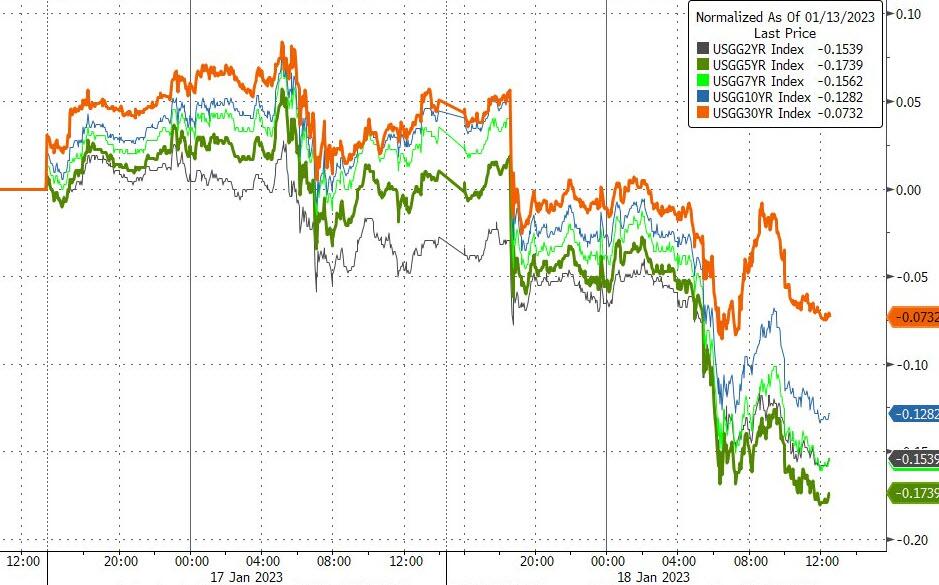
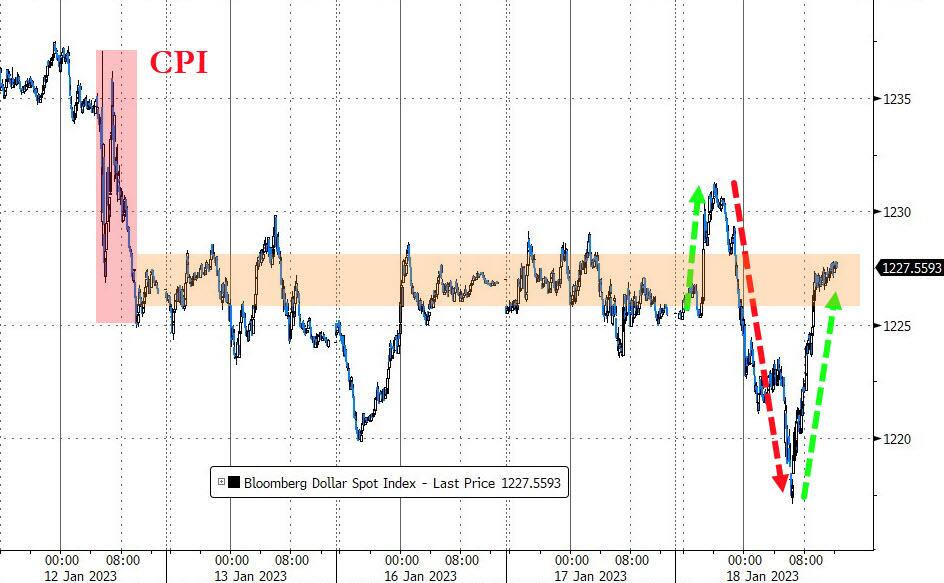
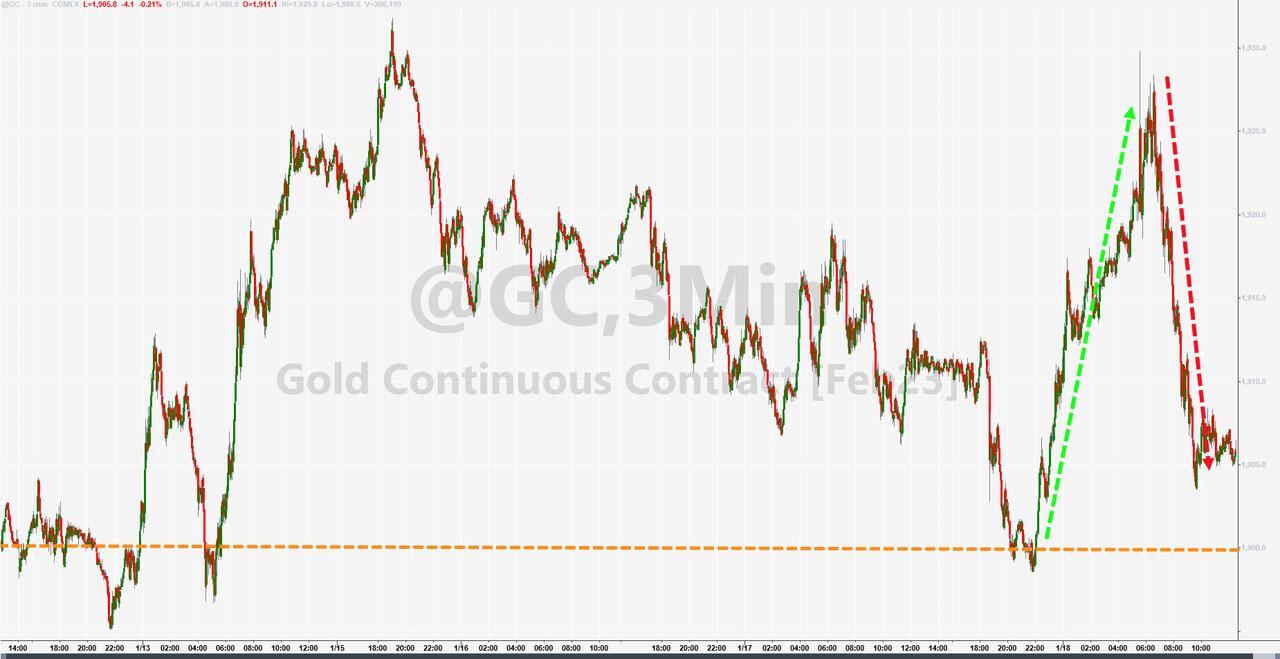
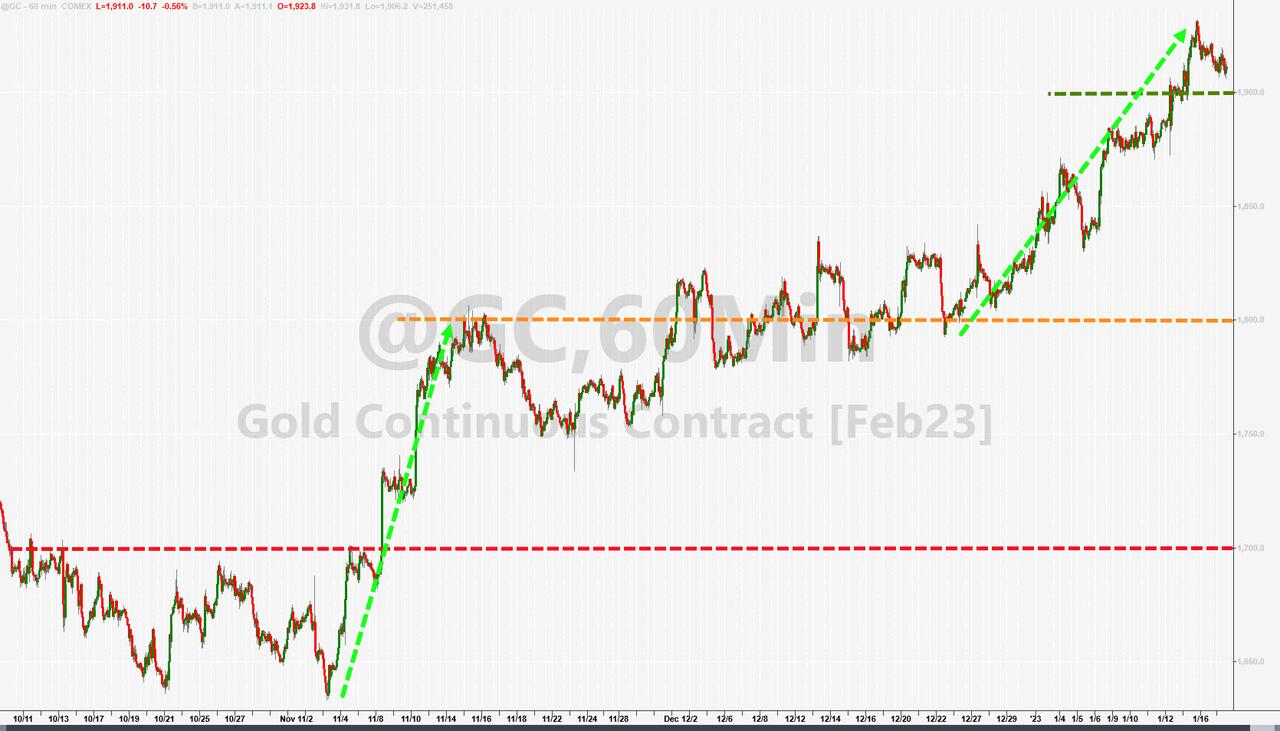
Bond yields dumped midweek but managed to recover to end the week just about unchanged. The US Dollar continued to ride the range, despite a couple of breakout/breakdown attempts, as Gold closed the week at its highest since April last year, with the $1,900 level now being a support point.
Will this week-ending upward momentum be enough to not only carry over into next week but also propel the S&P 500 above its 200-day M/A to continue the bullish theme?
ETF Data updated through Thursday, January 19, 2023
Methodology/Use of this StatSheet:
1. From the universe of over 1,800 ETFs, I have selected only those with a trading volume of over $5 million per day (HV ETFs), so that liquidity and a small bid/ask spread are assured.
2. Trend Tracking Indexes (TTIs)
Buy or Sell decisions for Domestic and International ETFs (section 1 and 2), are made based on the respective TTI and its position either above or below its long-term M/A (Moving Average). A crossing of the trend line from below accompanied by some staying power above constitutes a “Buy” signal. Conversely, a clear break below the line constitutes a “Sell” signal. Additionally, I use a 12% trailing stop loss on all positions in these categories to control downside risk.
3. All other investment arenas do not have a TTI and should be traded based on the position of the individual ETF relative to its own respective trend line (%M/A). That’s why those signals are referred to as a “Selective Buy.” In other words, if an ETF crosses its own trendline to the upside, a “Buy” signal is generated. Here too, I recommend trailing sell stop of 12%, or less, depending on your risk tolerance.
If you are unfamiliar with some of the terminology, please see Glossary of Termsand new subscriber information in section 9.
1. DOMESTIC EQUITY ETFs: BUY — since 12/01/2022
Click on chart to enlarge
Our main directional indicator, the Domestic Trend Tracking Index (TTI-green line in the above chart) has reclaimed its long-term trend line (red) by +3.01% and remains in “Buy” mode for the time being.
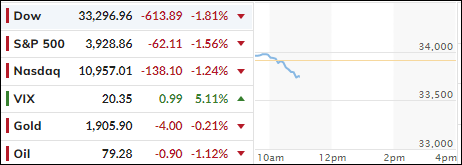
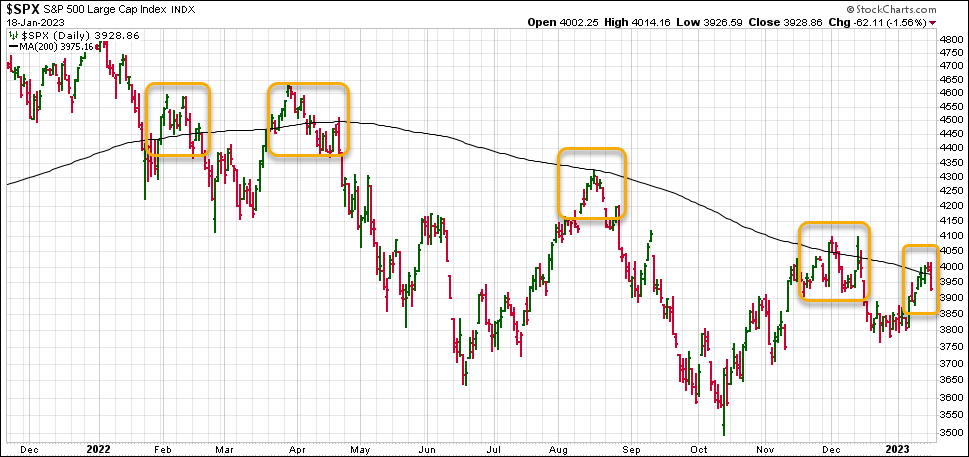
The markets took a hit today, as January’s bullish momentum ran into a glass ceiling, namely the S&P’s 200-day M/A, which had derailed every rally in 2022, as this chart shows:
Only time will tell, if this is the beginning of another leg down, after the S&P has now “lost” its 200-day M/A again.
Contributing to today’s Dump-A-Thon were weak economic data points, including huge misses in Producer Price Index (PPI), retail sales and industrial production confirming once again that the economy continues to slide into recession territory. With Microsoft planning on laying off some 10k employees, the Dow suffered the most from today’s sell off.
Sure, after 2 weeks of bullishness, some profit taking has set in, but more so the realization that a recessionary environment is not conducive to higher earnings, because it ultimately decides the value of stock prices.
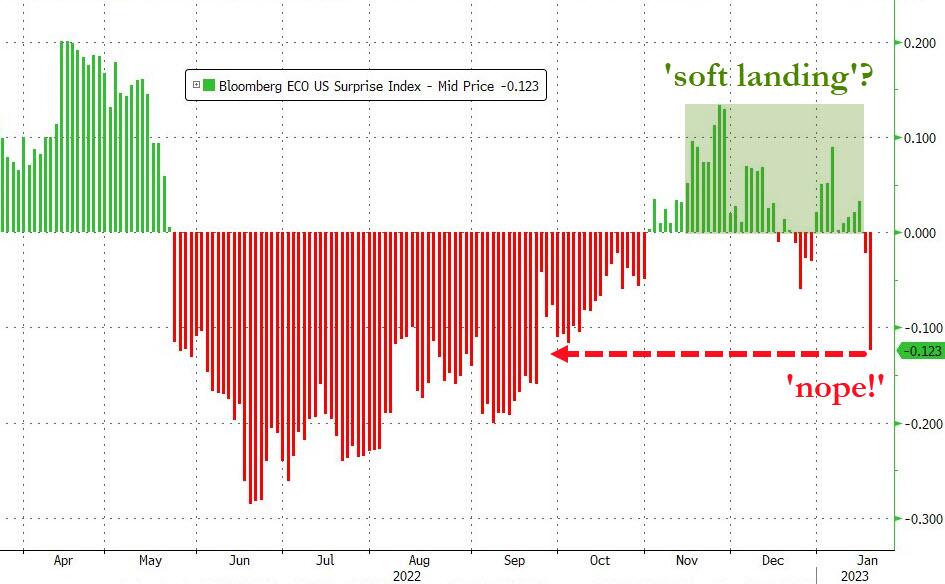
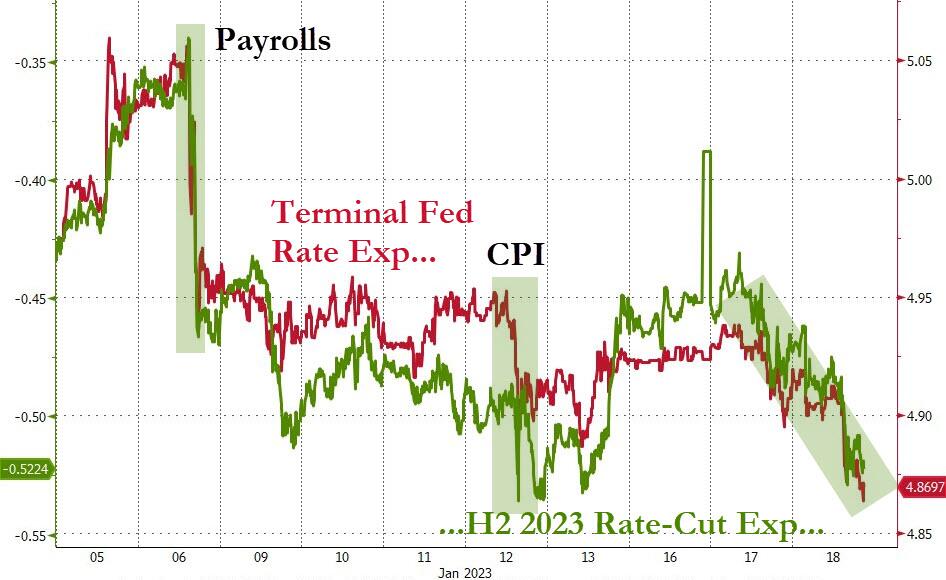
The theme of a soft landing was put on the back burner, as odds of an eventual hard landing have increased due to the above-mentioned weak data points. Even the Fed’s terminal rate expectation took a hit, as traders are convinced that the Fed will pause in May and then begin a massive rate-cutting pivot, as ZeroHedge described it.
That wishful thinking is totally engrained in the Wall Street community, so much so that despite multiple Fed mouthpieces today agreeing that “inflation is down but not enough to stop yet and rates will go higher and stay higher for longer,” market participants are stubbornly sticking to their opposite view.
And, as you might have expected on a sell off like today, the short squeezers had no ammo left for another bullish assist.
Bond yields plummeted with the 10-year dropping to a level last seen in September. After riding the intra-day roller coaster, the US Dollar ended just about unchanged. Gold followed a similar pattern and closed a tad lower but remained above its $1,900 level.
Another battle will be starting tomorrow, as the debt ceiling limit makes its presence known. This may turn into an endless and possibly market moving tug-of-war, until final decisions will have to be made by around June 2023, before the national credit card expires.
Bank earnings took front and center, as Morgan Stanley posted better-than-expected numbers, thereby pushing up its stock price +6%. However, banking powerhouse Goldman Sachs reported its worst earnings miss in a decade, with its stock price being pummeled at the tune of -6%. JPM’s and Citigroup’s results were mixed.
As a result, the effect on the major indexes diverged, with the Dow losing some 400 points, thanks to Goldman Sachs, the S&P 500 dropping a tiny -0.2%, while the Nasdaq squeezed out a green close, albeit a tiny one.
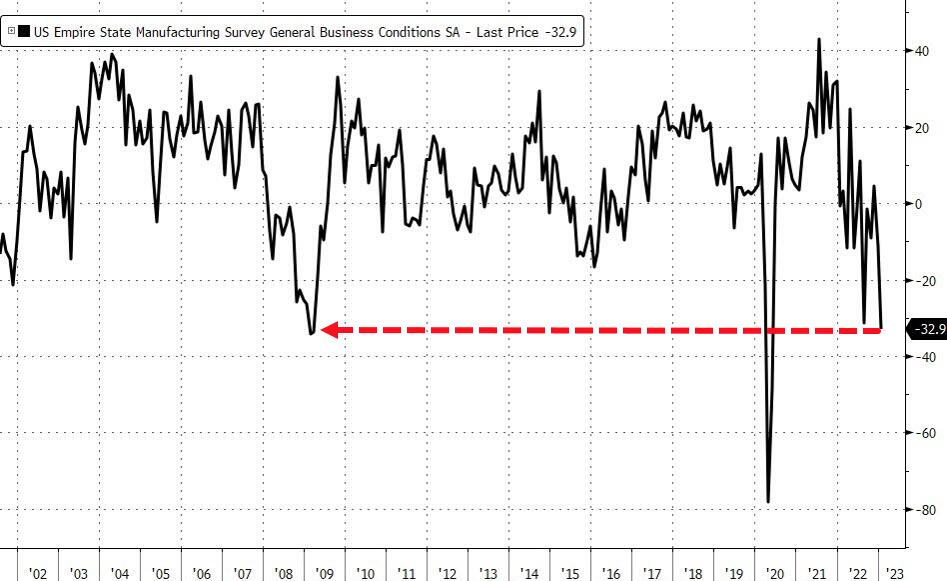
On the economic front, we learned that the Manufacturing Survey, which shows the NY Fed’s general business conditions, simply collapsed, with the index dropping nearly 22 points to -32.9 this month, which was twice as bad as the weakest analyst estimate, as ZeroHedge pointed out.
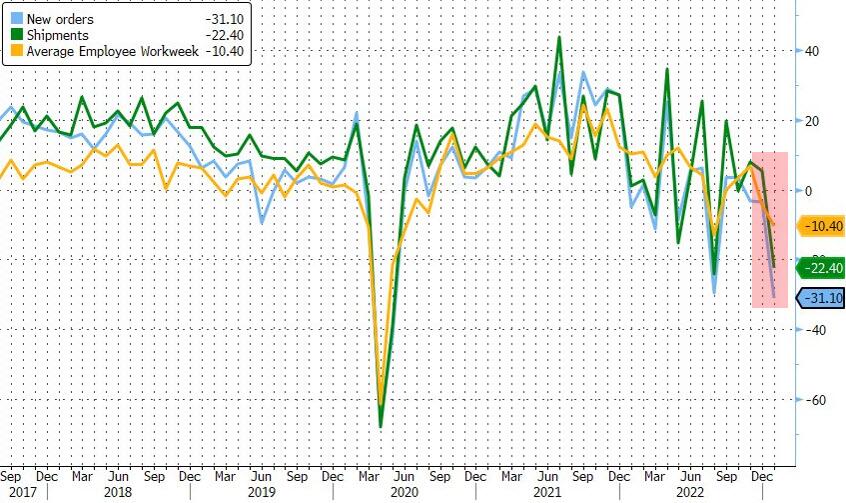
There was no bright spot in the report, as New Orders dropped, Shipments plunged, and Factory Employment fell to its weakest level in more than two years. Ouch! But, not to worry, the theme of a “soft landing” is alive and well.
Bond yields were mixed today, the short squeeze continued, the dollar drifted lower, and Gold slipped but remained above its $1,900 level.
Hope continues in the trading community that the Fed will pause or cut rates soon, which is not likely, as lessons learned point to 1980. It was the moment in time when then Fed chairman Volcker cut rates too soon, after the CPI slipped, only to see inflation roar back forcing him to reverse course and go back into hiking mode. Bloomberg demonstrates that phenomenon in this chart.
This is something that the Wall Street crowd has not begun to grasp yet, but once they do, the bears will have a good chance to dominate market direction again.
Below, please find the latest High-Volume ETF Cutline report, which shows how far above or below their respective long-term trend lines (39-week SMA) my currently tracked ETFs are positioned.
This report covers the HV ETF Master List from Thursday’s StatSheet and includes 312 High Volume ETFs, defined as those with an average daily volume of more than $5 million, of which currently 236 (last report: 179) are hovering in bullish territory. The yellow line separates those ETFs that are positioned above their trend line (%M/A) from those that have dropped below it.
In case you are not familiar with some of the terminology used in the reports, please read the Glossary of Terms. If you missed the original post about the Cutline approach, you can read it here.

