
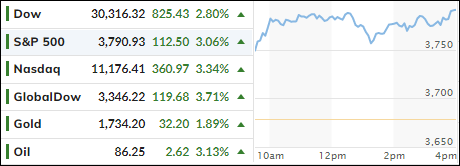
- Moving the markets
For the second day in a row, the markets rebounded sharply based on the idea that the Fed is due to pivot and implement a more dovish stance with its monetary policy. Never mind that all this is merely perception and not reality at all.
But to the frontrunning traders and algos none of that matters and reality is simply ignored, despite John Williams, President of the NY Fed, giving a speech, which included the following nuggets:
- Inflation is far too high.
- Our job of cooling demand and reducing inflationary pressures is not yet done.
- The drop in commodities prices is “not enough” to “bring down” the “broad-based inflation” caused by goods demand as well as labor and services demand.
Hmm, I don’t see a hint of a pivot and neither did other observers, leading Morgan Stanley’s strategist Mike Wilson to issue a host of warnings:
- Stocks will continue to fall even after the Fed pivots
- They will likely be headed lower for the foreseeable future, as volatility across equities, bonds, commodities, and currencies could remain elevated
- As interest rates continue to rise and the Fed keeps shrinking its balance sheet, it could risk provoking a crisis somewhere in the world, or even in the U.S. This is because higher interest rates create a drag on the U.S. economy by making it more expensive for corporations and households to borrow money, while a stronger dollar makes it more difficult for emerging economies to pay back debt denominated in dollars.
For sure, after the beating equities have taken this year, a periodic rebound is to be expected, and we have seen this pattern repeated throughout 2022, yet every time lower lows were subsequently made:
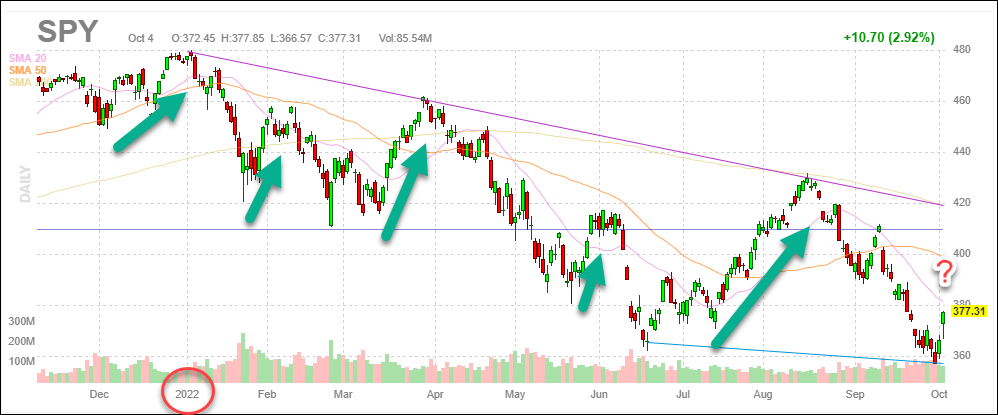
Will this time be different?
Analyst Graham Summers summed the outcome up like this:
The Fed will no doubt pivot at some point… but it’s not doing so now. And the market’s action has made the likelihood of a pivot MUCH lower.
So, enjoy the relief rally… but don’t plan on it lasting for long. Because the Great Crisis… the one to which 2008 was a warm-up, has finally arrived.
On the economic front, we saw the biggest crash in job openings on record (outside of global Covid lockdown), as ZeroHedge posted. Openings tumbled to just about 10 million from a revised July print of 11.1 million. Ouch!
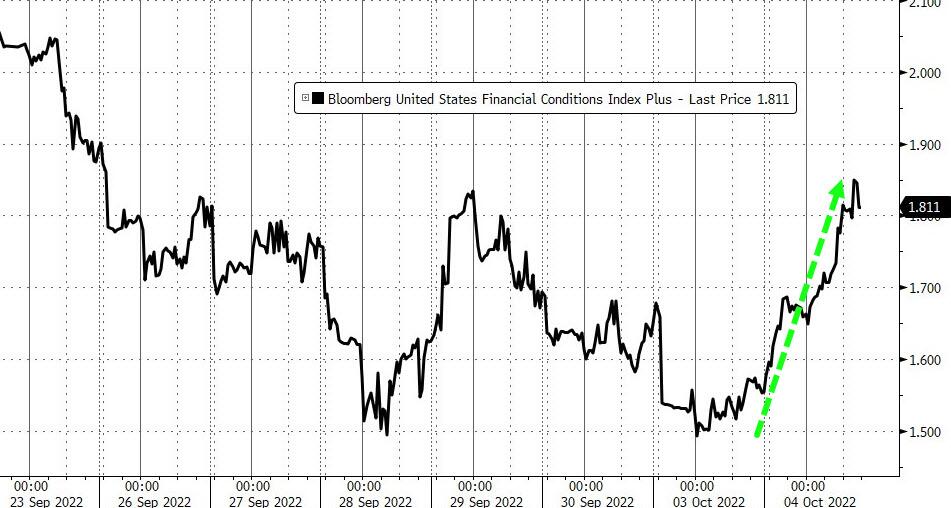
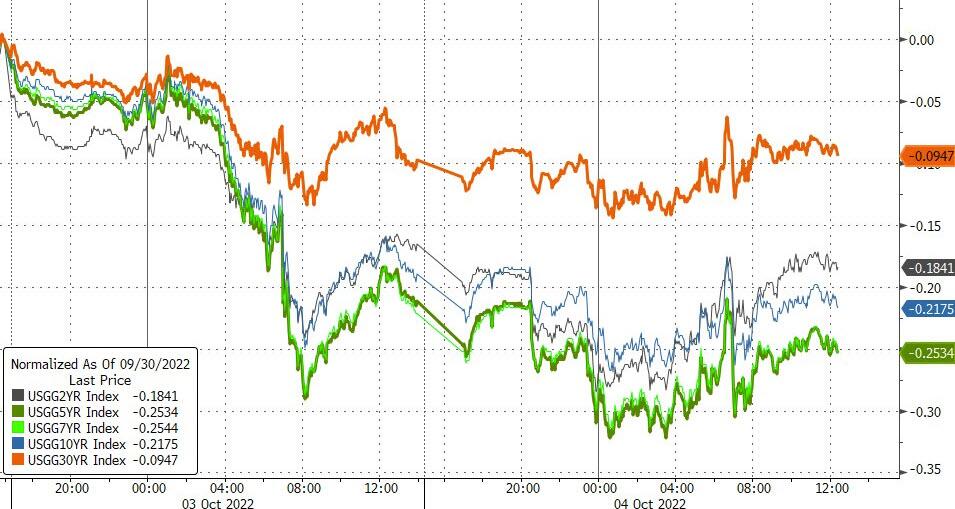
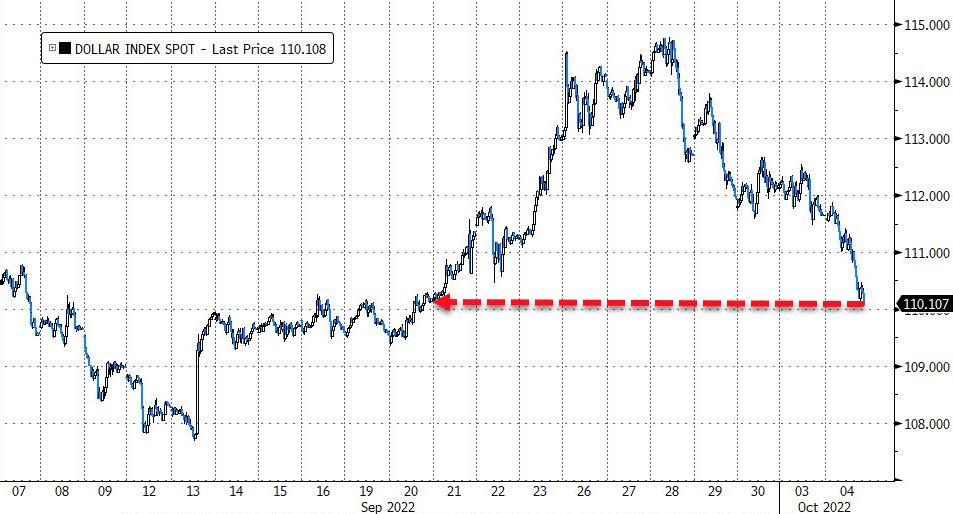
Financial conditions eased as bond yields and the US Dollar fell, but ZeroHedge offered this caution, which goes along with the above:
However, if anything, the market’s action over the last two days makes a Fed pivot less likely any time soon. With both Treasury yields and the dollar falling, rate and liquidity pressures are much lower than they were last week… reducing the pressure on Powell to go full ‘Bank of England’… and round and round goes the big reflexive wheel of leverage.
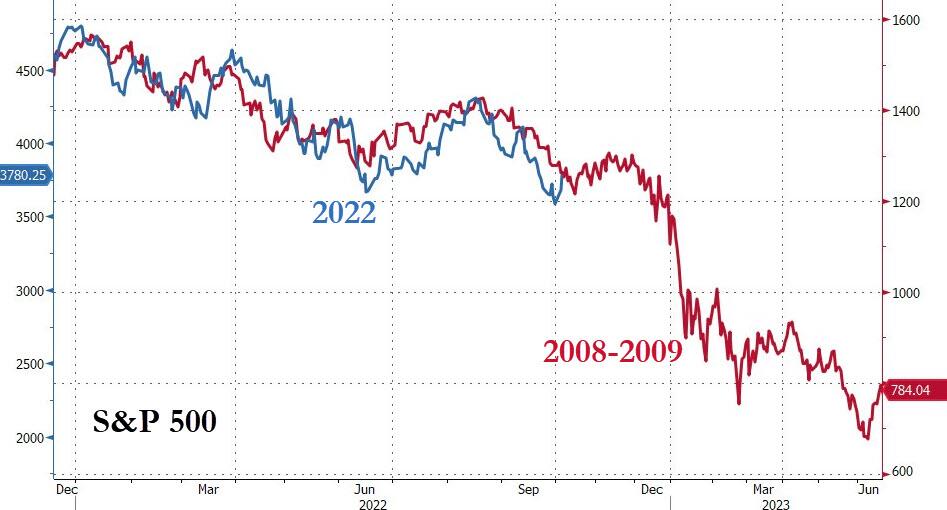
Despite the violent market behavior of the recent past, the analog to 2008-2009 is still on target.
2. ETFs in the Spotlight
In case you missed the announcement and description of this section, you can read it here again.
It features some of the 10 broadly diversified domestic and sector ETFs from my HighVolume list as posted every Saturday. Furthermore, they are screened for the lowest MaxDD% number meaning they have been showing better resistance to temporary sell offs than all others over the past year.
The below table simply demonstrates the magnitude with which these ETFs are fluctuating above or below their respective individual trend lines (%+/-M/A). A break below, represented by a negative number, shows weakness, while a break above, represented by a positive percentage, shows strength.
For hundreds of ETF choices, be sure to reference Thursday’s StatSheet.
For this closed-out domestic “Buy” cycle (2/24/2022), here’s how some of our candidates have fared. Keep in mind that our Domestic Trend Tracking Index (TTI) signaled a “Sell” on that date, which overrode the existing “Buys” shown for SPY and IYM:
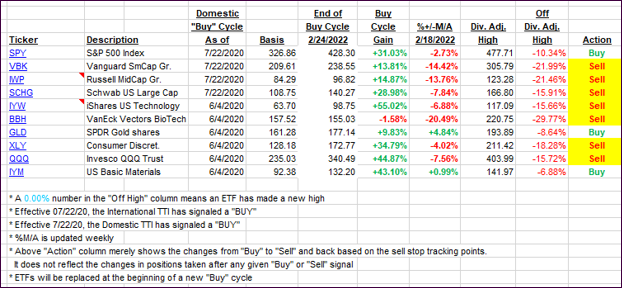
Click image to enlarge.
Again, the %+/-M/A column above shows the position of the various ETFs in relation to their respective long-term trend lines, while the trailing sell stops are being tracked in the “Off High” column. The “Action” column will signal a “Sell” once the -12% point has been taken out in the “Off High” column, which has replaced the prior -8% to -10% limits.
3. Trend Tracking Indexes (TTIs)
Our TTIs took some large leaps over the past couple of trading days and dug themselves out of a deep hole. Still, they will have a ways to go before a new “Buy” signal is generated.
This is how we closed 10/04/2022:
Domestic TTI: -7.34% below its M/A (prior close -10.43%)—Sell signal effective 02/24/2022.
International TTI: -12.07% below its M/A (prior close -15.19%)—Sell signal effective 03/08/2022.
Disclosure: I am obliged to inform you that I, as well as my advisory clients, own some of the ETFs listed in the above table. Furthermore, they do not represent a specific investment recommendation for you, they merely show which ETFs from the universe I track are falling within the specified guidelines.
All linked charts above are courtesy of Bloomberg via ZeroHedge.
Contact Ulli