
- Moving the markets
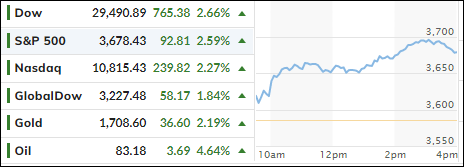
After last month’s thrashing, during which the S&P 500 lost -9.3%, it comes as no surprise that a rebound from a very oversold condition materialized, as the markets welcomed October with a bullish bounce.
Following the recent debacle in the UK, when the BoE reversed its tough talk of hiking rates to fight inflation, by hurriedly starting a new QE program to stem the fall of its bond (gilts) market to bail out potentially failing pension funds, the rest of the world took notice.
It now seems that, despite tough talk to the opposite, the BoE, instead of proceeding with their Quantitative Tightening program (QT), folded like a cheap lawn chair, at the first sign of pain, by reverting to Quantitative Easing (QE)—inflation be damned.
The explanation that the BoE just wanted to maintain an orderly market was quickly rebuffed by analyst Peter Schiff:
Well, you can’t fight inflation and maintain an orderly market because the markets have been propped up by inflation. So, if you’re going to fight inflation, you’d better be prepared for a disorderly market. And until yesterday, the Bank of England was bluffing that they were. But now that their bluff has been called, they had to show their cards, and they’re holding nothing. And so, inflation won.
Peter added that, when the day of reckoning comes, he expects Fed head Powell to make the same decision:
I don’t care how much he wants to bark about being tough on inflation. At the end of the day, he will not bite. The Fed is a paper tiger, and it will fold just as quickly as the Bank of England when they’re confronted with an actual crisis.
And that’s what traders and algos were seeing as well, hence the sharp rally into October. Of course, at this time, it’s all guesswork and hope that Powell will follow suit, but what if he doesn’t?
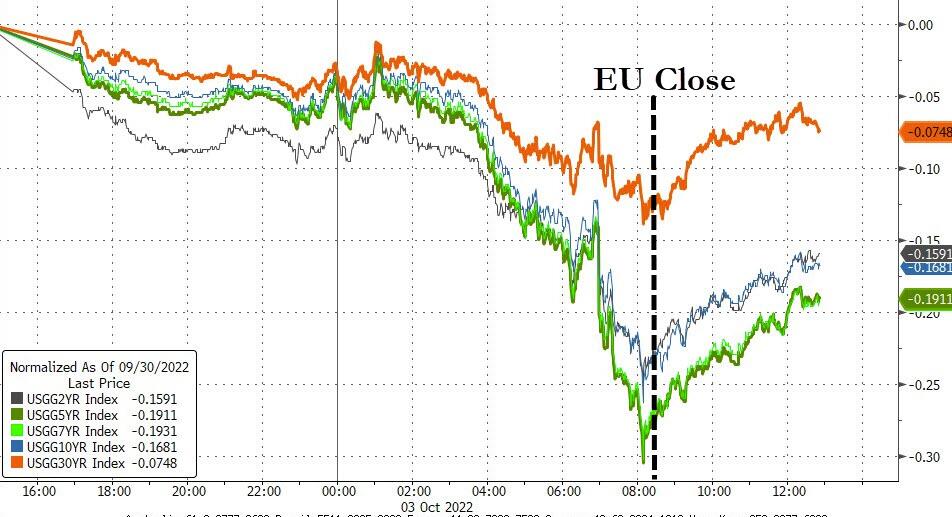
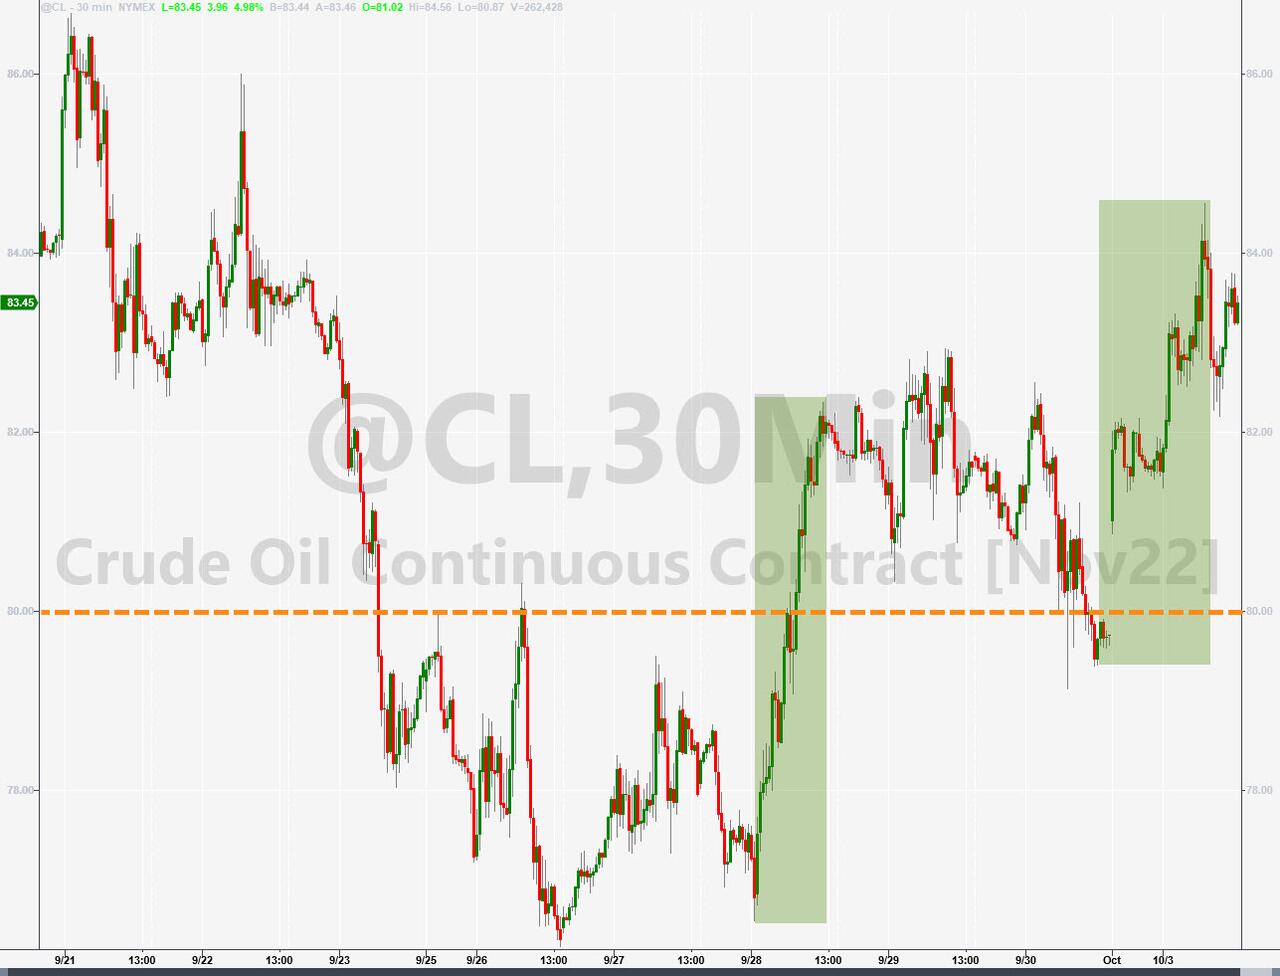
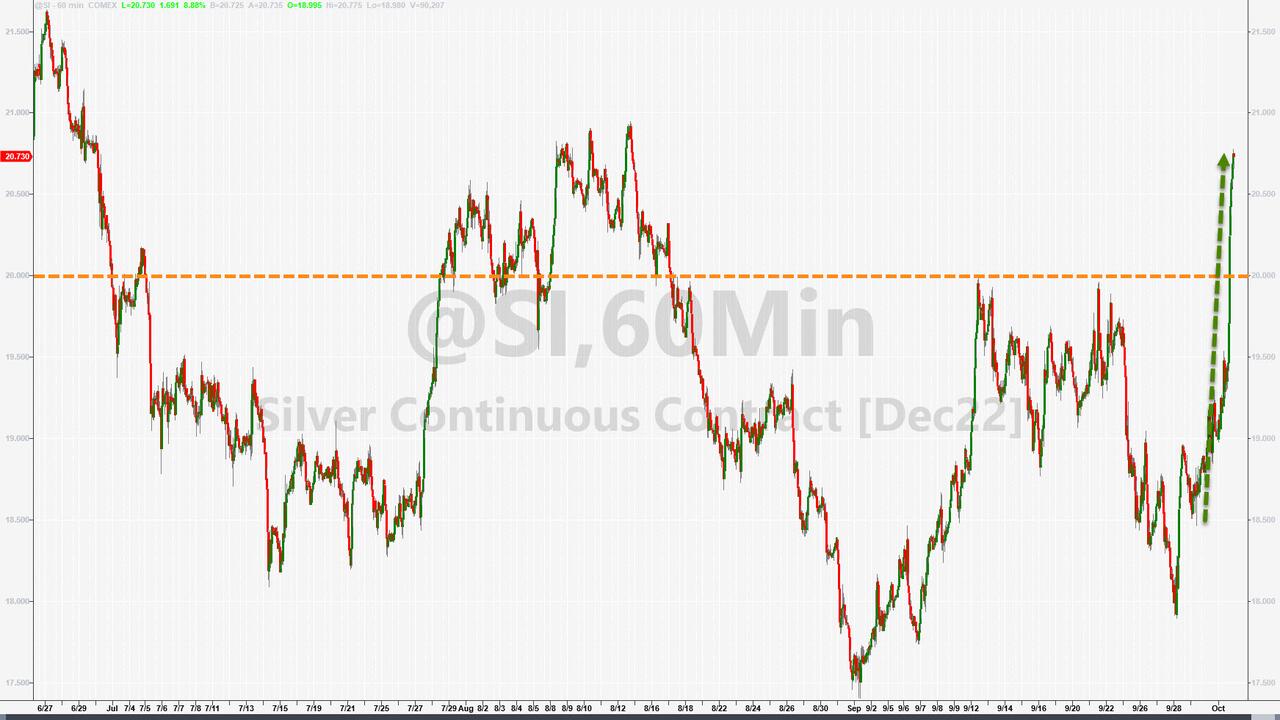
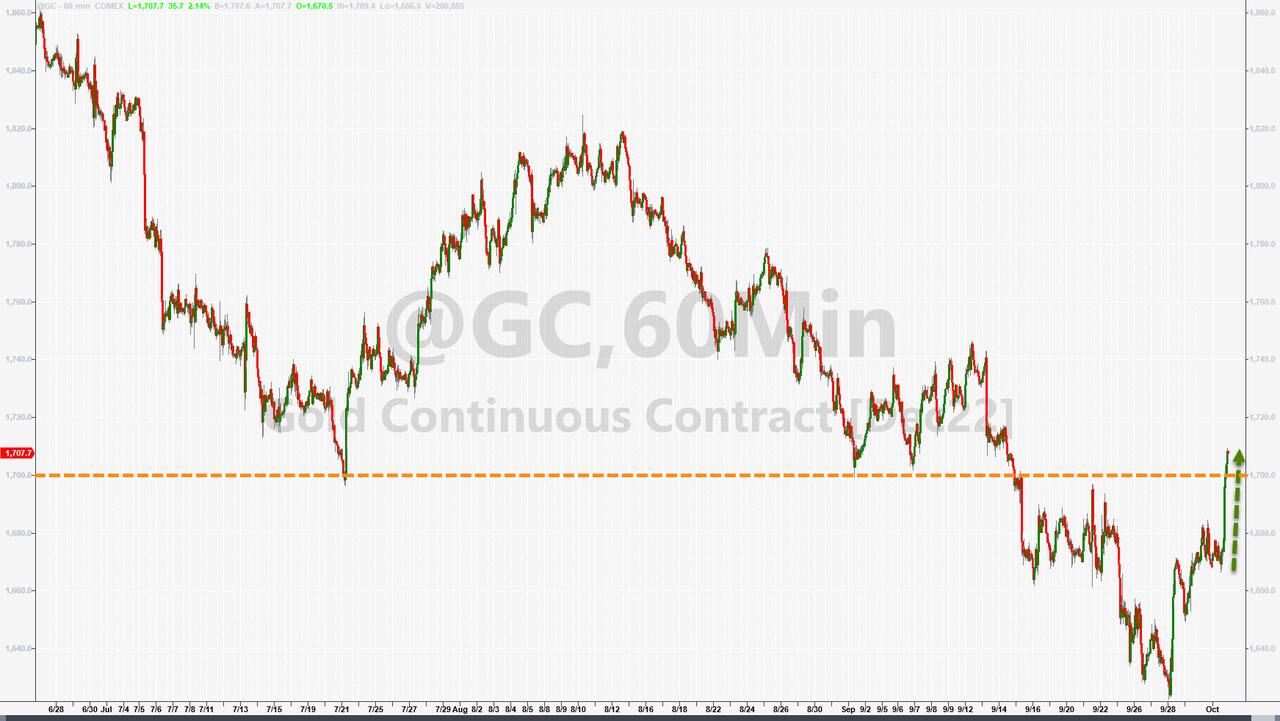
Nevertheless, we saw stocks, bonds, crude oil, and precious metals surging, as the US Dollar and bond yields hit the skids. Silver soared about 9% today, while gold had great showing by gaining over 2% and reclaiming its $1,700 level again.
Will Powell pivot? As per ZeroHedge, FedSpeak by some his Fed Gov’s don’t seem to confirm that:
Tighter monetary policy has begun to cool demand and reduce inflationary pressures, but our job is not yet done.
What if we are in a new era — one in which we face inflationary headwinds?
History may be less of a precedent for appropriate policy.
As a result, our efforts to stabilize inflation expectations could require periods where we tighten monetary policy more than has been our recent pattern.
You might think of this as leaning against the wind.
Only time will tell if the Fed is bluffing.
2. ETFs in the Spotlight
In case you missed the announcement and description of this section, you can read it here again.
It features some of the 10 broadly diversified domestic and sector ETFs from my HighVolume list as posted every Saturday. Furthermore, they are screened for the lowest MaxDD% number meaning they have been showing better resistance to temporary sell offs than all others over the past year.
The below table simply demonstrates the magnitude with which these ETFs are fluctuating above or below their respective individual trend lines (%+/-M/A). A break below, represented by a negative number, shows weakness, while a break above, represented by a positive percentage, shows strength.
For hundreds of ETF choices, be sure to reference Thursday’s StatSheet.
For this closed-out domestic “Buy” cycle (2/24/2022), here’s how some of our candidates have fared. Keep in mind that our Domestic Trend Tracking Index (TTI) signaled a “Sell” on that date, which overrode the existing “Buys” shown for SPY and IYM:
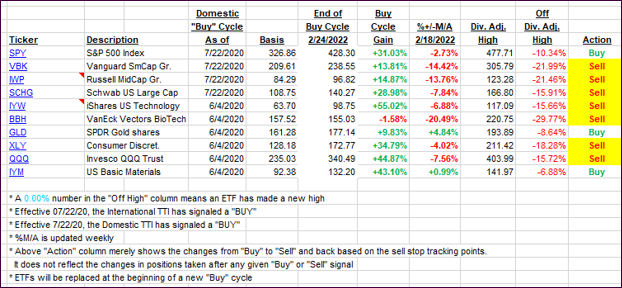
Click image to enlarge.
Again, the %+/-M/A column above shows the position of the various ETFs in relation to their respective long-term trend lines, while the trailing sell stops are being tracked in the “Off High” column. The “Action” column will signal a “Sell” once the -12% point has been taken out in the “Off High” column, which has replaced the prior -8% to -10% limits.
3. Trend Tracking Indexes (TTIs)
Our TTIs improved but remain on the bearish side of their respective trend lines.
This is how we closed 10/03/2022:
Domestic TTI: -10.43% below its M/A (prior close -12.86%)—Sell signal effective 02/24/2022.
International TTI: -15.19% below its M/A (prior close -16.76%)—Sell signal effective 03/08/2022.
Disclosure: I am obliged to inform you that I, as well as my advisory clients, own some of the ETFs listed in the above table. Furthermore, they do not represent a specific investment recommendation for you, they merely show which ETFs from the universe I track are falling within the specified guidelines.
All linked charts above are courtesy of Bloomberg via ZeroHedge.
Contact Ulli