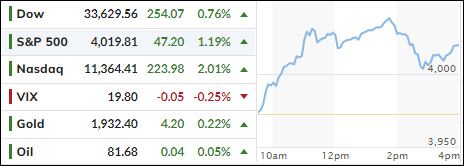
Diving Ahead Of A High Impact Week

Ulli Market Commentary Contact

[Chart courtesy of MarketWatch.com]

  1. Moving the markets

Anxiety reigned supreme ahead of the Fed’s decision on interest rates, with the markets having priced in a meager 0.25% hike. That is despite the countless announcements by a host of speakers that “higher rates for longer” are the current policy theme, yet traders have battled the Fed every step of the way.

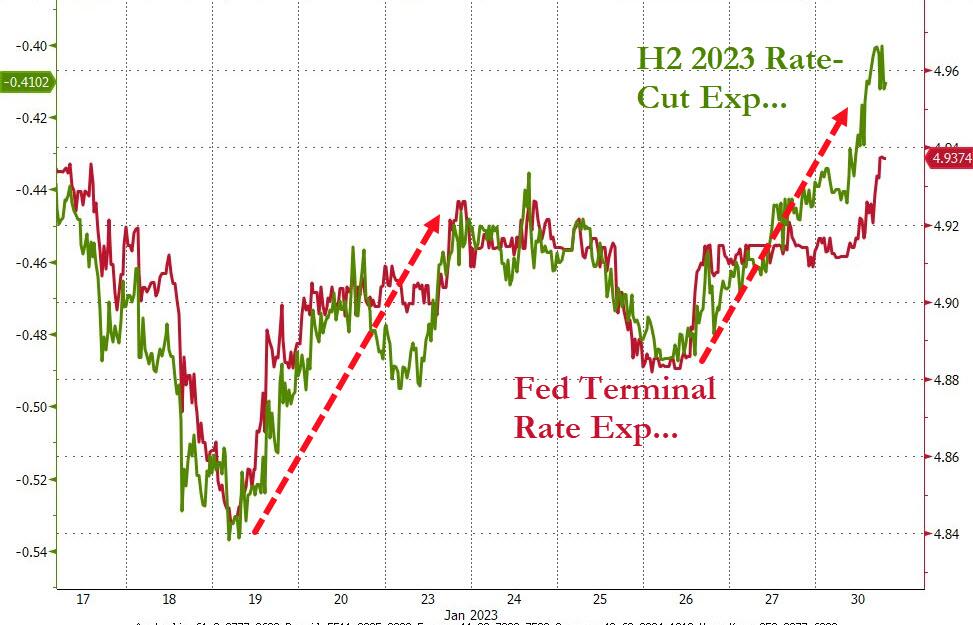
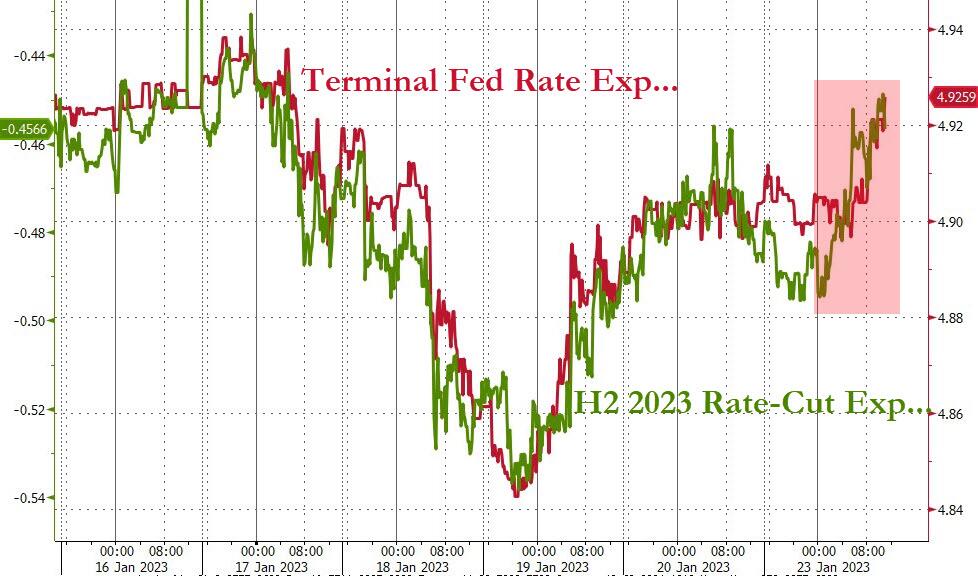
It’s likely that the Fed eventually will reverse its tightening schedule, but it’s questionable whether that point in time has been reached already. Wednesday’s release of their decision will shed some light on where they are at with their policies. Will the hawkishness continue? The H2 2023 Rate Cut Expectations seem to indicate so.

Adding to the nervousness in the markets will be the continued earnings barrage with some 20% of the S&P members releasing their report cards this week, including some of the tech giants like Apple, Amazon, Meta, and Alphabet.

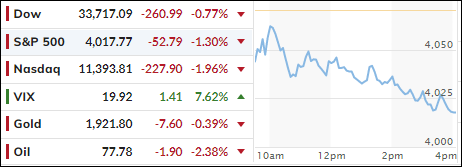
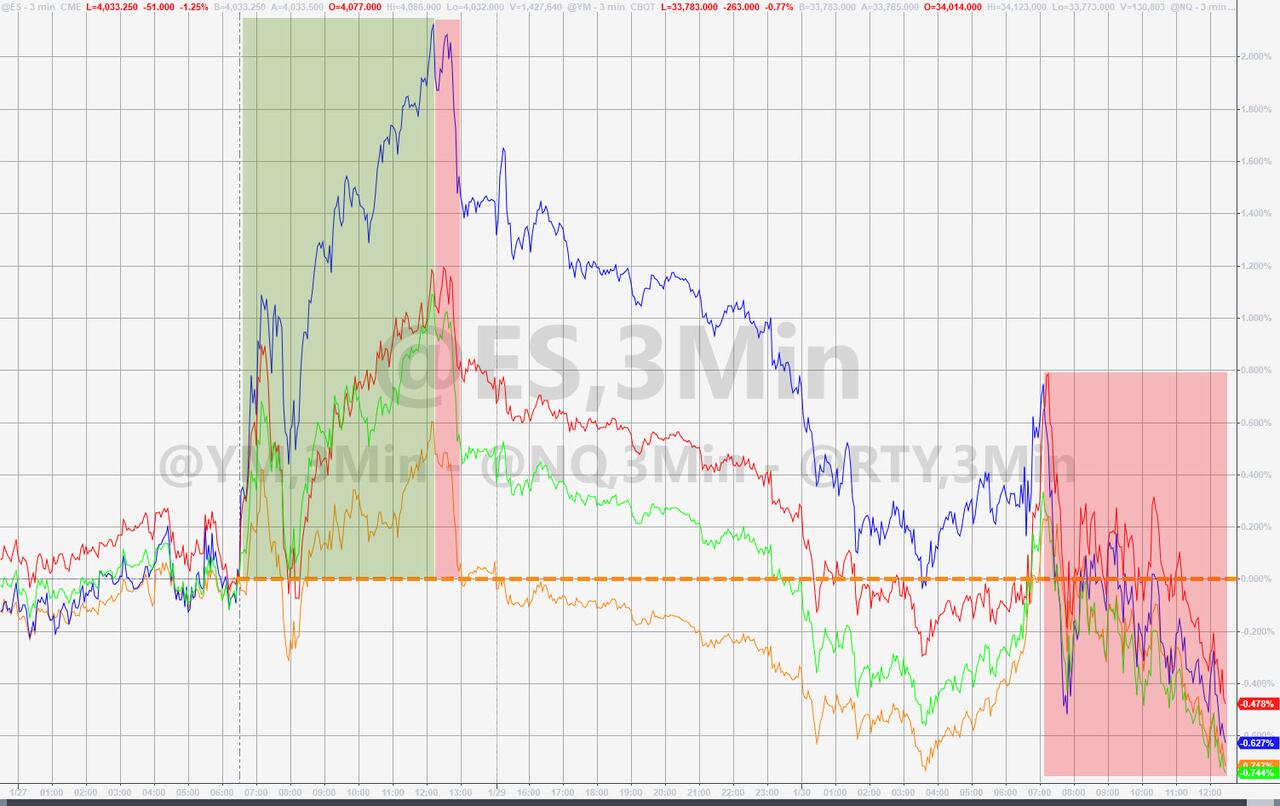
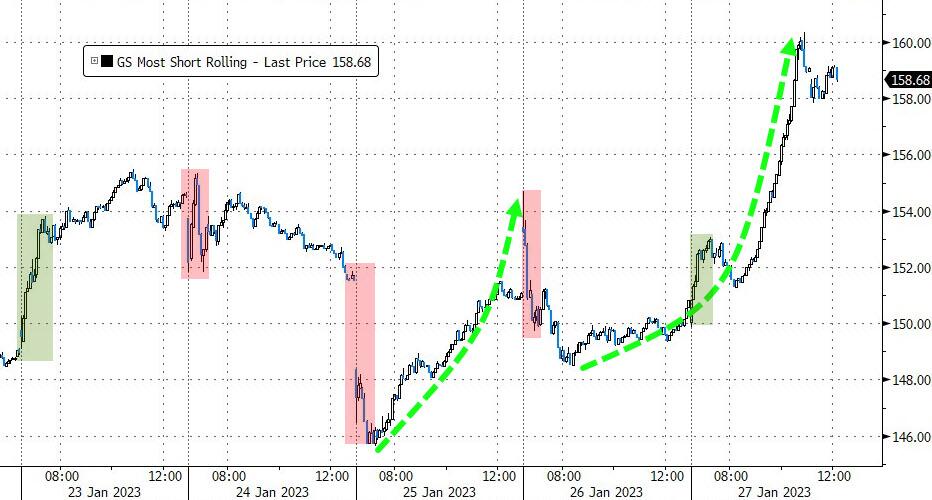
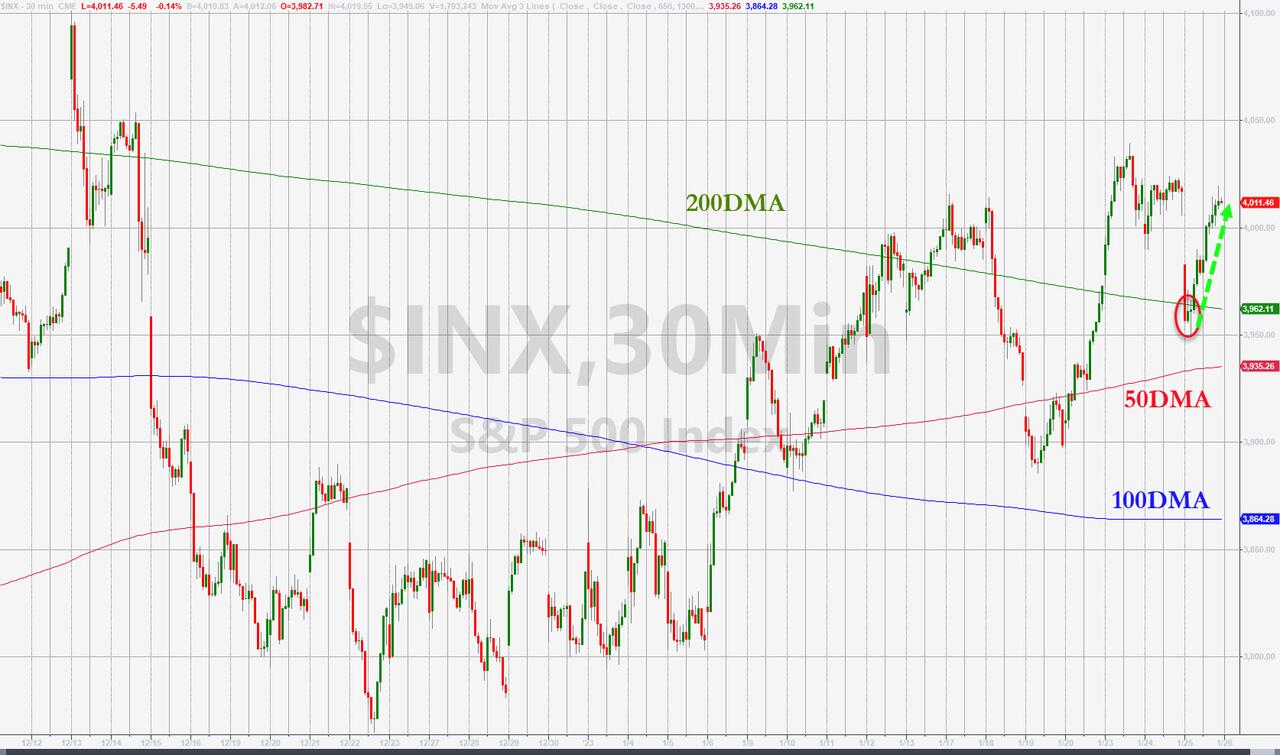
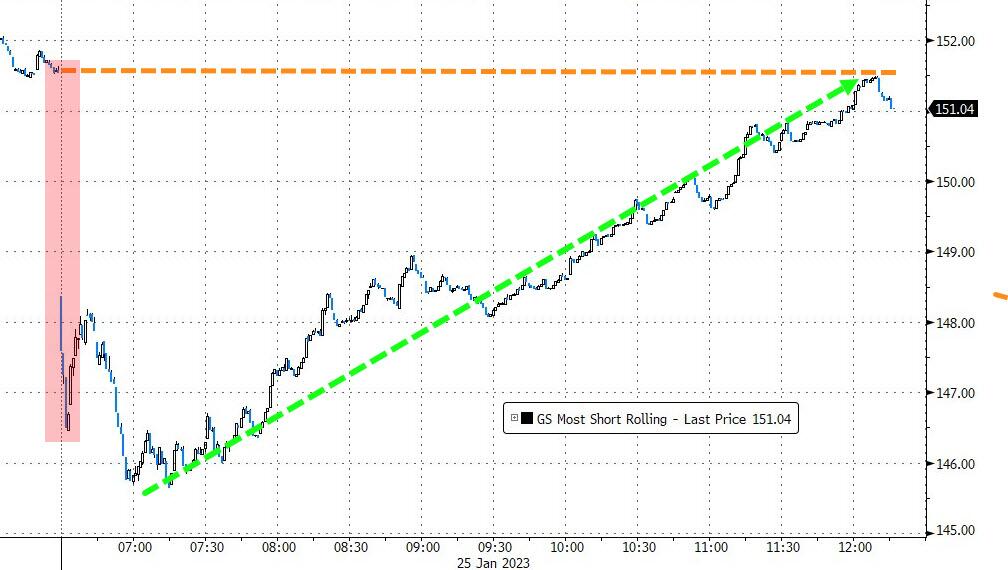
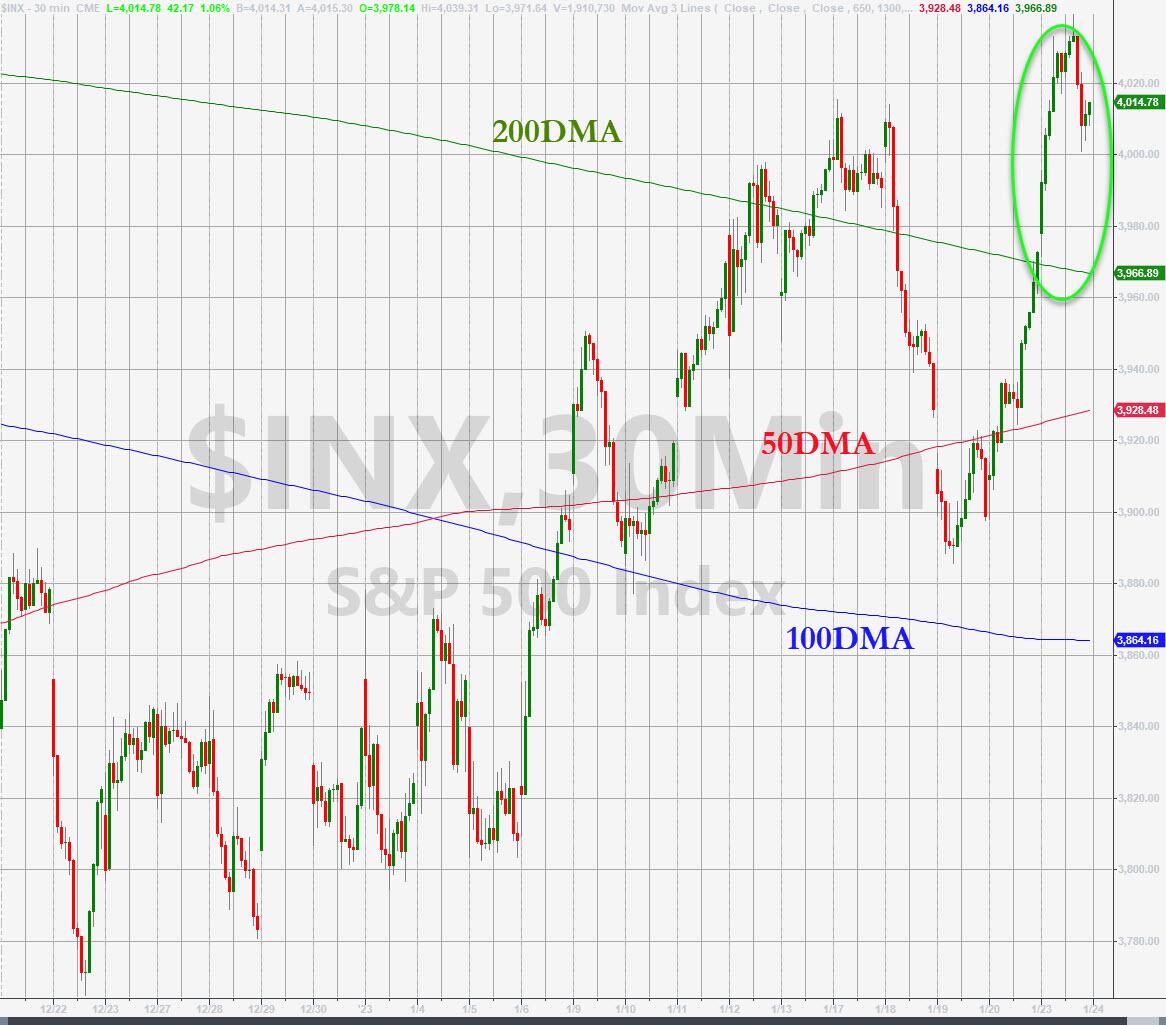
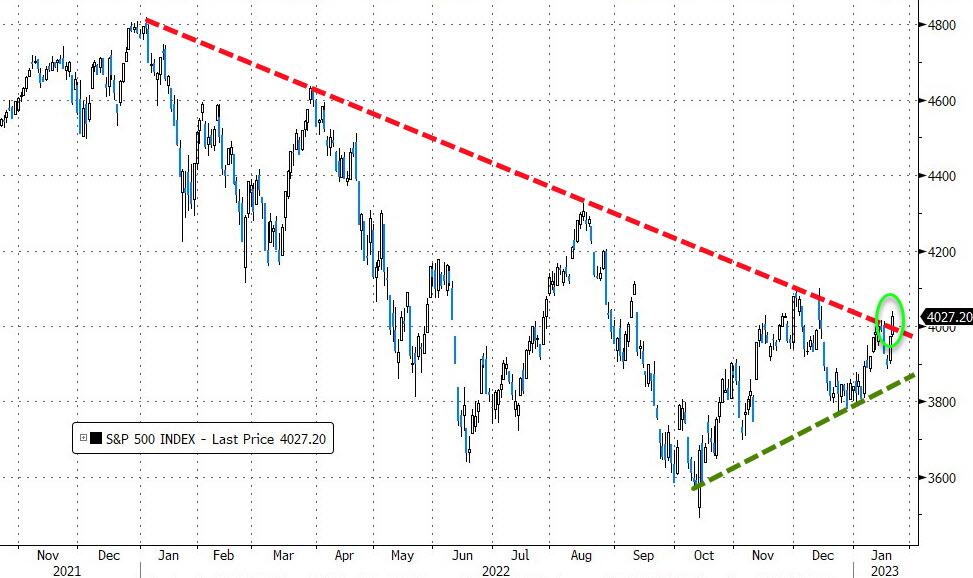
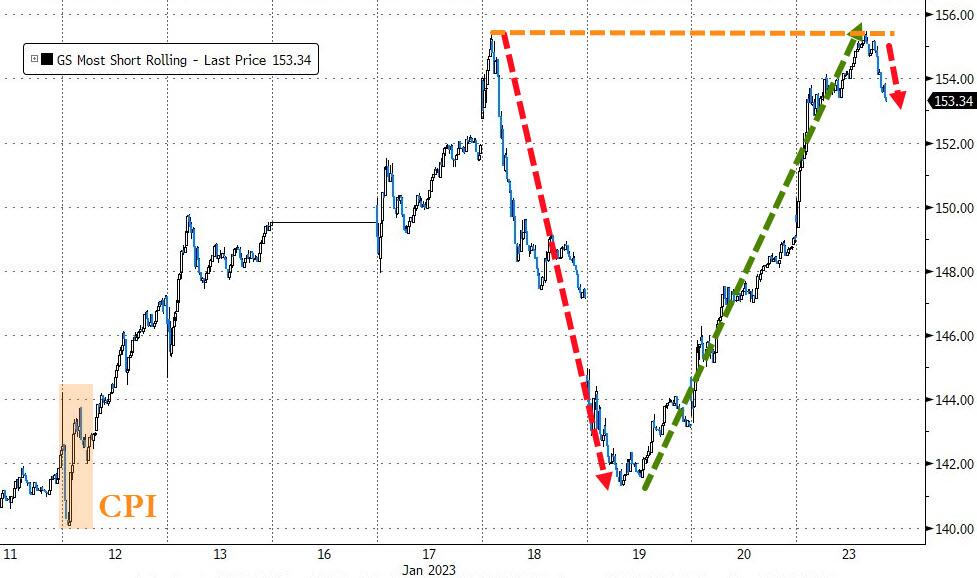
At session’s end, today’s reality check erased all of Friday’s gains and then some, as the short squeeze ran out of ammo again.

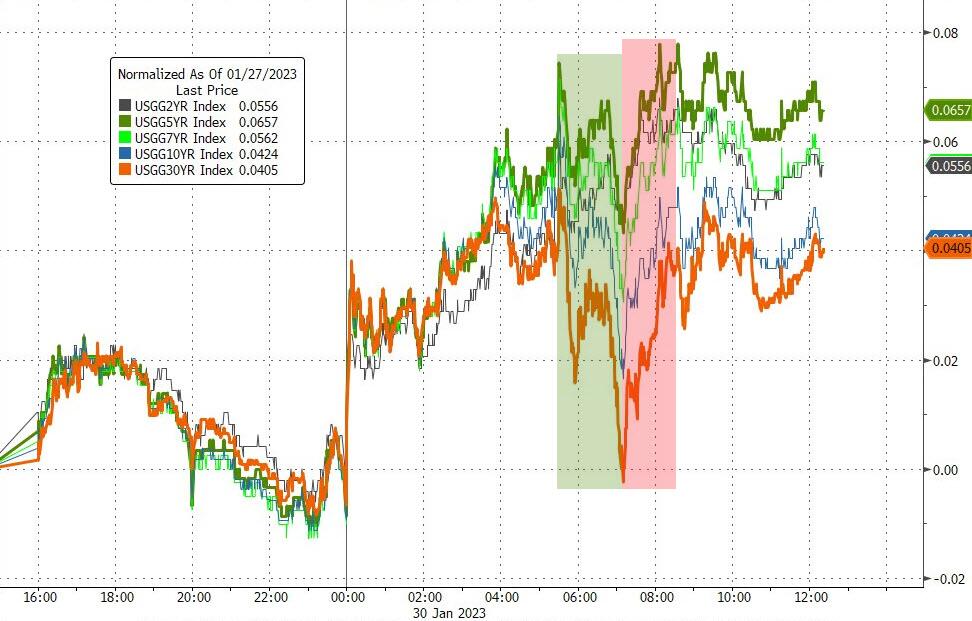
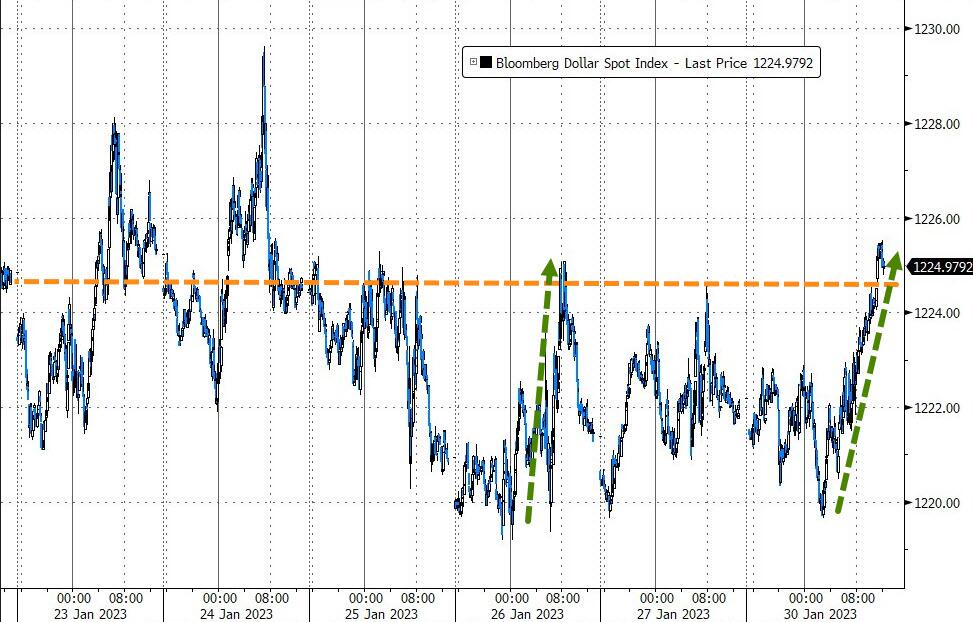
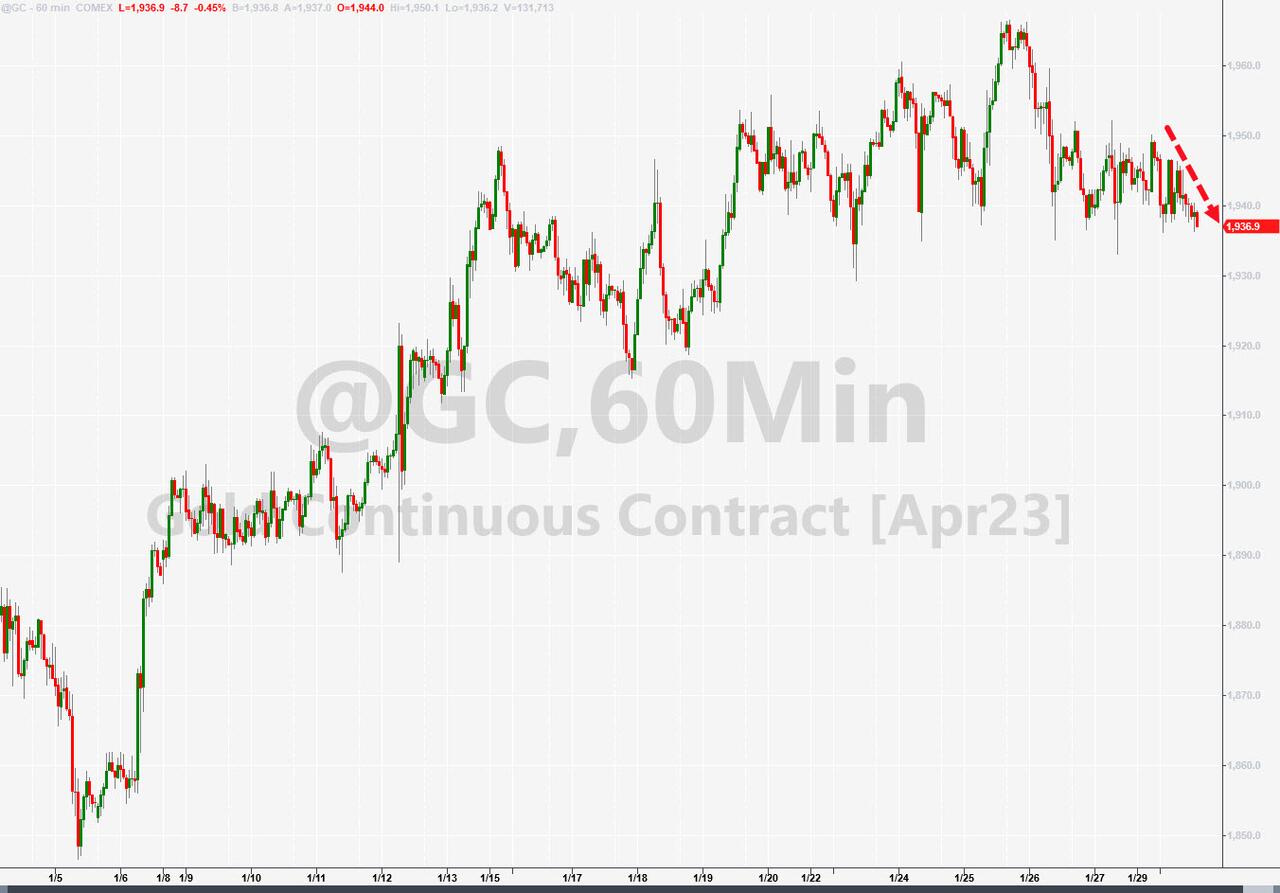
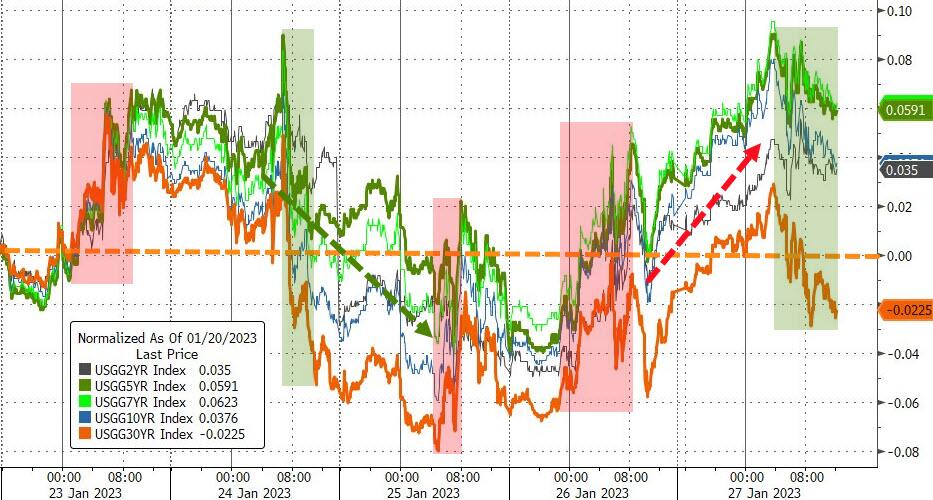
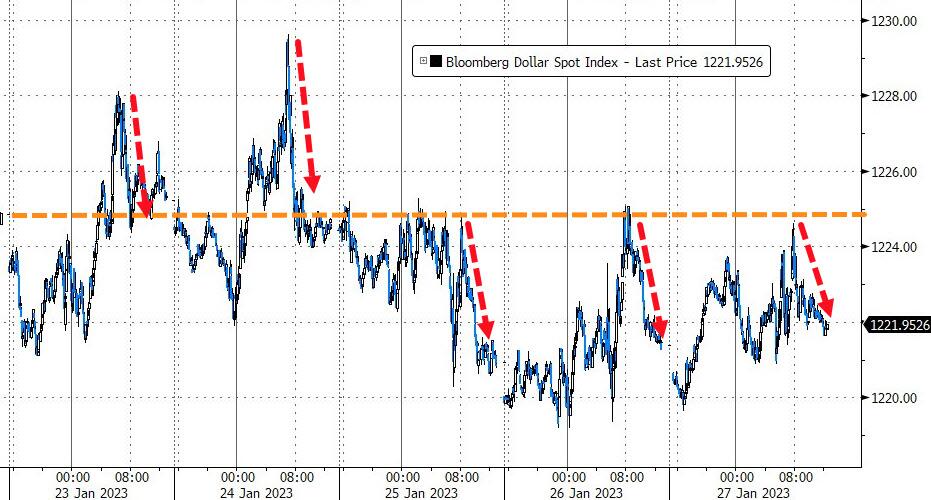
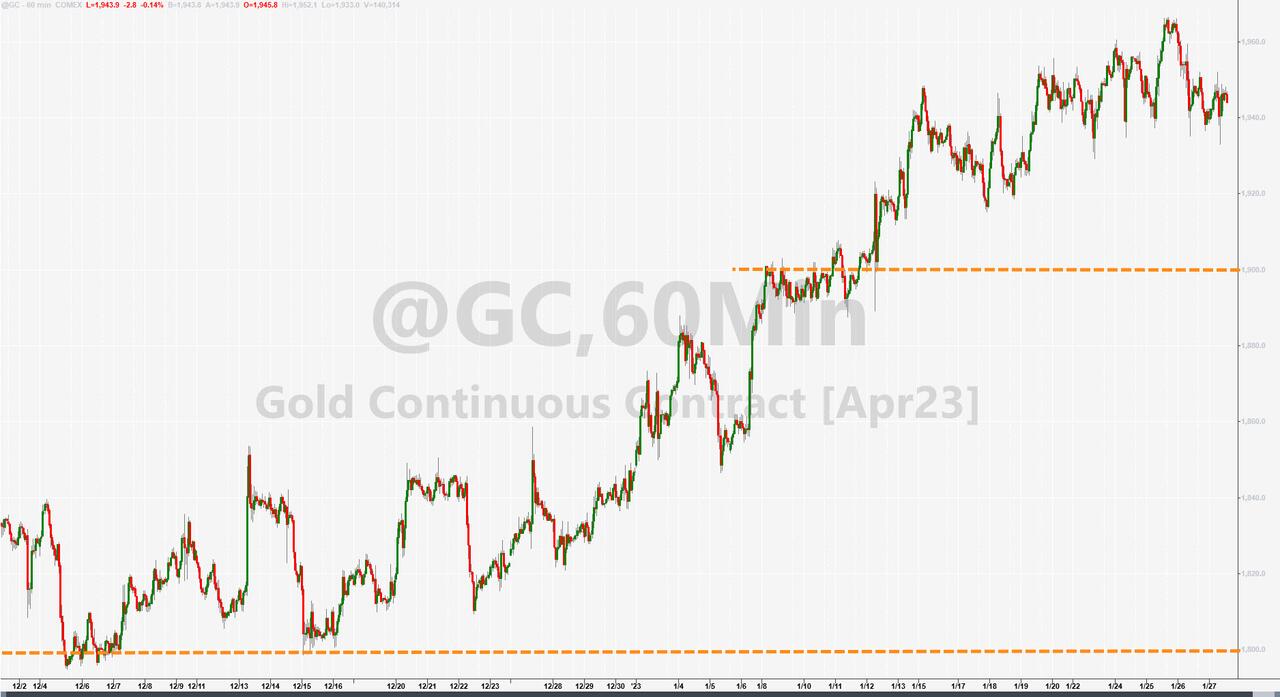
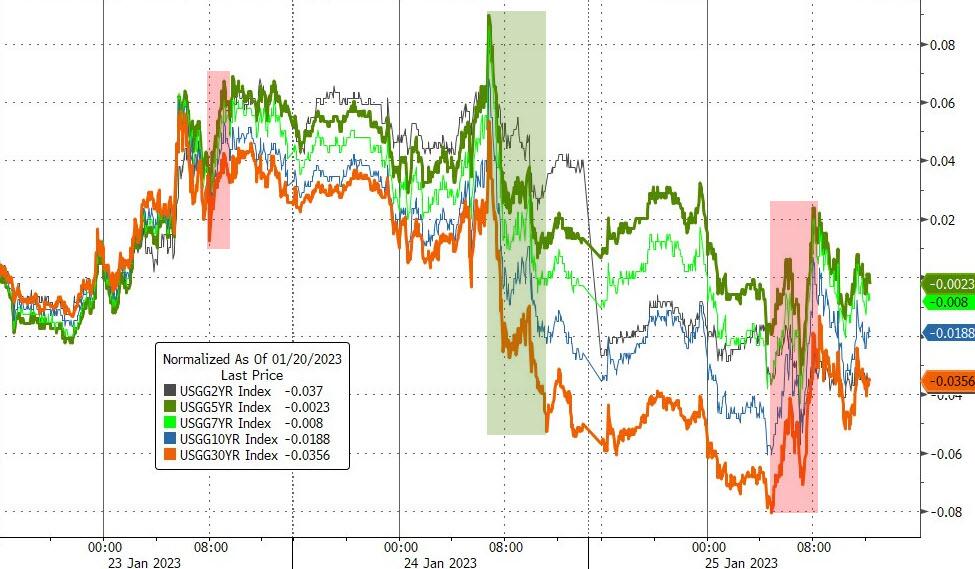
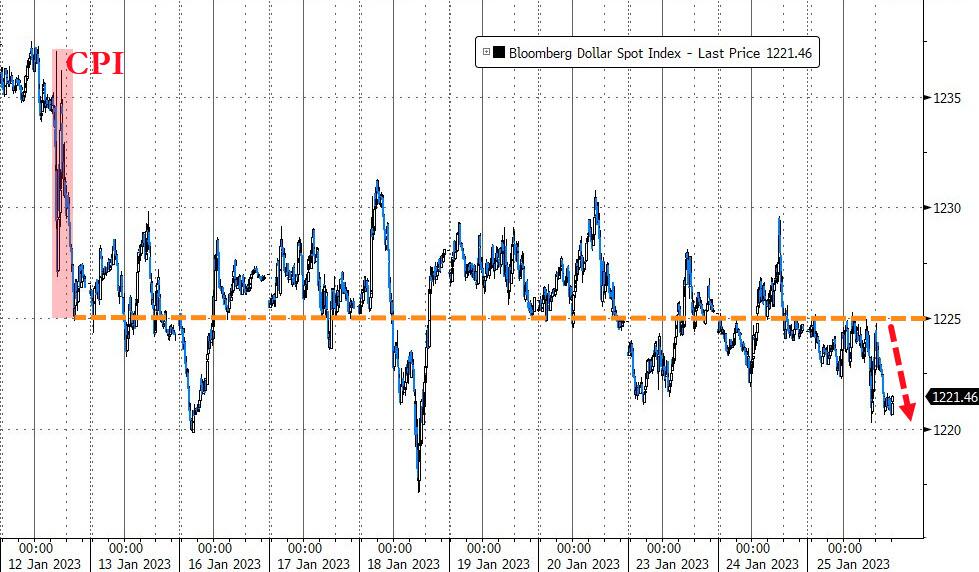
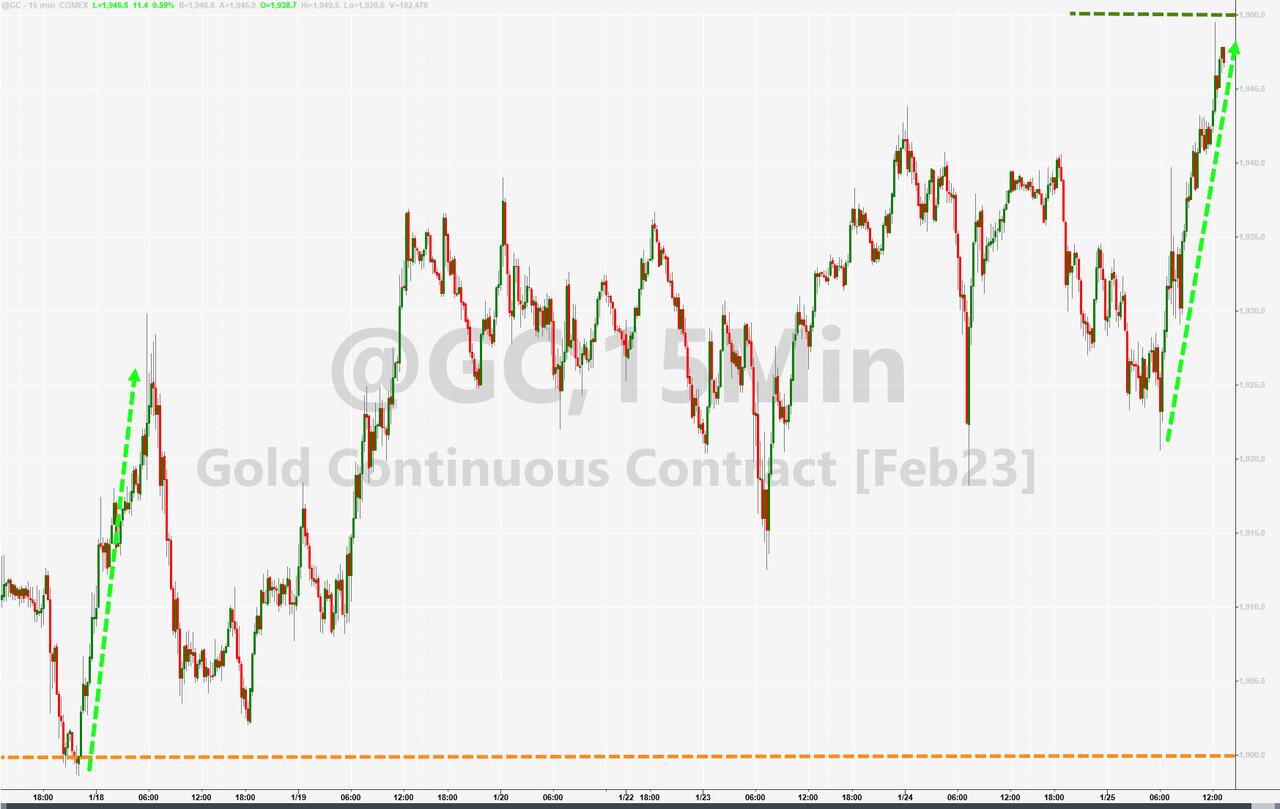
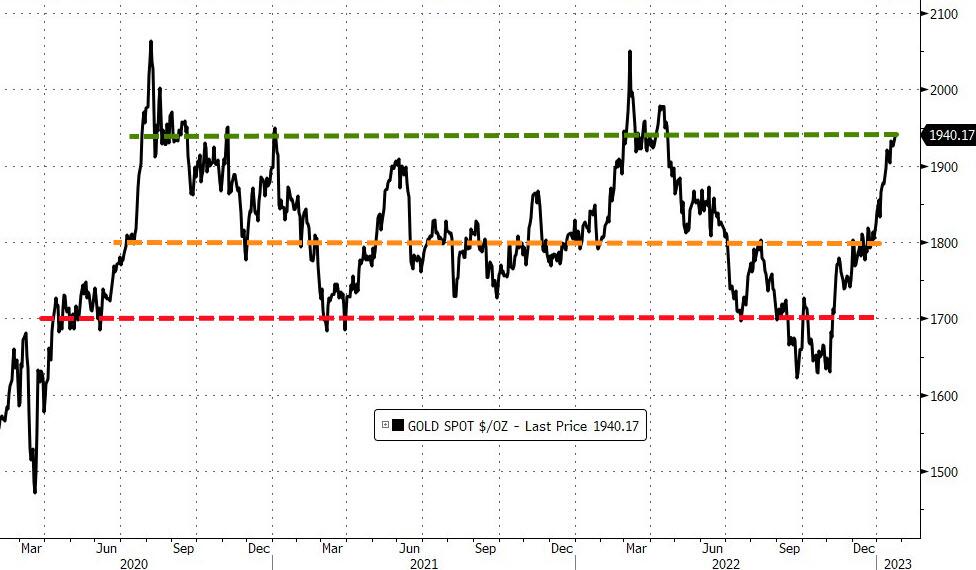
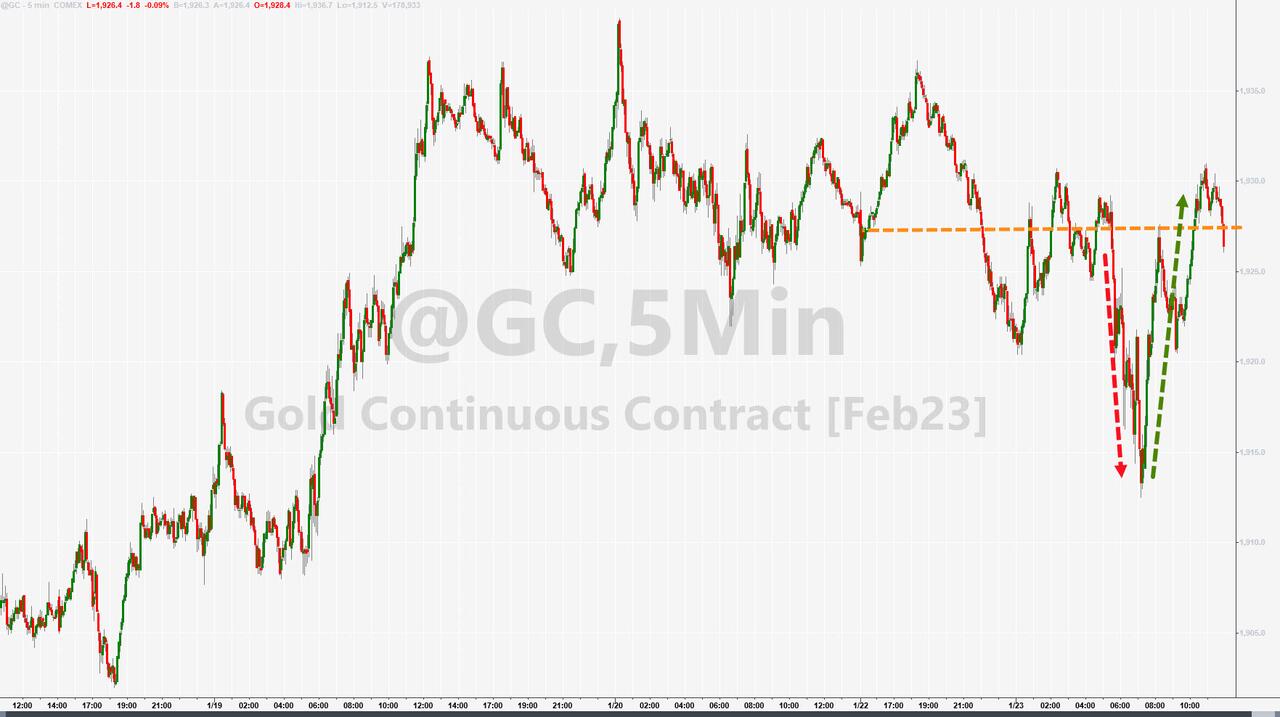
Bond yields rose due to uncertainty about the Fed’s policy decision, the US Dollar dipped and ripped, which caused Gold to drift modestly lower yet remain firmly anchored above its $1,900 level.

We might see more of the same tomorrow.

Read More

ETFs On The Cutline – Updated Through 01/27/2023

Ulli ETFs on the Cutline Contact

Below, please find the latest High-Volume ETF Cutline report, which shows how far above or below their respective long-term trend lines (39-week SMA) my currently tracked ETFs are positioned.

This report covers the HV ETF Master List from Thursday’s StatSheet and includes 312 High Volume ETFs, defined as those with an average daily volume of more than $5 million, of which currently 255 (last report: 234) are hovering in bullish territory. The yellow line separates those ETFs that are positioned above their trend line (%M/A) from those that have dropped below it.

Take a look:                                                                   

The HV ETF Master Cutline Report

In case you are not familiar with some of the terminology used in the reports, please read the Glossary of Terms. If you missed the original post about the Cutline approach, you can read it here.      

ETF Tracker Newsletter For January 27, 2023

Ulli ETF Tracker Contact

ETF Tracker StatSheet          

You can view the latest version here.

STRONG EARNINGS KEEP THE RALLY ALIVE

[Chart courtesy of MarketWatch.com]
  1. Moving the markets

Yesterday’s Q4 GDP report, which showed a rise of 2.9%, better than the consensus 2.6%, yet a cooldown from Q3’s 3.2%, was interpreted as bullish, and the major indexes continued to ramp higher totally ignoring that such strength will encourage the Fed to keep up its rate hiking policies for longer.

Nothing seemed to disturb that upward momentum, not even New Home Sales, which suffered their biggest annual drop since October 2021, as a revision from the November data set converted a massive surge of 5.8% into meager 0.7%. Not helping matters was the fact that cancellations are running at a higher rate than the peak of the 2008 financial crisis.

The latest batch of corporate earnings came in above expectations and kept traders focused on a potentially soft landing, with hope reigning supreme that a mild recession will not throw us into a deeper bear market. Will see about that.

Tesla stock, after having been spanked over the past year, kept its 6-day winning streak alive, and jumped some 11% after announcing record revenue and solid earnings. Beaten up technology firms like Microsoft, Nvidia, Amazon and Alphabet bounced back as well.

Also helping the bullish meme was a sudden upside move by the Surprise US Macro index, which combined forces with today’s short squeeze (+7%), the biggest one since November 10th, thereby giving the bears no chance for a comeback.   

Bond yields moved moderately higher, the US Dollar slipped, as Gold notched its 6th straight week of gains.

In the end, the markets gained on traders continued stubborn belief that there will be no “hard landing” and frontrunning the Fed’s potential for a “pivot” simply represents profits chiseled in stone, while their “higher for longer” jawboning will not come to pass.

If traders got this wrong, there will be a very rude awakening.  

Read More

Weekly StatSheet For The ETF Tracker Newsletter – Updated Through 01/26/2023

Ulli ETF StatSheet Contact

ETF Data updated through Thursday, January 26, 2023

Methodology/Use of this StatSheet:

1. From the universe of over 1,800 ETFs, I have selected only those with a trading volume of over $5 million per day (HV ETFs), so that liquidity and a small bid/ask spread are assured.

2. Trend Tracking Indexes (TTIs)

Buy or Sell decisions for Domestic and International ETFs (section 1 and 2), are made based on the respective TTI and its position either above or below its long-term M/A (Moving Average). A crossing of the trend line from below accompanied by some staying power above constitutes a “Buy” signal. Conversely, a clear break below the line constitutes a “Sell” signal. Additionally, I use a 12% trailing stop loss on all positions in these categories to control downside risk.

3. All other investment arenas do not have a TTI and should be traded based on the position of the individual ETF relative to its own respective trend line (%M/A). That’s why those signals are referred to as a “Selective Buy.” In other words, if an ETF crosses its own trendline to the upside, a “Buy” signal is generated. Here too, I recommend trailing sell stop of 12%, or less, depending on your risk tolerance.

If you are unfamiliar with some of the terminology, please see Glossary of Terms and new subscriber information in section 9.     

1. DOMESTIC EQUITY ETFs: BUY — since 12/01/2022

Click on chart to enlarge

Our main directional indicator, the Domestic Trend Tracking Index (TTI-green line in the above chart) has reclaimed its long-term trend line (red) by +7.05% and remains in “Buy” mode for the time being.

Read More

Climbing Out Of A Deep Hole

Ulli Market Commentary Contact

[Chart courtesy of MarketWatch.com]
  1. Moving the markets

Yesterday’s non-event session heated up in overnight trading, after Microsoft’s earnings at first spiked their stock price due to better-than-expected cloud service results. This moment of euphoria was short-lived, however, after the CEO presented lackluster guidance that would result in reduced earnings. That was end of the rally, and Microsoft tanked, making this morning’s opening very likely a weak on.

That’s how it turned out, with the Dow sinking some 400 points and the Nasdaq getting clobbered. Optimism suddenly resumed, as dip buyers stepped up to the plate, and a steady climb out of that early hole erased all losses, and we closed just about unchanged.

The S&P 500 lost its grip on the much-fought over 200-day M/A intra-day but, thanks to the dip buyers, it reclaimed that crucial level, as the rebound accelerated. And, as I have commented numerous times, such a rebound is simply not possible without a short-squeeze, which is exactly what transpired today.

Bond yields slipped a tad, the US Dollar retreated, while Gold surged after being down early in the session with the precious metal now homing in on crucial overhead resistance levels. If they get broken, the $2k price point will come into play again—hopefully with longer duration than the last two attempts.  

Read More

Battling The Downtrend Line

Ulli Market Commentary Contact

[Chart courtesy of MarketWatch.com]

  1. Moving the markets

An early Ramp-A-Thon lost some momentum during mid-session, but the pullback was contained and still enabled the major indexes to close solidly in the green.

While the S&P 500 managed to finally break above its 200-day M/A, it was not yet able to hold the move above its longer-term downtrend line, which had been a insurmountable resistance point throughout 2022.

Supporting today’s follow through from Friday was the continuation of the short squeeze, without which there would have not been enough upward momentum. That brings up the question whether this session simply represented the reloading of the shorts, as ZeroHedge described it.

Traders still contemplated a potential slowdown in rate hikes, thereby stubbornly taking the opposite view of what the Fed and its mouthpieces have been jawboning about for months now, namely “higher rates for a longer duration.” Of course, there is always a possibility of only a +0.25% hike when the Fed meets early February.

Earnings will be closely watched this week, as some big names like Microsoft, IBM, Tesla, Visa and Mastercard will be presenting their report cards. As always, future guidance will be at the center of attention for most analysts.

Much overlooked are figures like the Leading Indicator (LEI), which clearly shows that the “soft landing” theme may not work out as had been anticipated. Stocks ramped anyway and even rate-trajectory expectations drifted higher (more hawkish), which makes me wonder how much more firepower is left in the bullish scenario.

The US Dollar dropped and popped, went sideways, and closed just about unchanged. Gold pumped and dumped and managed to eke out a small gain.

Read More