
ETF Tracker StatSheet
You can view the latest version here.
EASY COME, EASY GO
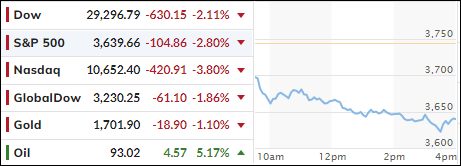
[Chart courtesy of MarketWatch.com]
- Moving the markets
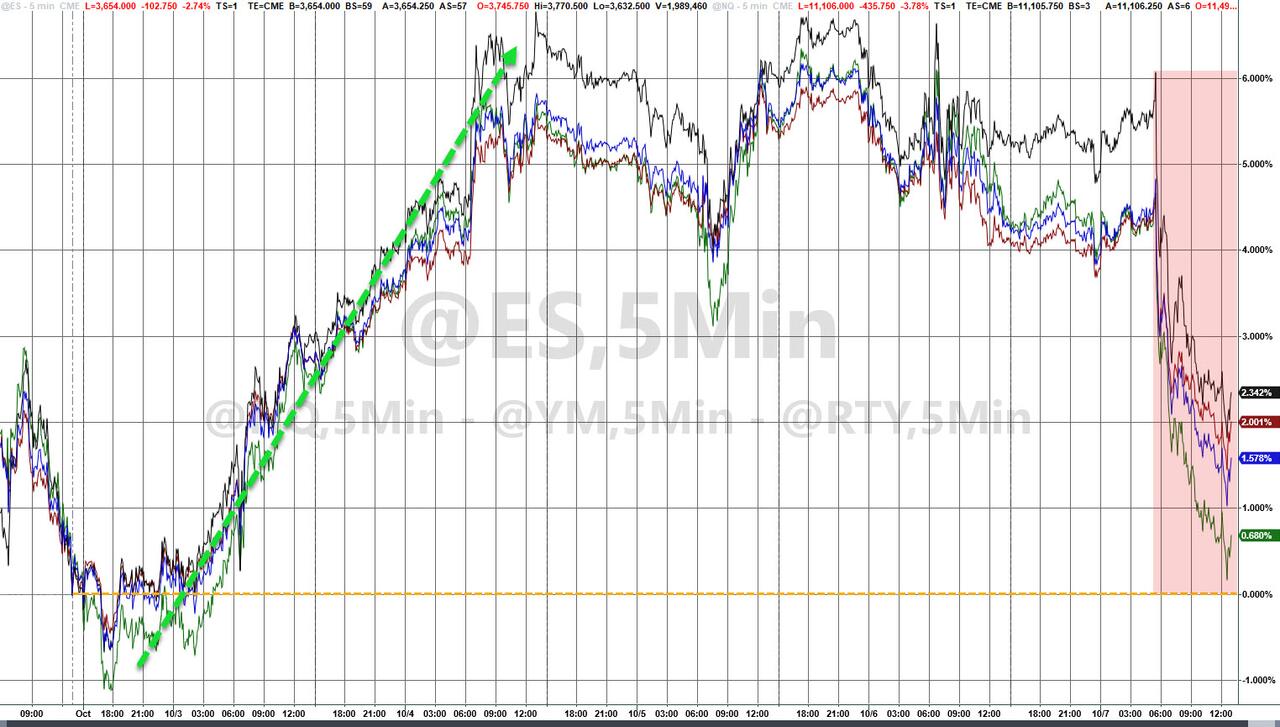
Right now, it sure looks like the bullish feel-good hope moves of Monday and Tuesday were nothing more than another dead cat bounce, with most gains having been surrendered as the bears battled back and took the upper hand.
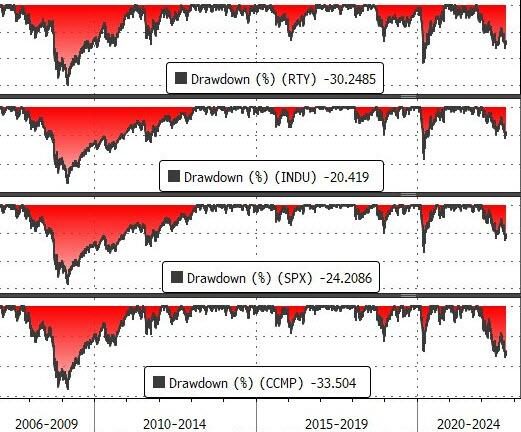
For the week, the S&P 500 managed to eke out a gain of 1.5%, which is a far cry from the almost 6% it had scored by Tuesday night. Looking at the bigger picture, you can see that all the major indexes are still down over 20% from their highs.
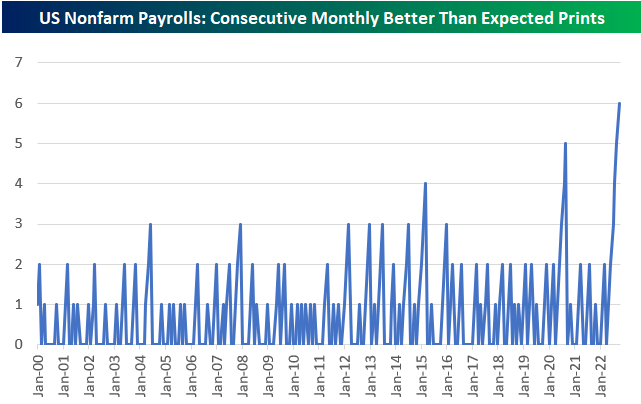
All eyes were on today’s jobs report, which showed that the US economy gained 263k jobs in September, just a bit lower than the estimate of 275k. However, what put a damper on bullish sentiment was the fact that unemployment slipped to 3.5% from the August’s 3.7%.
While that is good news, it was bad news for the market, because it reflects a strengthening jobs picture, despite the Fed’s attempt to slow the economy with continued rate hikes to battle inflation. Combining this drop in unemployment with yesterday’s low level of initial jobless claims, and you have an environment that will motivate the Fed to continue with its hawkish policy of nudging rates higher.
Added ZeroHedge:
Great news America – the unemployment rate has tumbled (with Hispanic unemployment at record lows).
Terrible news America – improving labor market statistics are the opposite of what The Fed is trying to do, and this data today is not going to encourage any pause or pivot anytime soon.
That was not what traders and algos wanted to see, and down we went. Not helping matters was a shockingly bad revenue and margin preannouncement from Advanced Micro Devices (AMD), which made a mockery of its own guidance from August, as ZeroHedge explained.
This disaster was followed by powerhouse FedEx, which offered lower volume forecasts, a surprise that sent its stock down some 4%.
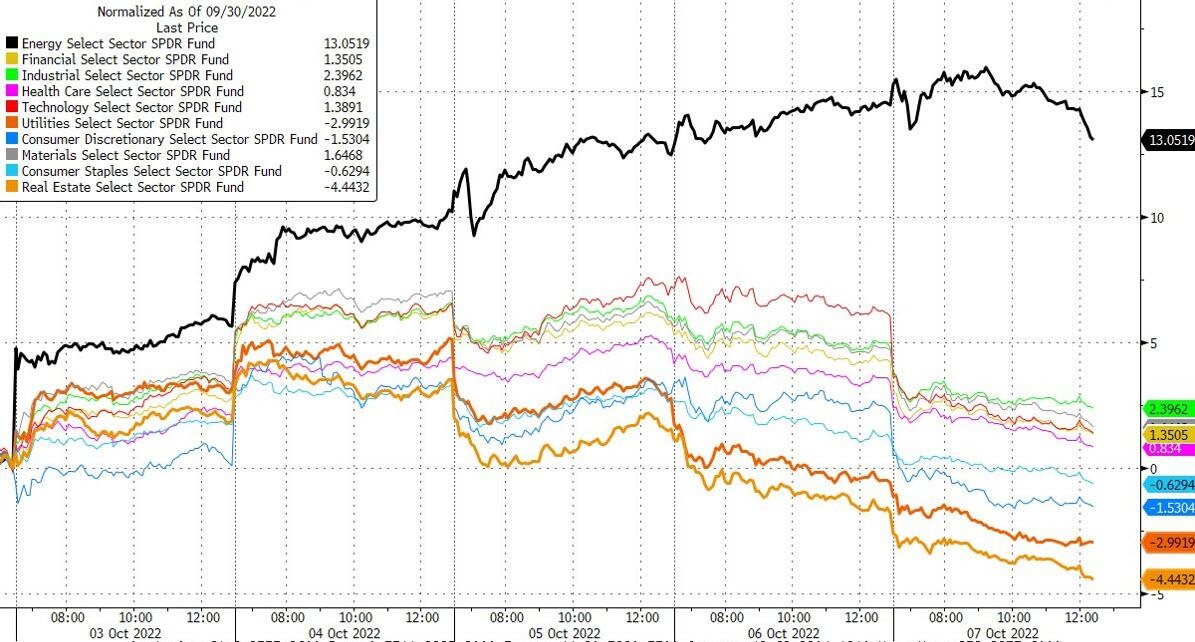
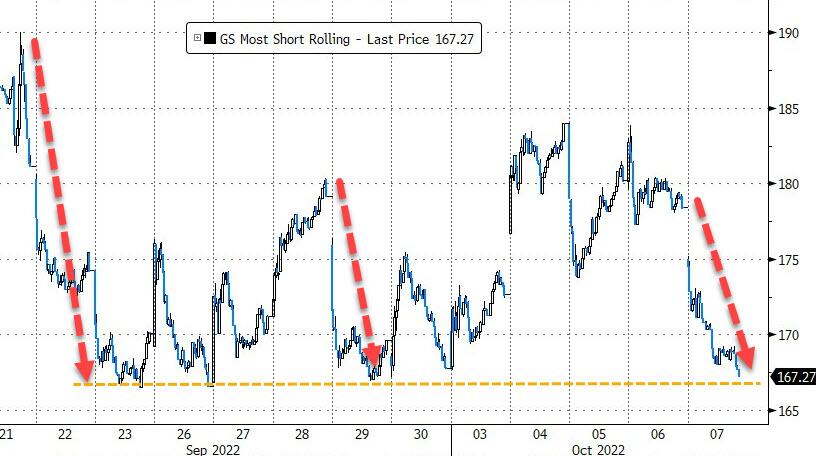
As ZH pointed out, even those traders invested in Defensives ended the week with a loss, which confirms my belief that this is the time to be out of the market and, due to ever increasing uncertainties, eliminate portfolio risk altogether, as even the most shorted stocks did nothing but ride the rollercoaster.
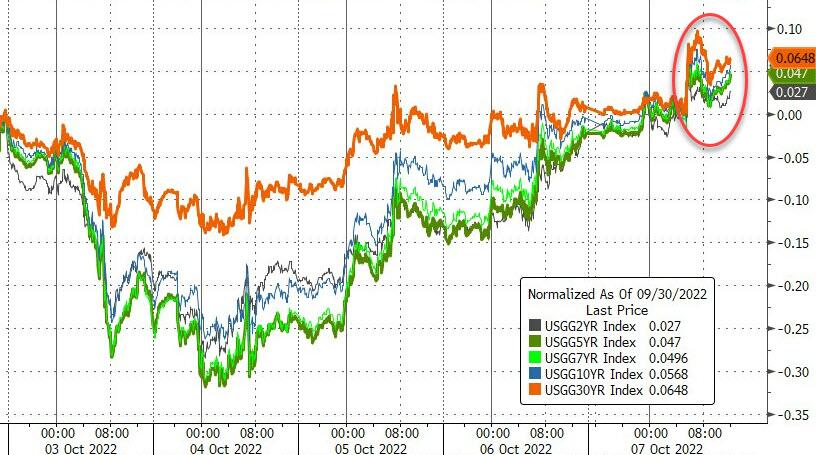
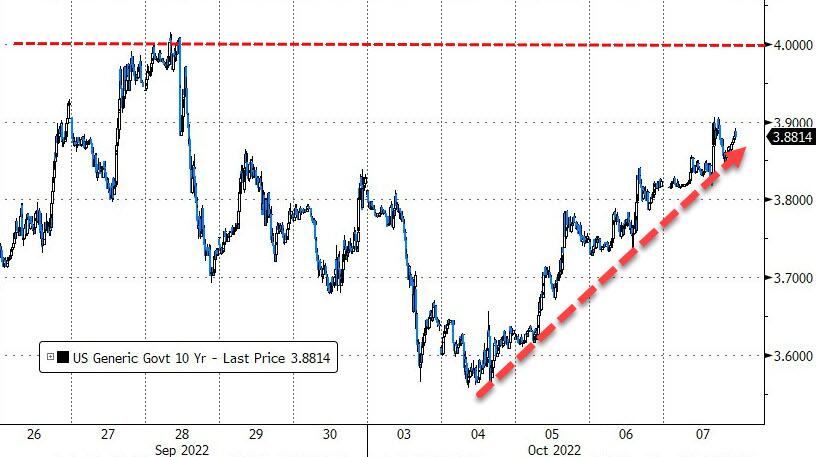
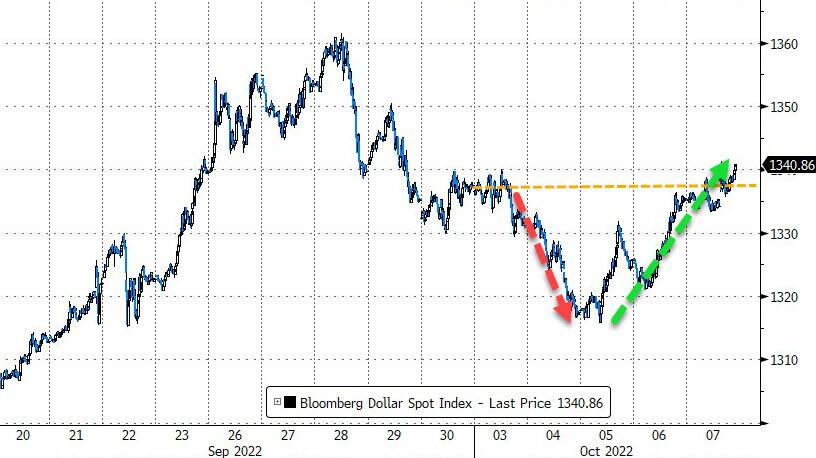
Bond yields ratcheted higher with the 10-year again trying to reclaim its 4% level but so far falling short of it. The US Dollar whipsawed this week and ended about unchanged with Gold following suit and managing to successfully defend its $1,700 level.
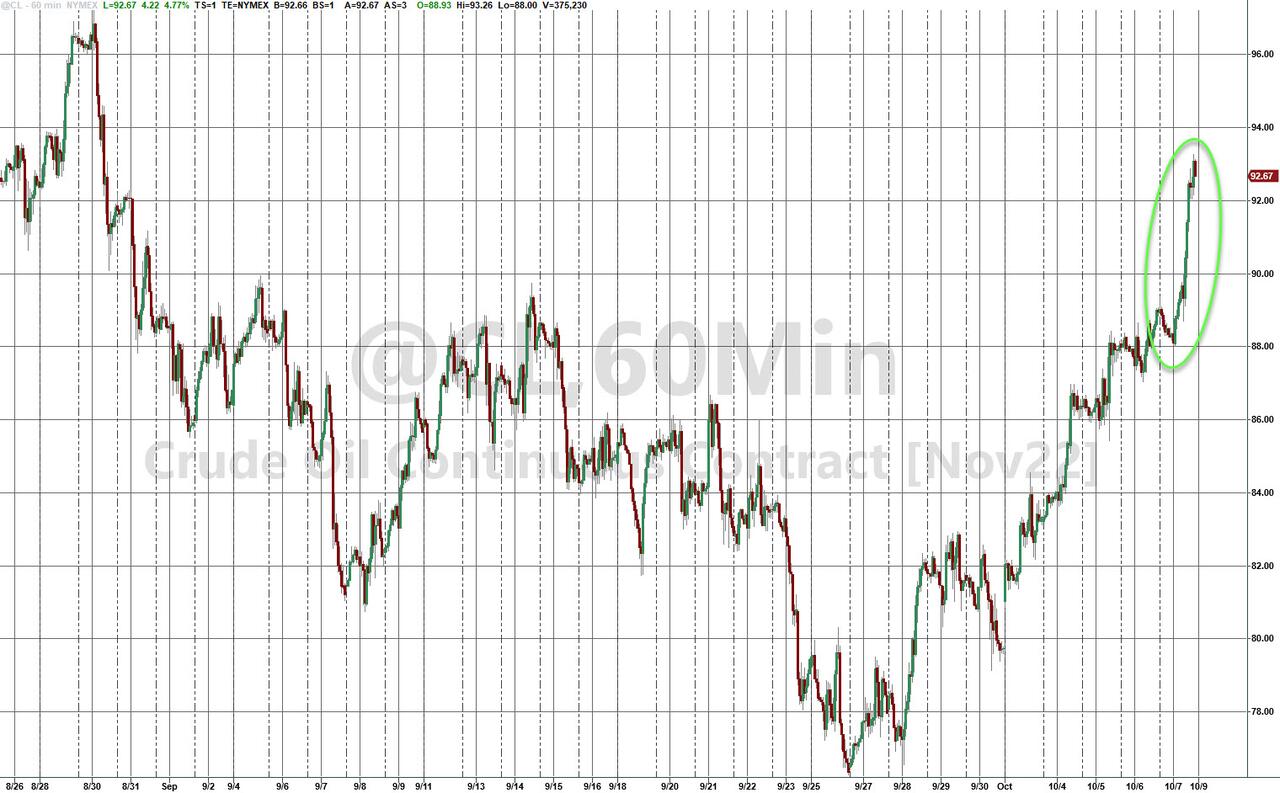
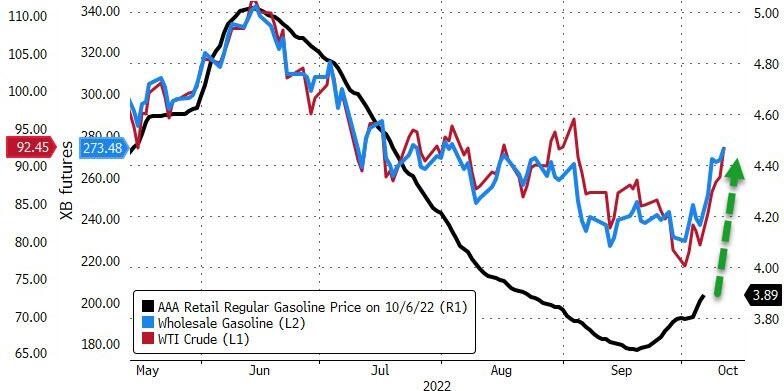
With OPEC+ going their separate ways, and reducing daily output, Crude Oil surged and ended the week around $93 with the magic $100 marker now being in striking distance. That also means, higher prices will be coming at the pump.
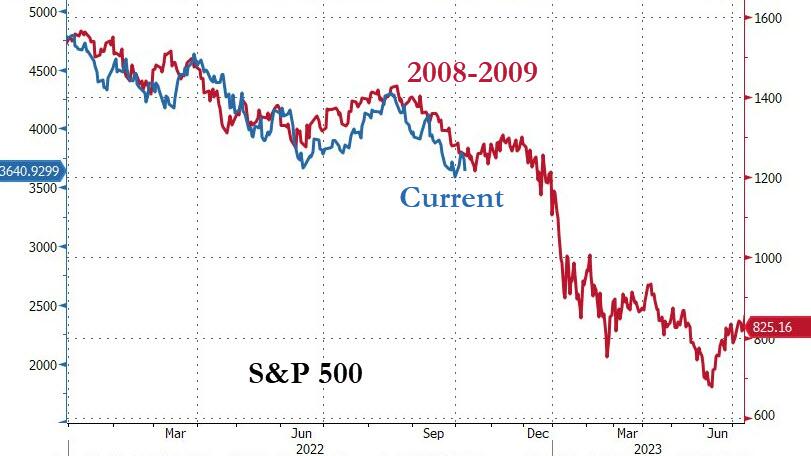
The big picture analog to 2008-2009 shows us that we are on target for a possible historical repeat, but we are only half way there.
Watching this slow motion trainwreck from the sidelines never felt so good.
2. ETFs in the Spotlight
In case you missed the announcement and description of this section, you can read it here again.
It features some of the 10 broadly diversified domestic and sector ETFs from my HighVolume list as posted every Saturday. Furthermore, they are screened for the lowest MaxDD% number meaning they have been showing better resistance to temporary sell offs than all others over the past year.
The below table simply demonstrates the magnitude with which these ETFs are fluctuating above or below their respective individual trend lines (%+/-M/A). A break below, represented by a negative number, shows weakness, while a break above, represented by a positive percentage, shows strength.
For hundreds of ETF choices, be sure to reference Thursday’s StatSheet.
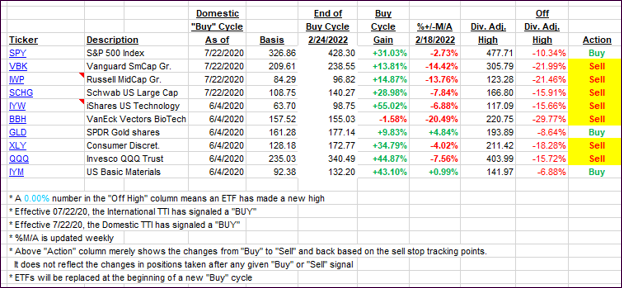
For this closed-out domestic “Buy” cycle (2/24/2022), here’s how some of our candidates have fared. Keep in mind that our Domestic Trend Tracking Index (TTI) signaled a “Sell” on that date, which overrode the existing “Buys” shown for SPY and IYM:
Click image to enlarge.
Again, the %+/-M/A column above shows the position of the various ETFs in relation to their respective long-term trend lines, while the trailing sell stops are being tracked in the “Off High” column. The “Action” column will signal a “Sell” once the -12% point has been taken out in the “Off High” column, which has replaced the prior -8% to -10% limits.
3. Trend Tracking Indexes (TTIs)
Our TTIs dumped again, as the bulls handed the baton to the bears after the Monday/Tuesday rally.
This is how we closed 10/07/2022:
Domestic TTI: -10.43% below its M/A (prior close -8.73%)—Sell signal effective 02/24/2022.
International TTI: -14.54% below its M/A (prior close -13.65%)—Sell signal effective 03/08/2022.
Disclosure: I am obliged to inform you that I, as well as my advisory clients, own some of the ETFs listed in the above table. Furthermore, they do not represent a specific investment recommendation for you, they merely show which ETFs from the universe I track are falling within the specified guidelines.
All linked charts above are courtesy of Bloomberg via ZeroHedge.
———————————————————-
WOULD YOU LIKE TO HAVE YOUR INVESTMENTS PROFESSIONALLY MANAGED?
Do you have the time to follow our investment plans yourself? If you are a busy professional who would like to have his portfolio managed using our methodology, please contact me directly to get more details.
Contact Ulli