
- Moving the markets
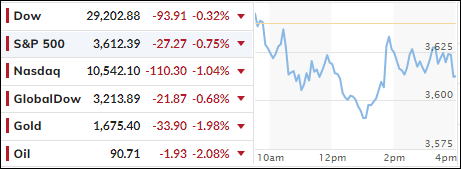
While the major indexes closed off their intra-day lows, they nevertheless scored another loss, as several rally attempts did not hold, and south we went.
As I pointed out last week, the massive rebound, that propelled the Nasdaq some 6.5% higher on Monday and Tuesday turned out to be another head fake with the index surrendering all gains over the next 3 trading days:
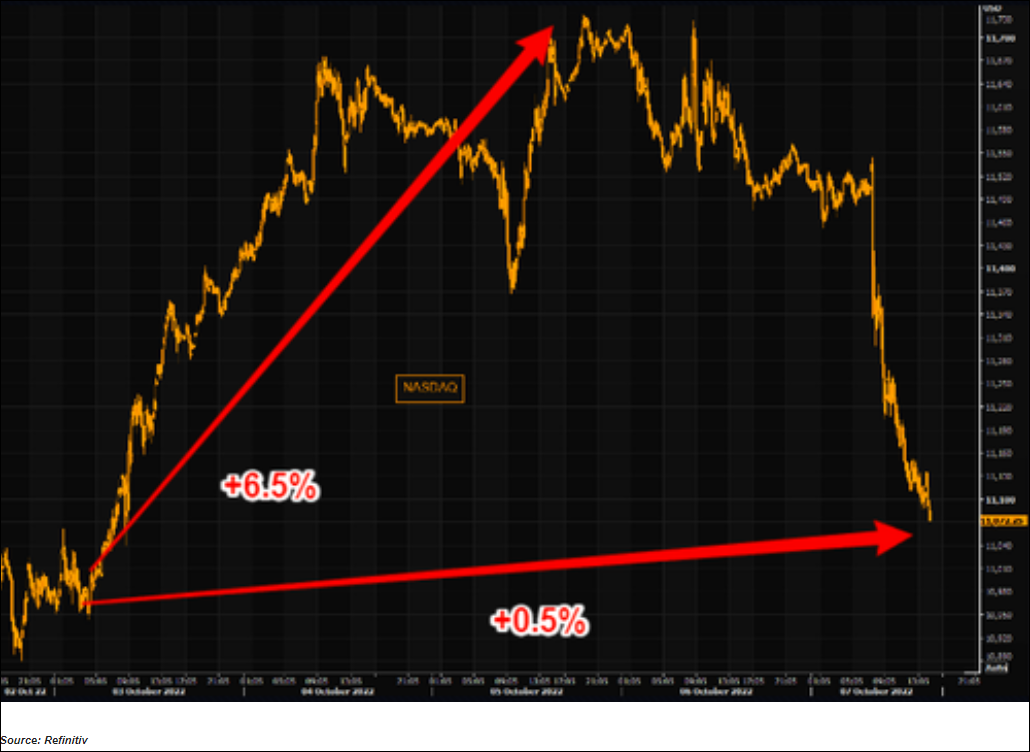
The baseball term “Going, going, gone…” clearly applies here, as bear market bounces can be fast and furious, but they usually tend to fall apart quickly, as we witnessed.
Adding more insult to injury was today’s session, which pushed the index down by another -1.04% to its lowest in over 2 years, as tech shares continue to be hardest hit in this environment of spiking interest rates.
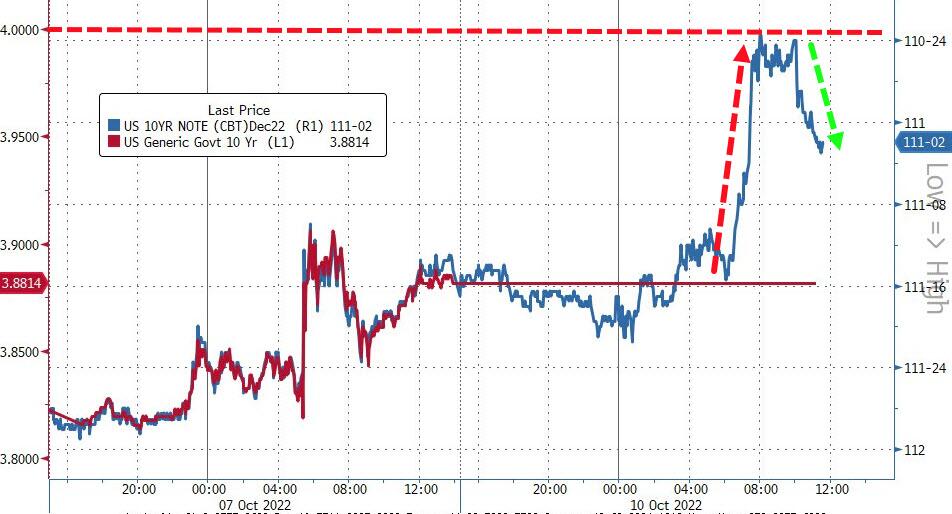
As a result, we saw more of the same weakness, despite the US bond markets being closed. However, bond futures traded and added more pain to equities via higher yields, the continuation of which we may see tomorrow. Fortunately, during the end of the session, yields came off their highs.
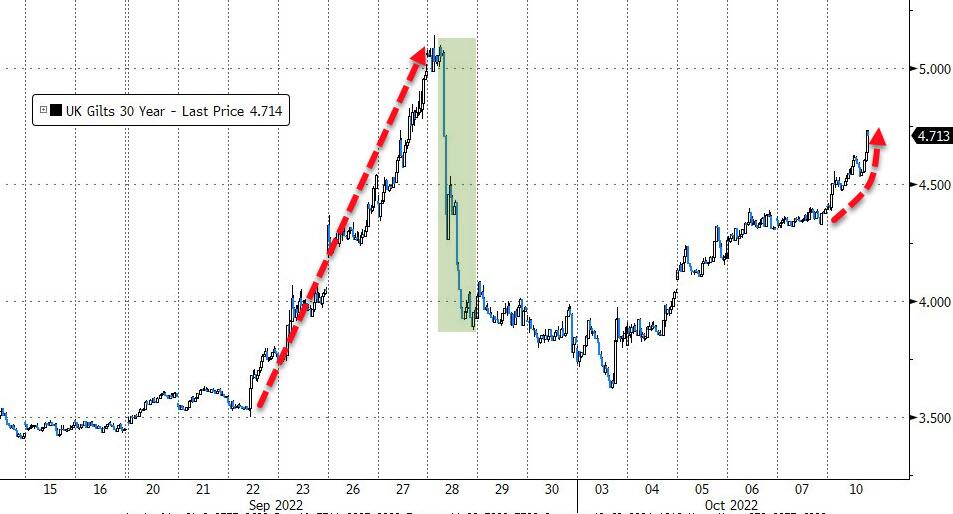
Despite the BoE recent attempt to bail out their bond markets, and efforts to present a new plan, their market broke again with their 30-year Gilt (bond) yields racing higher by a stunning 29bps and almost reaching last month’s high, when the bank slammed on the emergency brake.
Since all Central Banks are tied at the hip, some of England’s issues could very well travel across the Atlantic and affect markets here in the US. My point is that bonds are no longer the ‘safe haven’ they were advertised to be and not being exposed to them is a wise investment decision.
The Fed’s Brainard offered these words of wisdom:
Fed is attentive to risks of further adverse shocks, aware that [market] moves could interact with financial vulnerabilities.” However, she also noted that the “1970s taught [policymakers] that there are risks to easing prematurely”.
In other words, there was no “dovish pivot” present in these remarks, which was disappointing to the always hopeful bullish crowd.
The US Dollar continued its 4-day comeback to one-week highs, as ZeroHedge noted, which caused gold to get hit, with the precious metal dropping below its $1,700 level.
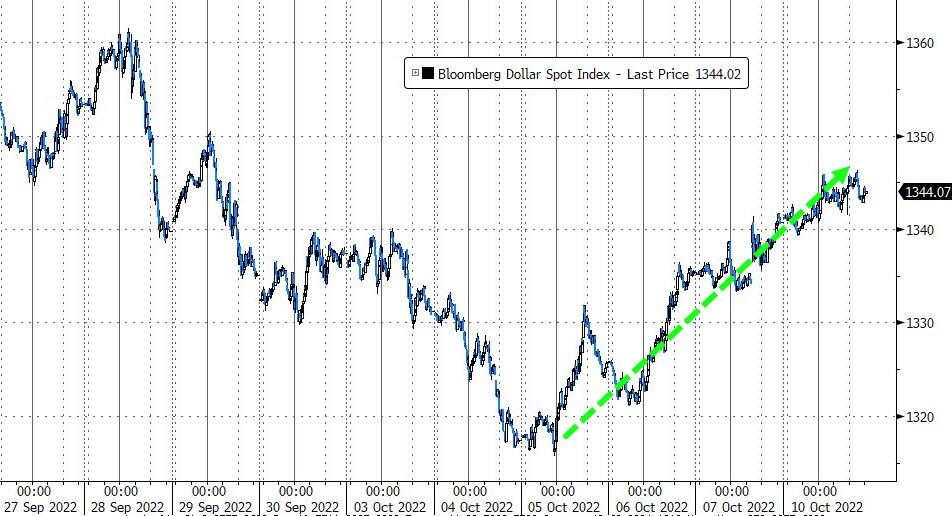
High volatility will remain with us, as Wednesday’s monthly Producer Price Index (PPI) and Friday’s CPI could wreak havoc with markets—in either direction.
2. ETFs in the Spotlight
In case you missed the announcement and description of this section, you can read it here again.
It features some of the 10 broadly diversified domestic and sector ETFs from my HighVolume list as posted every Saturday. Furthermore, they are screened for the lowest MaxDD% number meaning they have been showing better resistance to temporary sell offs than all others over the past year.
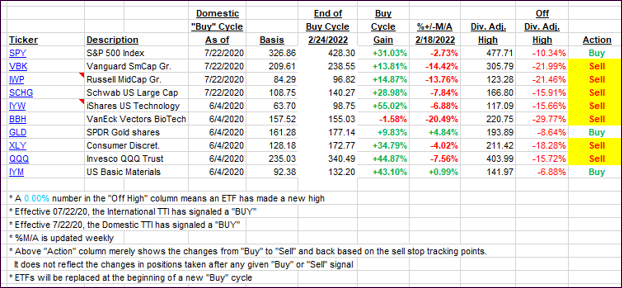
The below table simply demonstrates the magnitude with which these ETFs are fluctuating above or below their respective individual trend lines (%+/-M/A). A break below, represented by a negative number, shows weakness, while a break above, represented by a positive percentage, shows strength.
For hundreds of ETF choices, be sure to reference Thursday’s StatSheet.
For this closed-out domestic “Buy” cycle (2/24/2022), here’s how some of our candidates have fared. Keep in mind that our Domestic Trend Tracking Index (TTI) signaled a “Sell” on that date, which overrode the existing “Buys” shown for SPY and IYM:
Click image to enlarge.
Again, the %+/-M/A column above shows the position of the various ETFs in relation to their respective long-term trend lines, while the trailing sell stops are being tracked in the “Off High” column. The “Action” column will signal a “Sell” once the -12% point has been taken out in the “Off High” column, which has replaced the prior -8% to -10% limits.
3. Trend Tracking Indexes (TTIs)
Our TTIs slipped as the major indexes got hit again.
This is how we closed 10/10/2022:
Domestic TTI: -11.04% below its M/A (prior close -10.43%)—Sell signal effective 02/24/2022.
International TTI: -14.97% below its M/A (prior close -14.54%)—Sell signal effective 03/08/2022.
Disclosure: I am obliged to inform you that I, as well as my advisory clients, own some of the ETFs listed in the above table. Furthermore, they do not represent a specific investment recommendation for you, they merely show which ETFs from the universe I track are falling within the specified guidelines.
All linked charts above are courtesy of Bloomberg via ZeroHedge.
Contact Ulli