
- Moving the markets
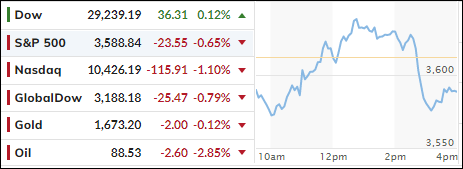
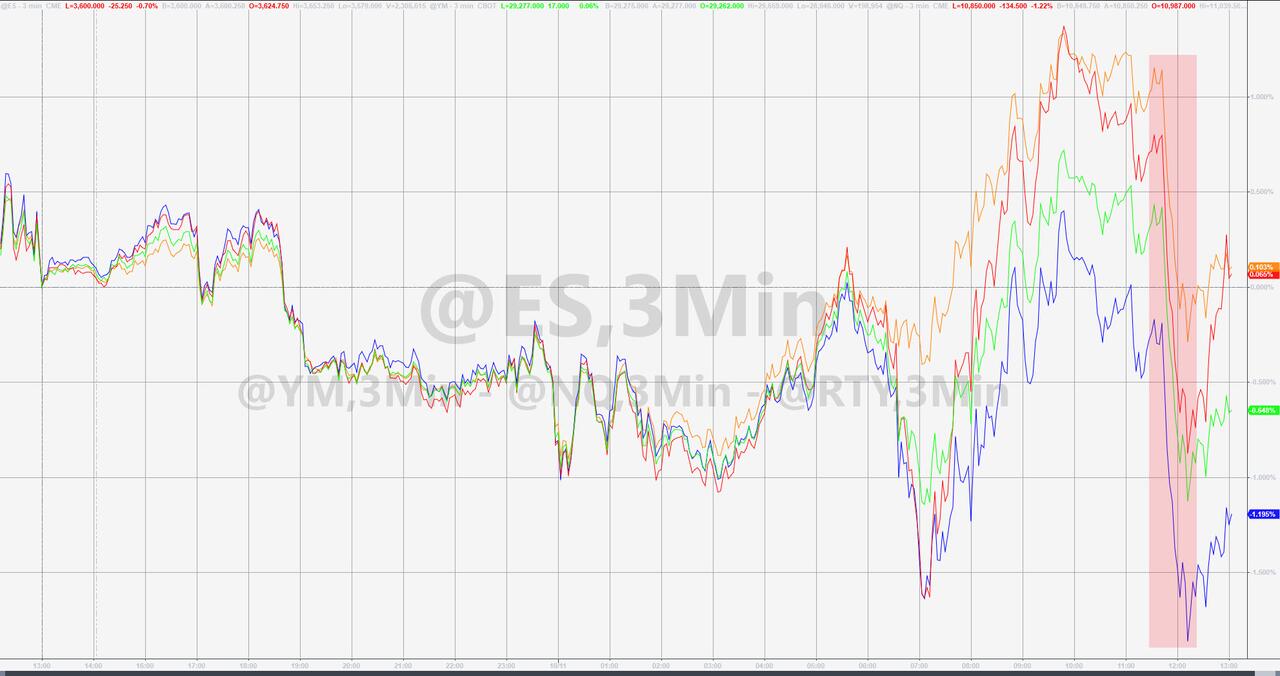
An early morning ramp-a-thon pushed equities into the green, with the Dow at one moment sporting a 400-point gain but, things turned sour quickly, and the major indexes dove into the close.
Only the Dow managed to cling to its unchanged line, while the S&P and Nasdaq ended solidly in the red with the former now scoring a 5-day losing streak. For sure, key inflation data caused uncertainty with the PPI due out tomorrow, followed by the CPI on Thursday. Rounding out week will be retail sales on Friday and the beginning of earnings season.
Causing late dive in the markets was a report from the Bank of England indicating that its intervention will be over soon and that pension funds have just three days to rebalance positions. For sure, that was tough talk, now we’ll have to wait and see if it was simply a bluff with the bailout scheme scheduled to continue.
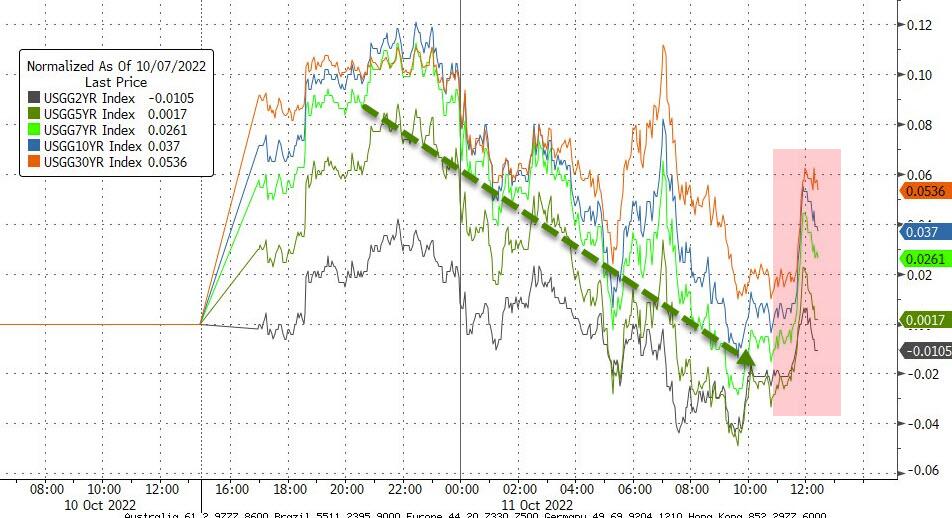
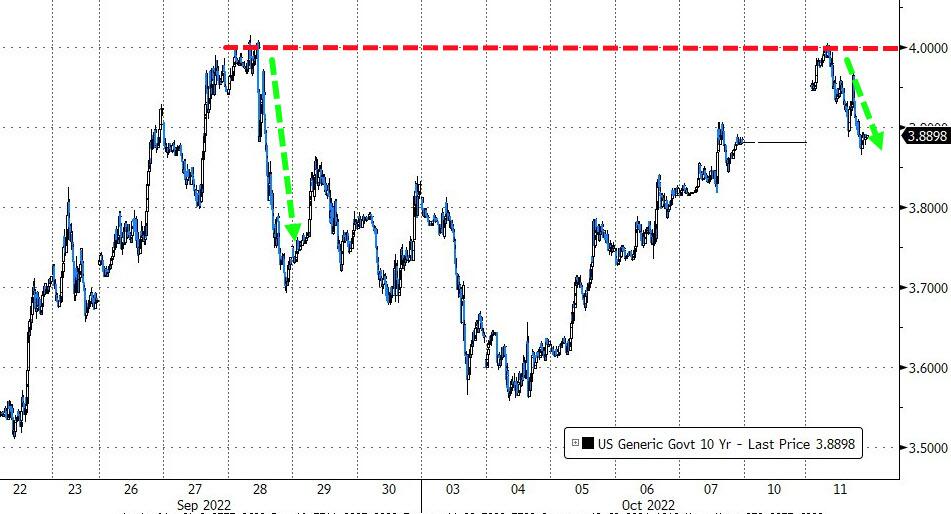
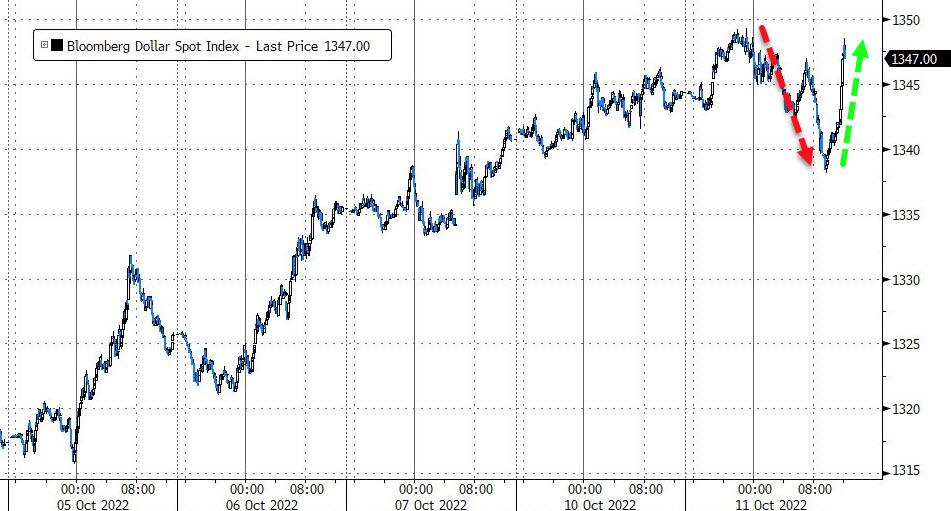
Bond yields were mixed and slipped a tad, but the 10-year kissed its 4% level again before backing off into the close. The US Dollar rode a roller coaster and scored only a slight gain.
All eyes are now on tomorrow’s Producer Price Index report, which could create much volatility by pushing markets in either direction.
2. ETFs in the Spotlight
In case you missed the announcement and description of this section, you can read it here again.
It features some of the 10 broadly diversified domestic and sector ETFs from my HighVolume list as posted every Saturday. Furthermore, they are screened for the lowest MaxDD% number meaning they have been showing better resistance to temporary sell offs than all others over the past year.
The below table simply demonstrates the magnitude with which these ETFs are fluctuating above or below their respective individual trend lines (%+/-M/A). A break below, represented by a negative number, shows weakness, while a break above, represented by a positive percentage, shows strength.
For hundreds of ETF choices, be sure to reference Thursday’s StatSheet.
For this closed-out domestic “Buy” cycle (2/24/2022), here’s how some of our candidates have fared. Keep in mind that our Domestic Trend Tracking Index (TTI) signaled a “Sell” on that date, which overrode the existing “Buys” shown for SPY and IYM:
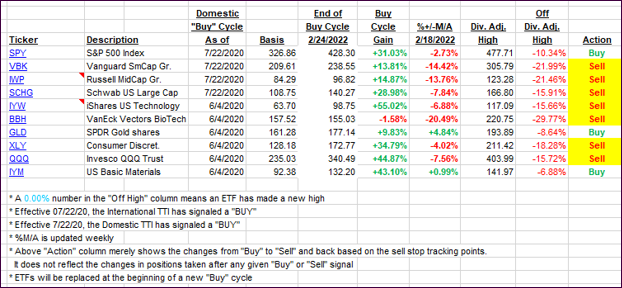
Click image to enlarge.
Again, the %+/-M/A column above shows the position of the various ETFs in relation to their respective long-term trend lines, while the trailing sell stops are being tracked in the “Off High” column. The “Action” column will signal a “Sell” once the -12% point has been taken out in the “Off High” column, which has replaced the prior -8% to -10% limits.
3. Trend Tracking Indexes (TTIs)
Our TTIs continue their downward path.
This is how we closed 10/11/2022:
Domestic TTI: -11.44% below its M/A (prior close -11.04%)—Sell signal effective 02/24/2022.
International TTI: -15.66% below its M/A (prior close -14.97%)—Sell signal effective 03/08/2022.
Disclosure: I am obliged to inform you that I, as well as my advisory clients, own some of the ETFs listed in the above table. Furthermore, they do not represent a specific investment recommendation for you, they merely show which ETFs from the universe I track are falling within the specified guidelines.
All linked charts above are courtesy of Bloomberg via ZeroHedge.
Contact Ulli