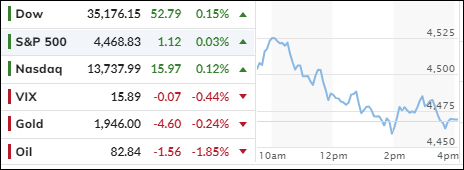
Inflation Report Triggers Market Whiplash

Ulli Market Commentary Contact

[Chart courtesy of MarketWatch.com]

  1. Moving the markets

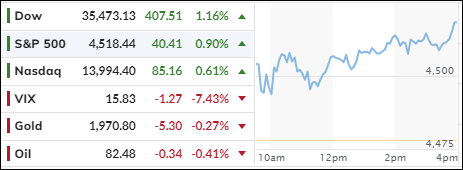
The latest consumer price index (CPI) report showed that inflation in July was lower than expected on a yearly basis, but still higher than the Fed’s comfort zone. The report also indicated that real average weekly earnings did not change last month, which could be seen as a positive sign for consumers.

However, the report also revealed some signs of persistent inflation. The core CPI, which excludes food and energy, rose 4.7% year-over-year, well above the Fed’s 2% target. And the headline inflation rate was still above 3%, the same as in June.

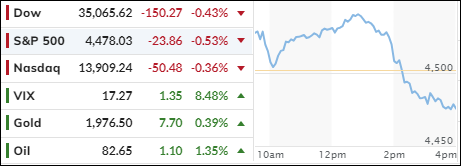
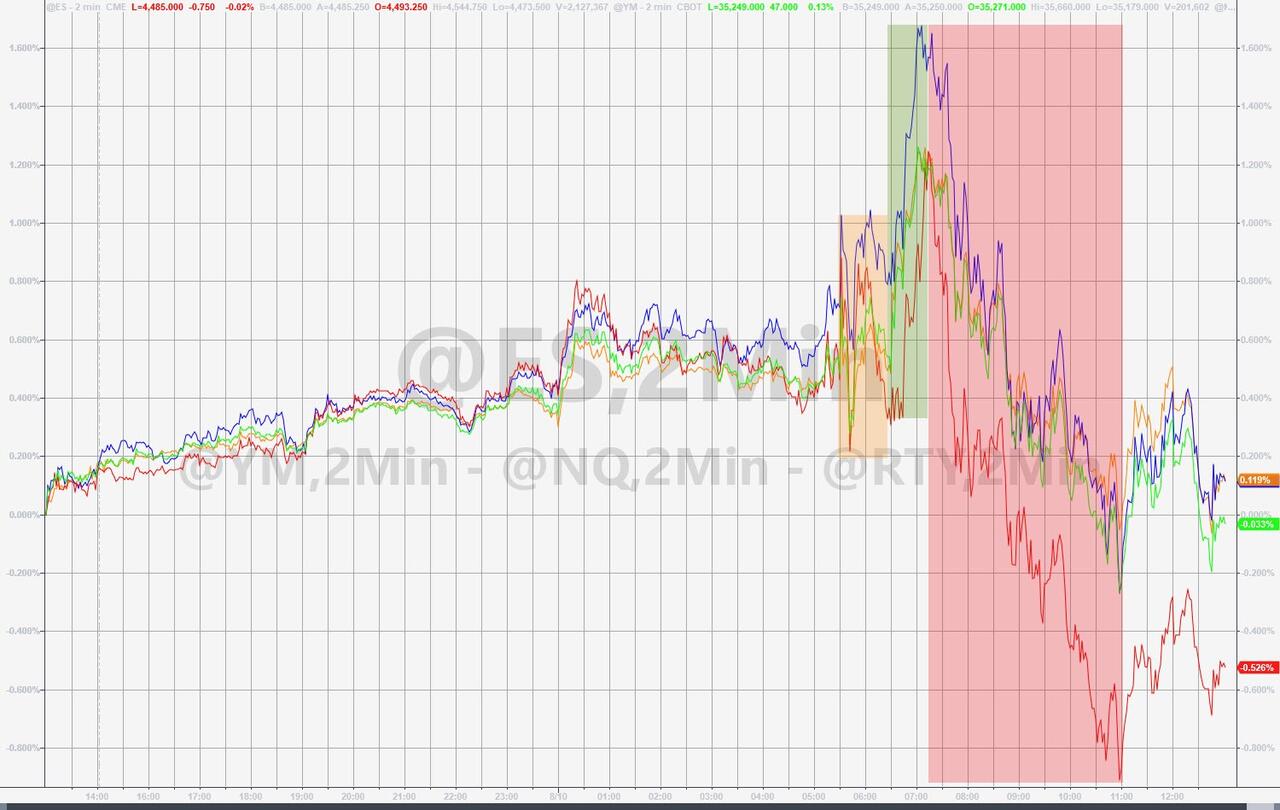
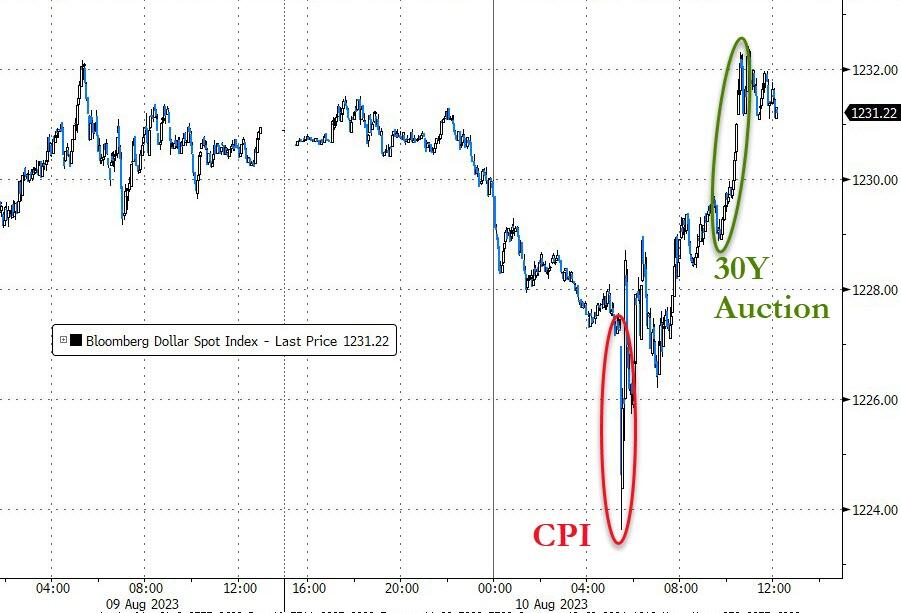
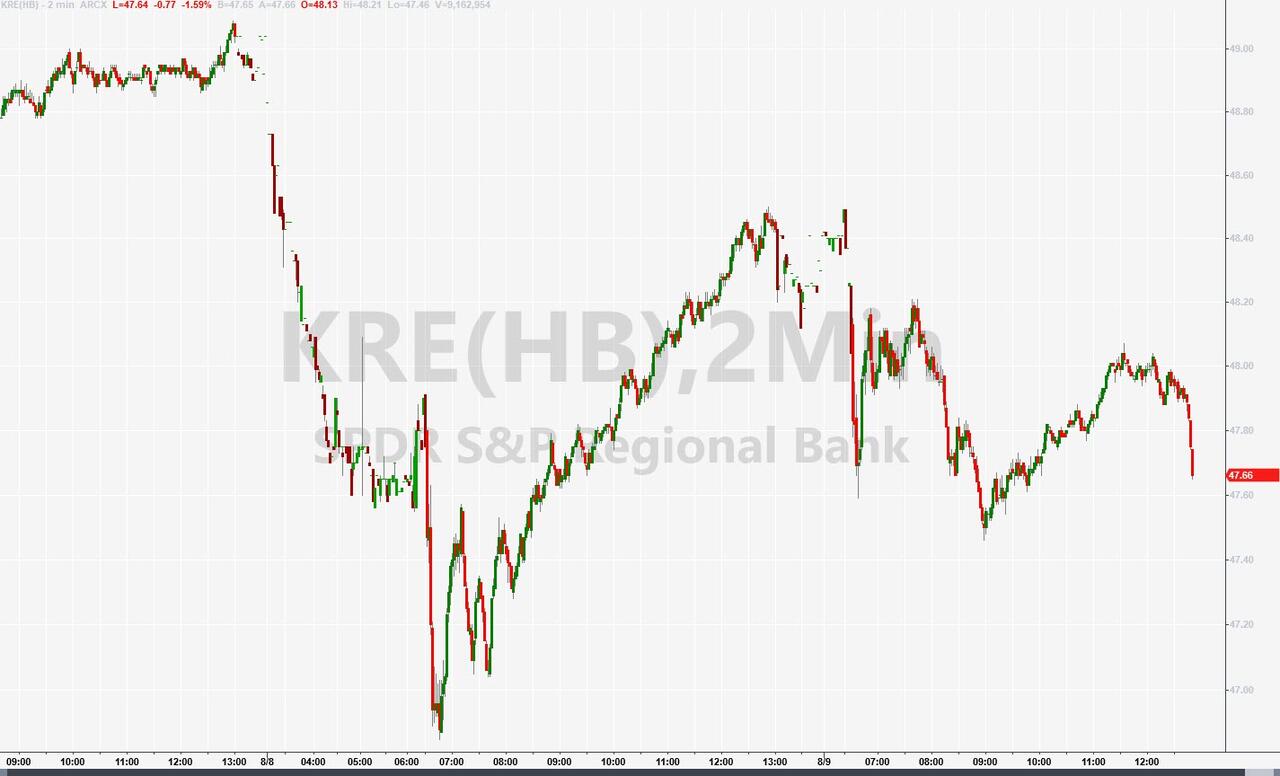
The market reaction was mixed and volatile. Initially, traders and algorithms focused on the lower-than-expected annual inflation rate and pushed the Dow up by more than 400 points. But later, they realized that the data might not be enough to convince the Fed to delay tapering its bond purchases, and the rally fizzled out. The major indexes gave up almost all early gains by the end of the day.

ZeroHedge summed it up best:

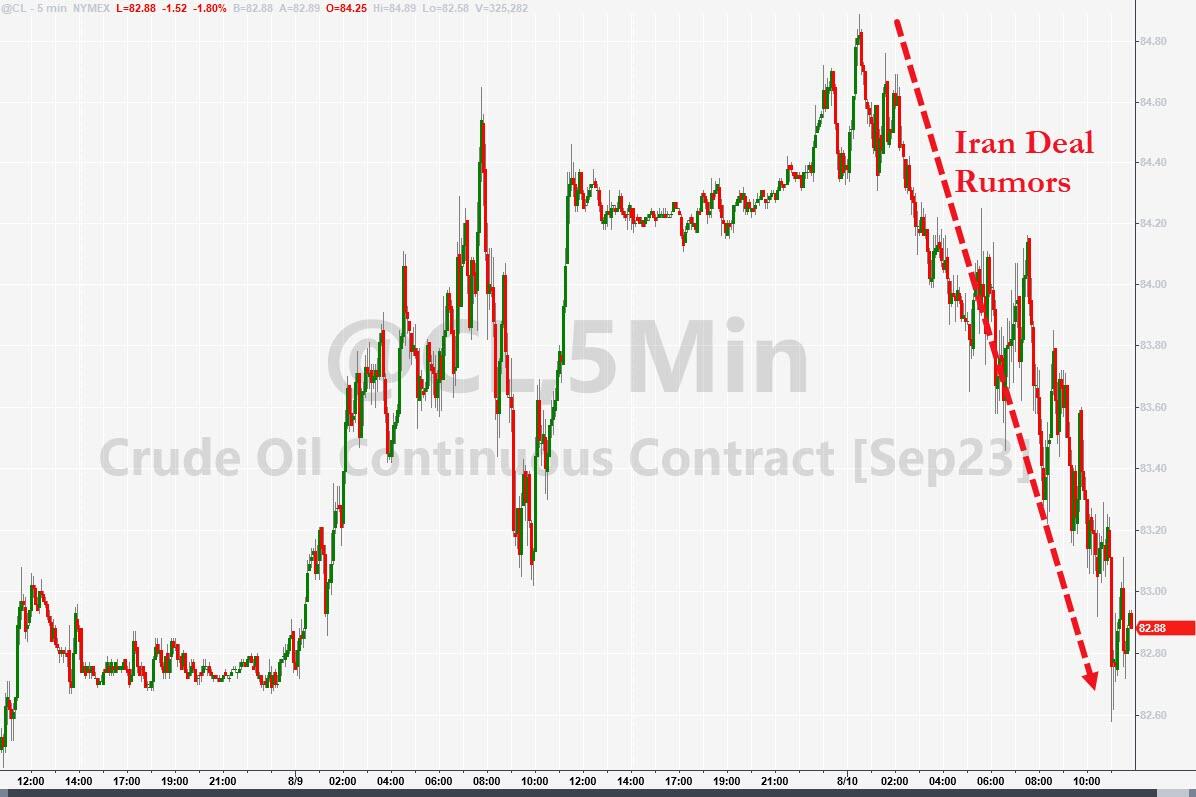
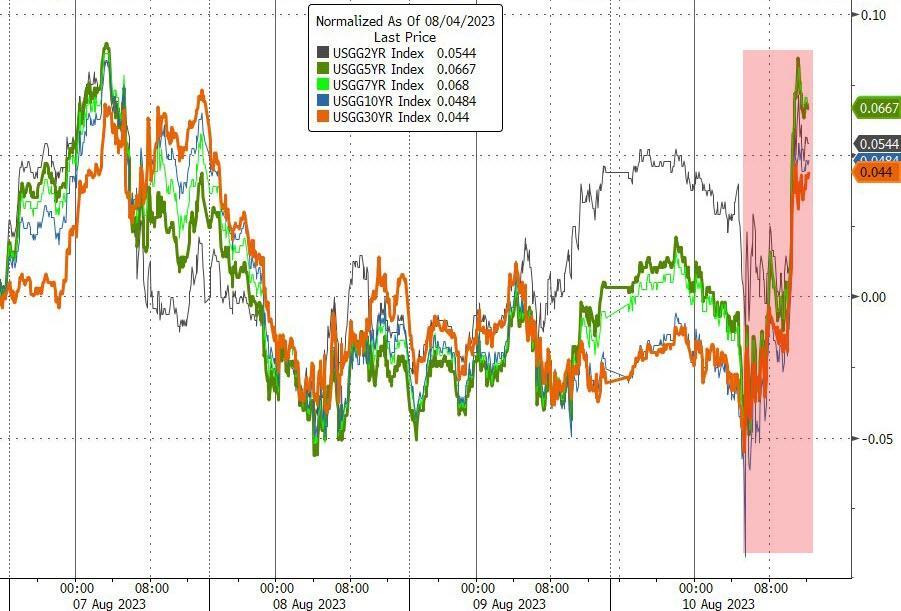
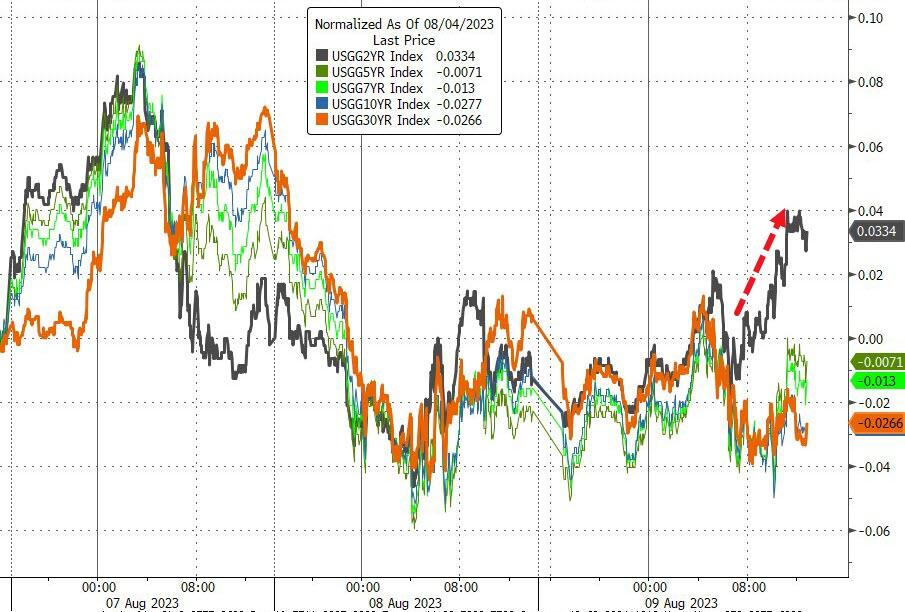
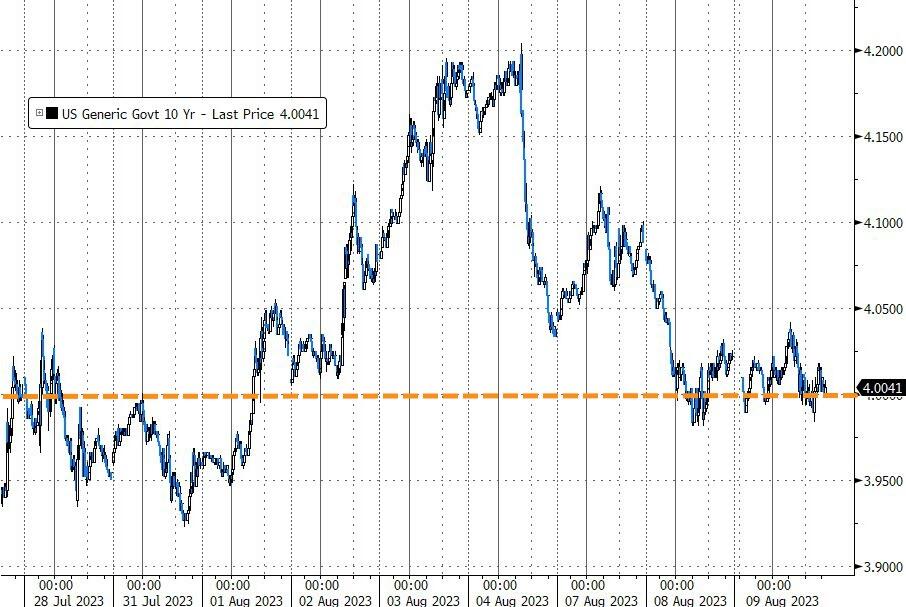
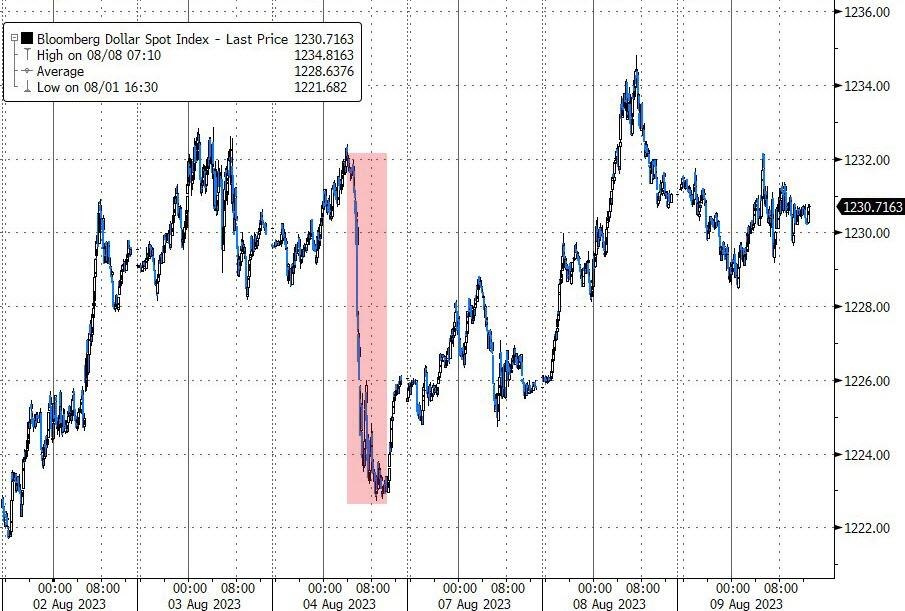
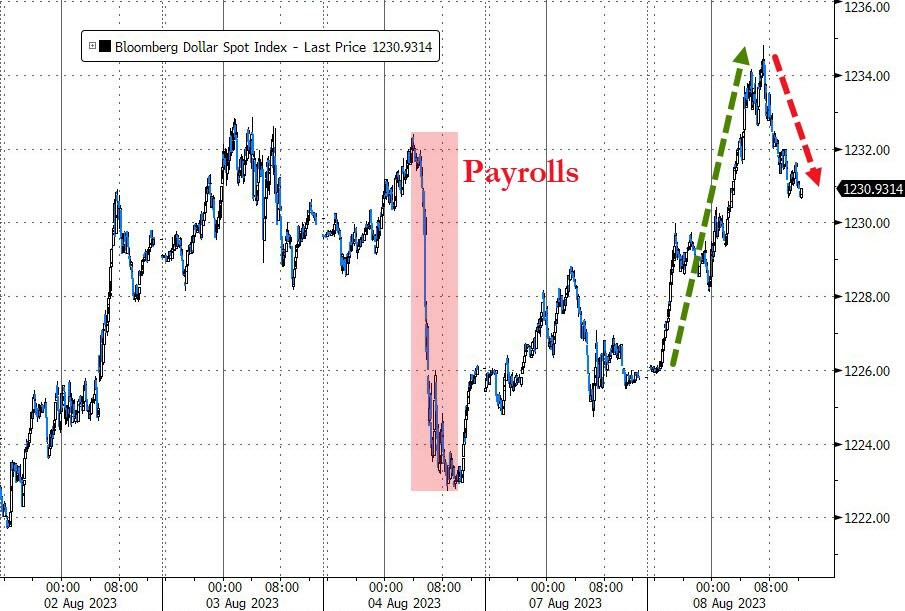
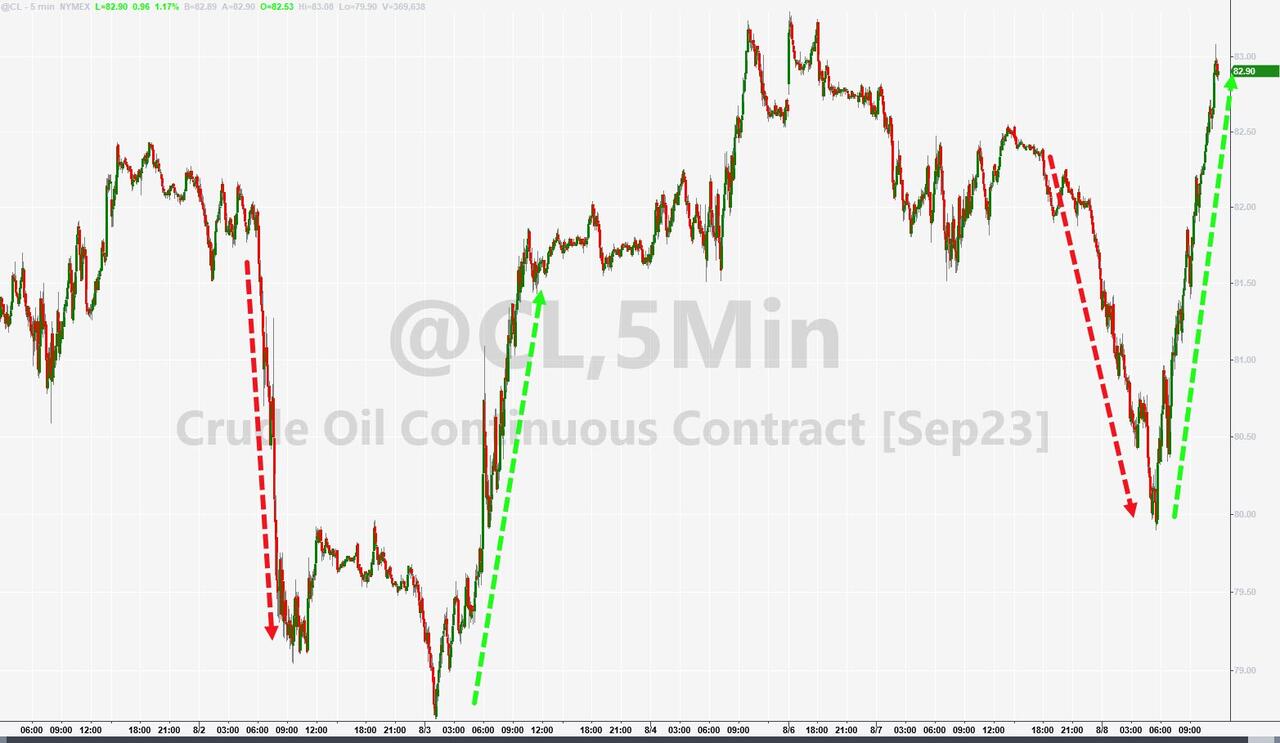
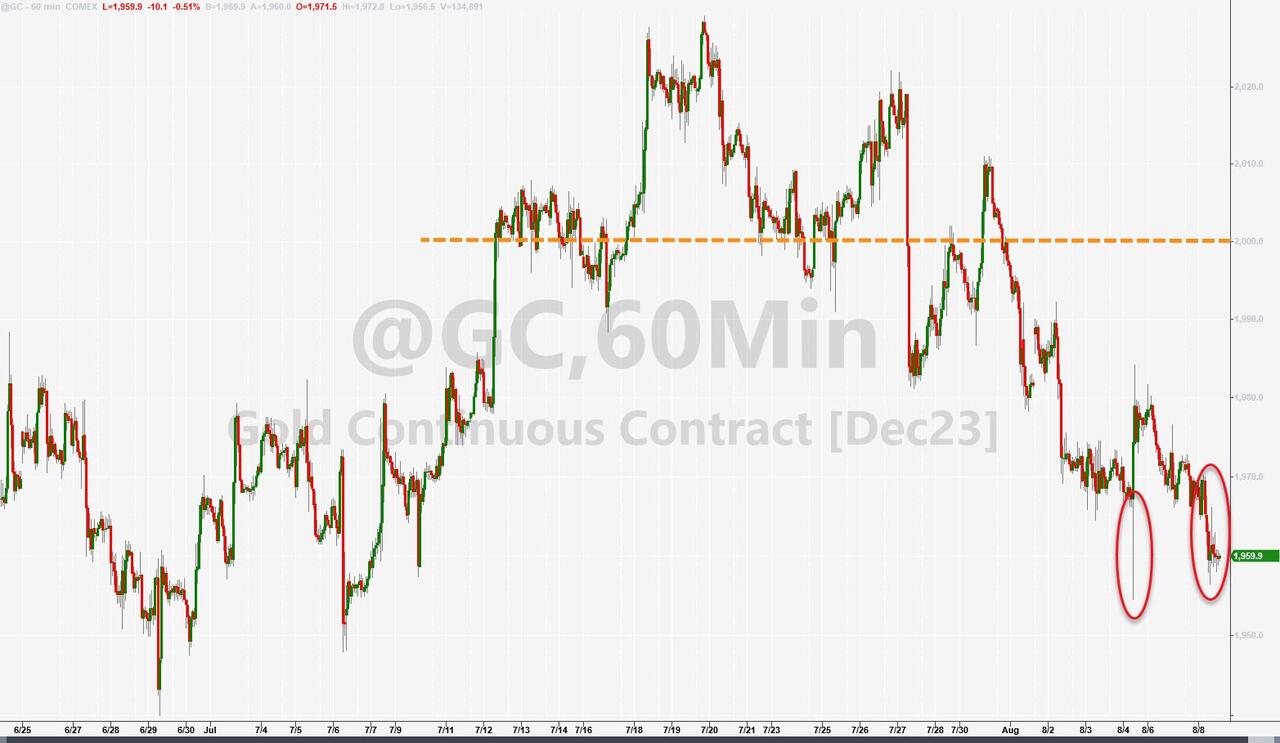
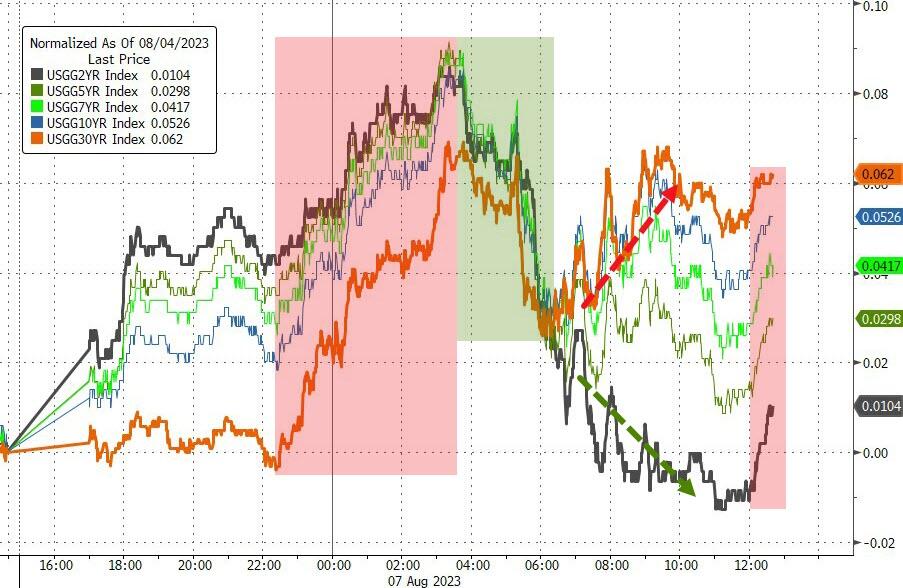
A quiet illiquid summer day which saw oil pump-and-dump, bond yields drop-and-pop, stocks spike-and-puke, gold jump-and-slump, and the dollar purge-and-surge.

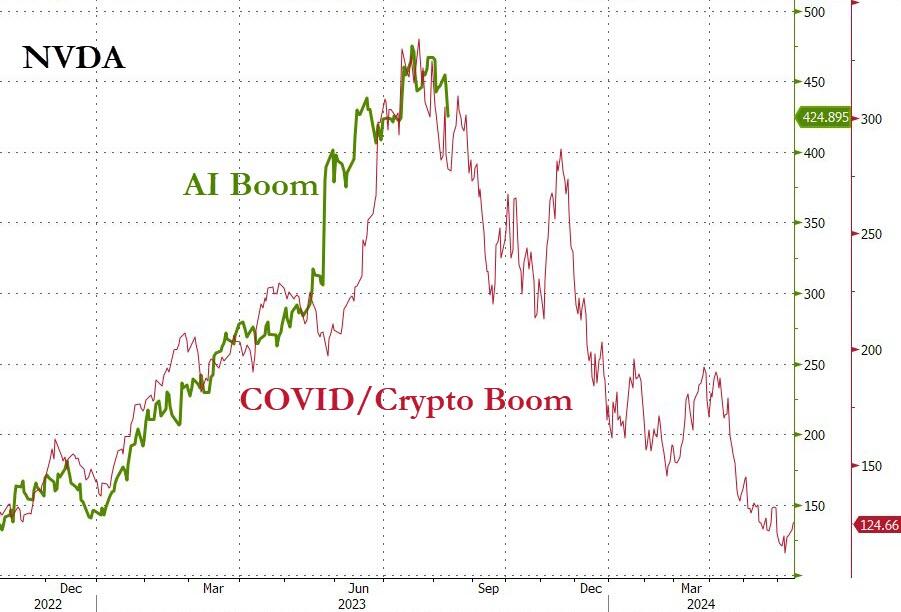
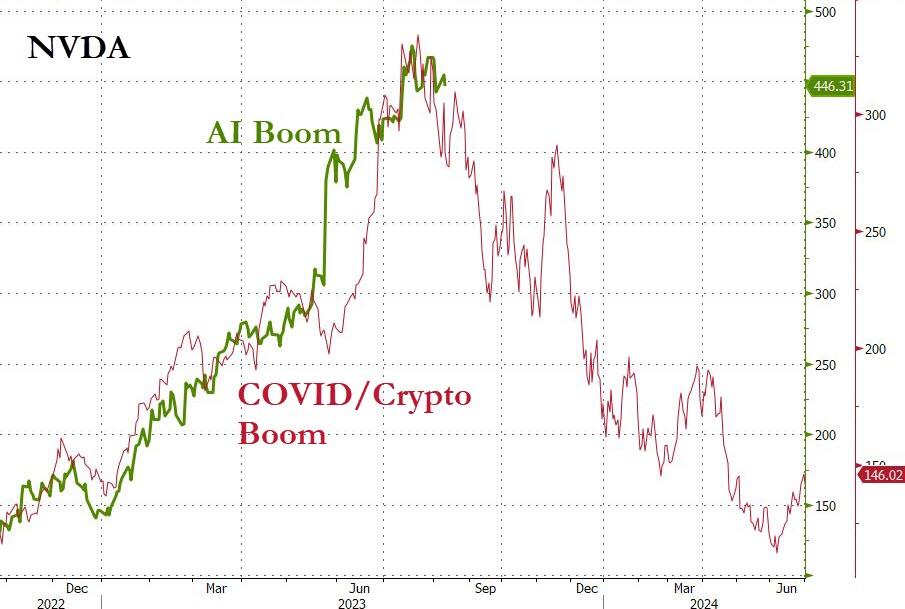
It seems that nothing much changed in the big picture, but the AI boom reversal prediction is still on track.

Read More
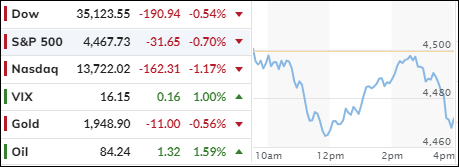
Markets Fall As CPI Report Looms; NVDA Leads AI Bust

Ulli Market Commentary Contact

[Chart courtesy of MarketWatch.com]

  1. Moving the markets

The markets were nervous as they awaited the CPI report for July, which will be released tomorrow, and the PPI report for the same month, which will come out on Friday.

These reports will show how much prices have changed for consumers and producers, and they may influence the Fed’s decision on interest rates. The markets hoped that inflation would slow down enough to make the Fed stop raising rates, a wish that had fueled the 2023 rally.

But the markets also feared that inflation was still lurking around the corner, and that the official numbers might not capture the true picture. The markets wobbled and wavered, but ultimately the pessimists prevailed, and the major indexes ended lower.

Other factors also weighed on the markets, such as China’s deflationary pressures, Italy’s backpedaling on bank taxes, and doubts about the AI boom. But all eyes were on the looming CPI report, which could make or break the market’s mood.

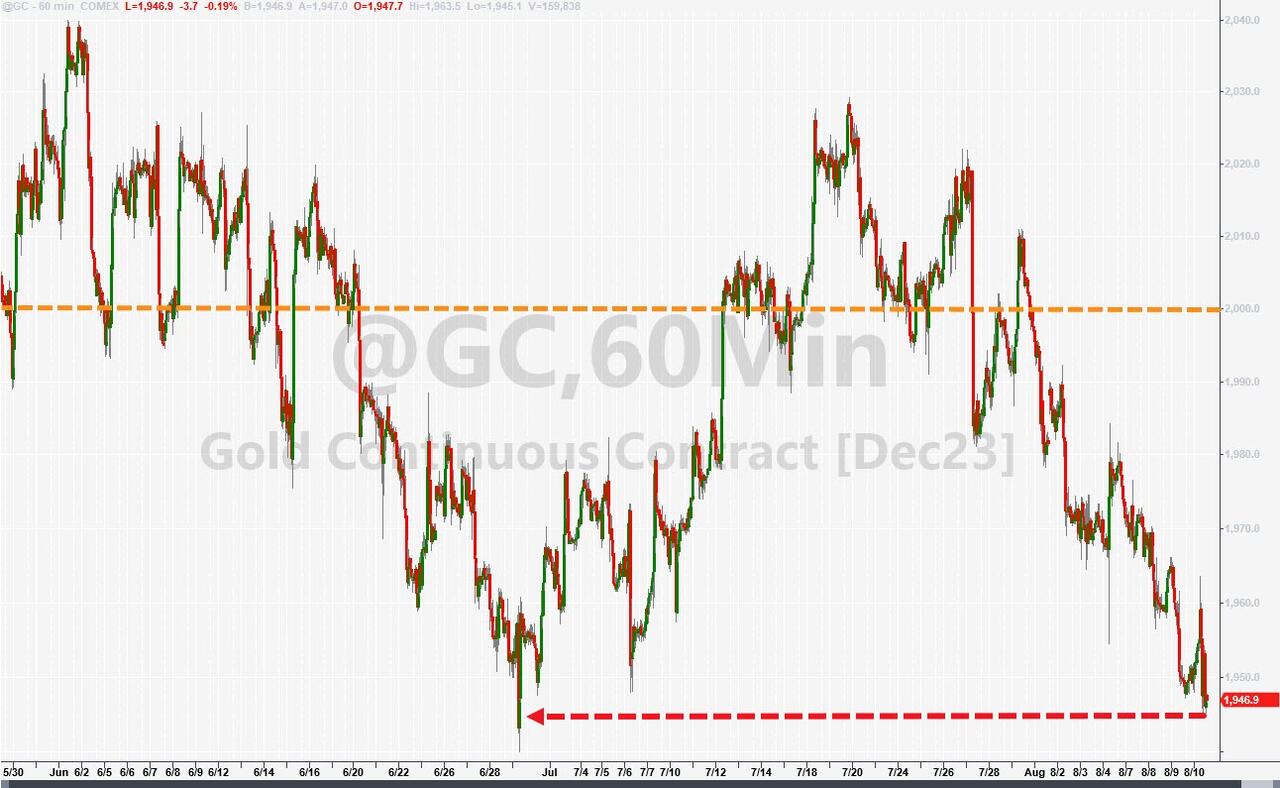
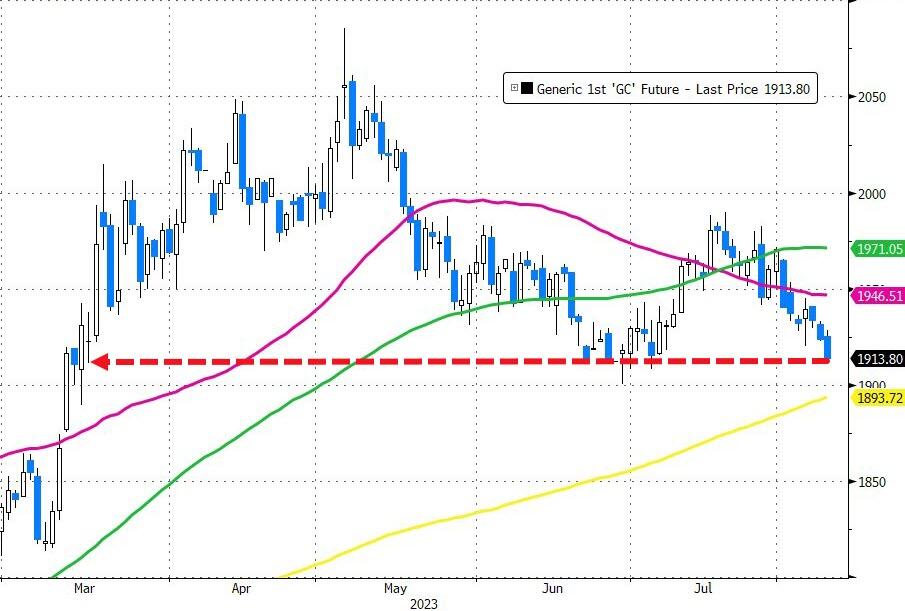
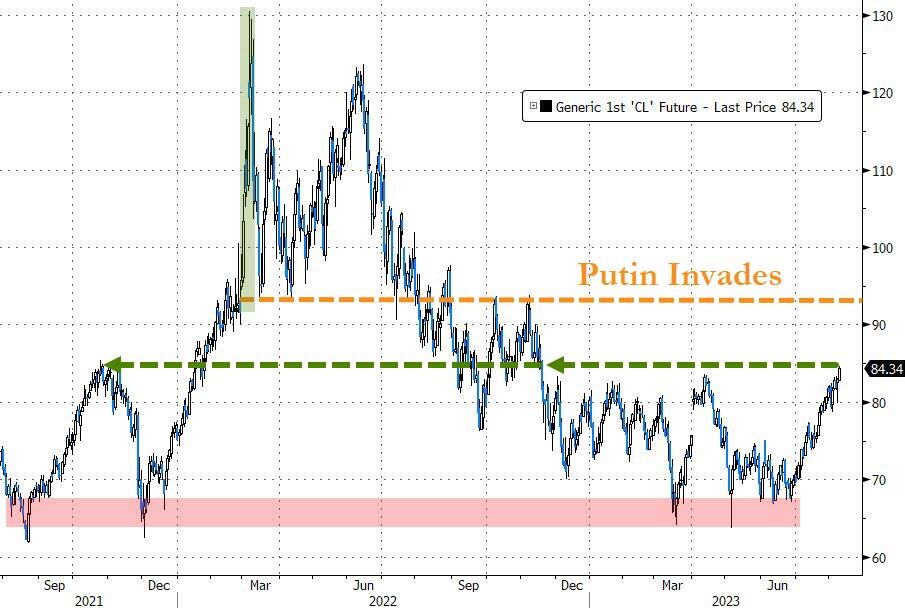
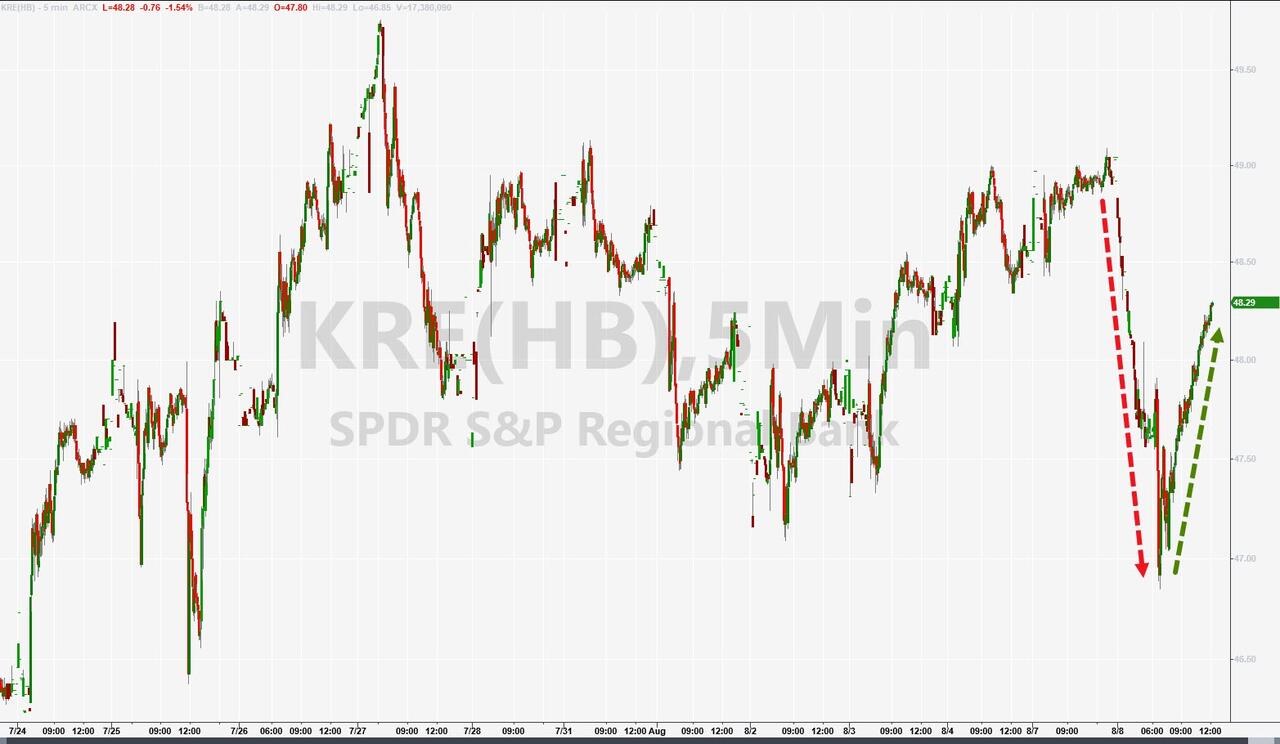
US banks suffered another day of losses, bond yields were mixed but the 10-year stayed above 4%, and the dollar was unchanged. Gold fell to its lowest level since March, while crude oil reached new highs for 2023, with WTI above $84 a barrel.

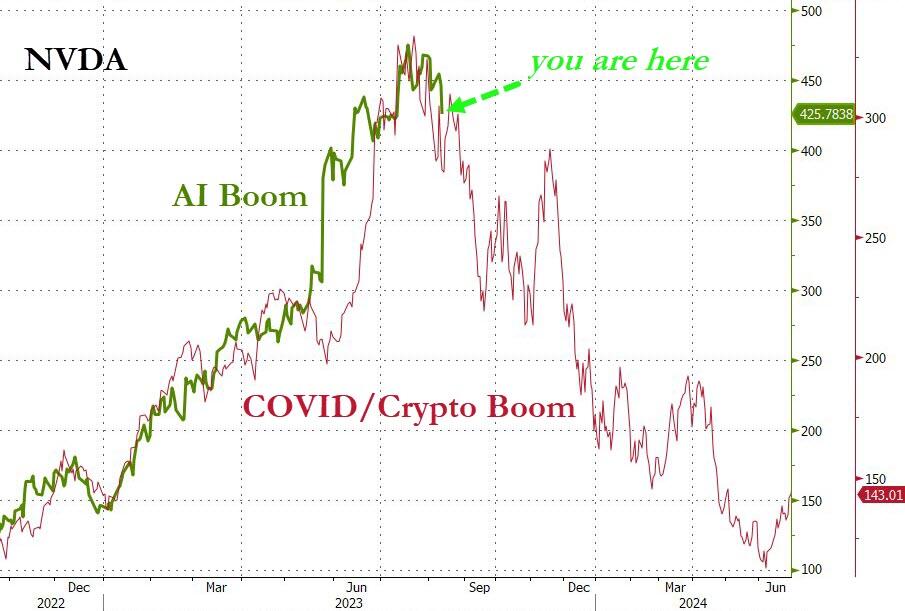
One of the most notable losers of the day was NVDA, the leading chipmaker for AI applications. NVDA dropped to its lowest point in a month, down 12% from its mid-July peak. This raised questions about whether the AI boom was losing steam, as this chart suggests.

Is history repeating itself?

Read More

China, Italy And Moody’s Spoil The Market Mood

Ulli Market Commentary Contact

[Chart courtesy of MarketWatch.com]

  1. Moving the markets

The market opened with a thud today, as investors dumped stocks amid a slew of bad news from around the world. China reported dismal trade data, showing a sharp drop in both imports and exports.

Italy slapped its banks with a surprise tax hike, sparking fears of a new debt crisis. And Moody’s downgraded the US banking sector, citing higher funding costs, regulatory capital issues and rising risks from commercial real estate loans.

Moody’s also warned of a looming recession in the US, saying that the banking sector will face tighter credit conditions and higher loan losses. So much for the Fed’s reassurance that the financial system is “resilient”. Maybe they should check their dictionaries for the meaning of that word.

The earnings season did not help either, as UPS missed its revenue target for the second quarter, sending its shares lower. The only bright spot was a late rally that trimmed some of the losses, thanks to some short covering and bargain hunting. The major indexes ended the day in the red, but not as deep as they were in the morning.

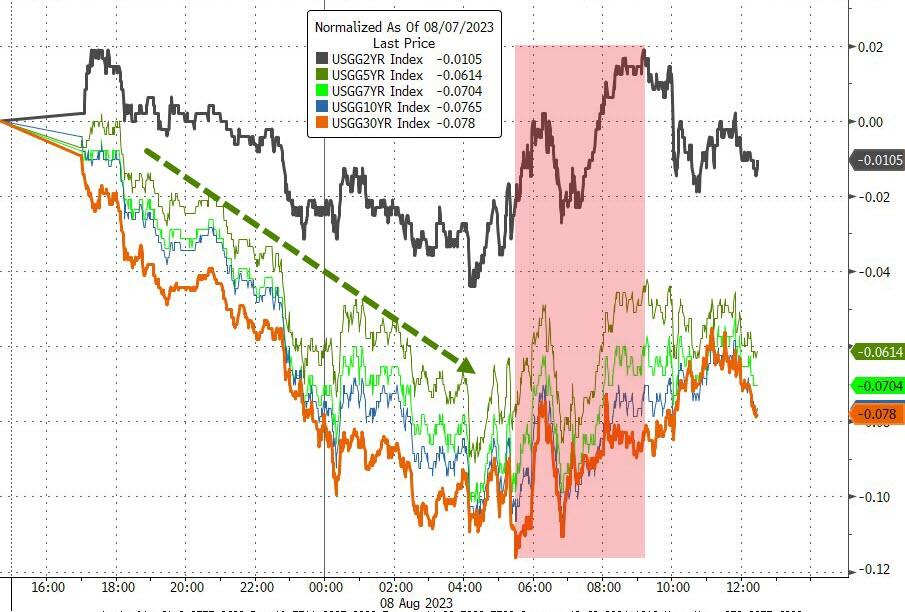
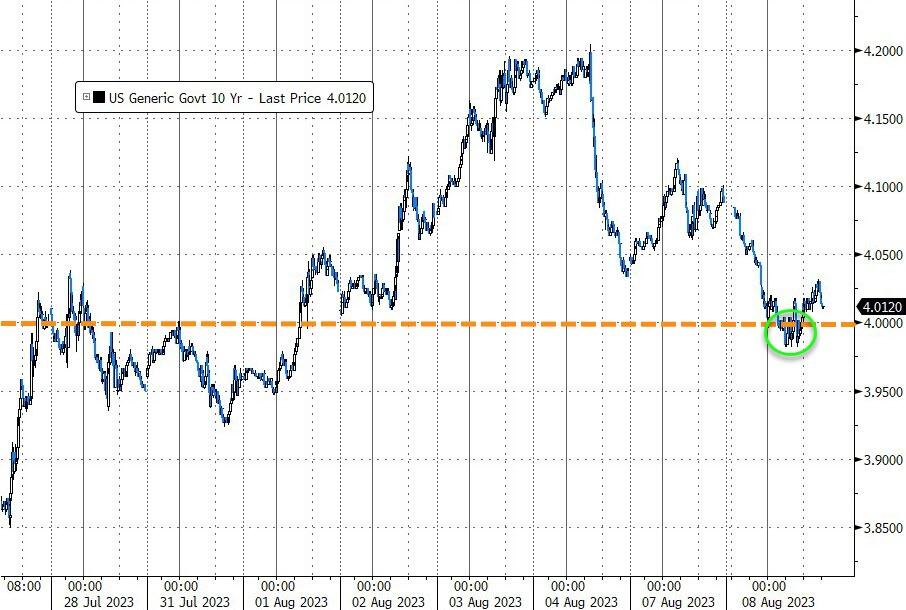
The bond market also saw some volatility, as the 10-year yield dipped below 4% at one point, before recovering slightly. The dollar gained strength against most currencies, while oil and gold prices retreated.

The AI corollary to the Covid/crypto boom is still alive, as this chart shows.

What’s next?

Read More

Market Bounces Back On Earnings Strength, But VIX Looms Large

Ulli Market Commentary Contact

[Chart courtesy of MarketWatch.com]

  1. Moving the markets

The Dow led the way in a bullish day for the stock market, while the Nasdaq trailed behind but managed to end its 4-day losing streak.

Tesla was one of the laggards, dropping 2% amid a tech sell-off. The rally was fueled by strong earnings reports, as 80% of the S&P 500 companies that have reported so far beat Wall Street’s lowered expectations.

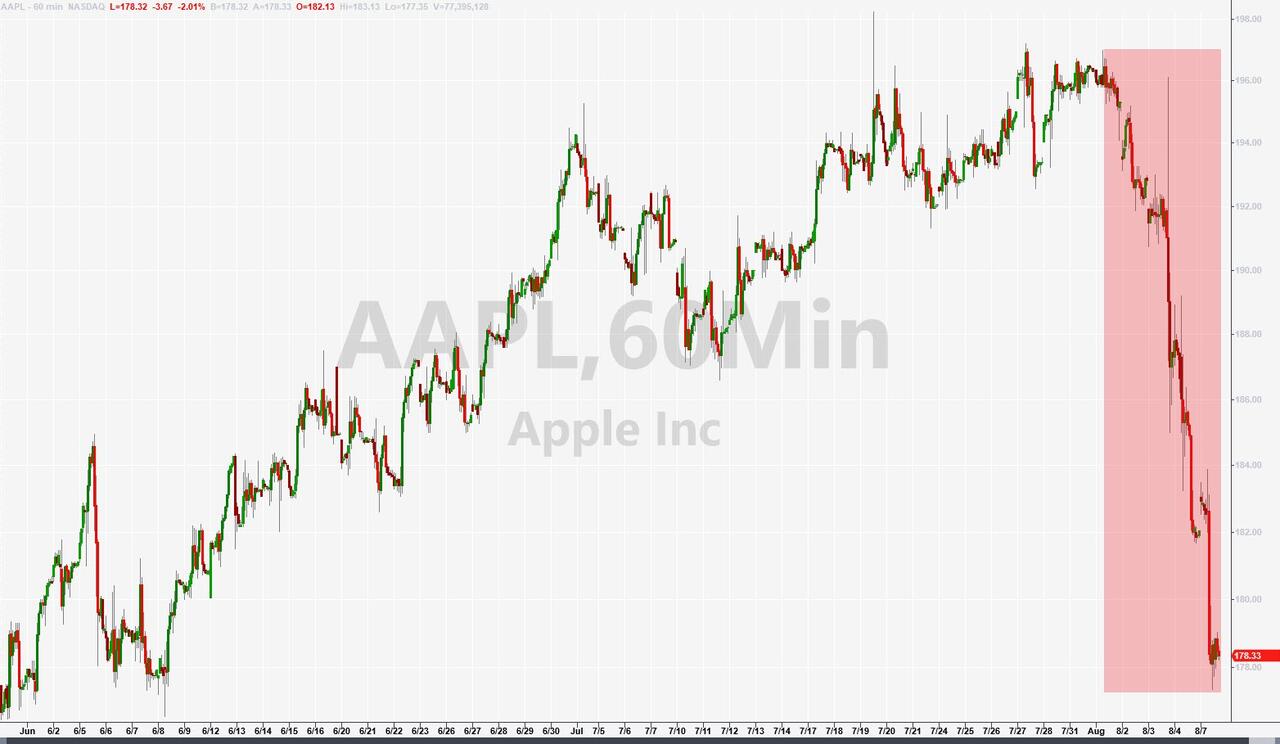
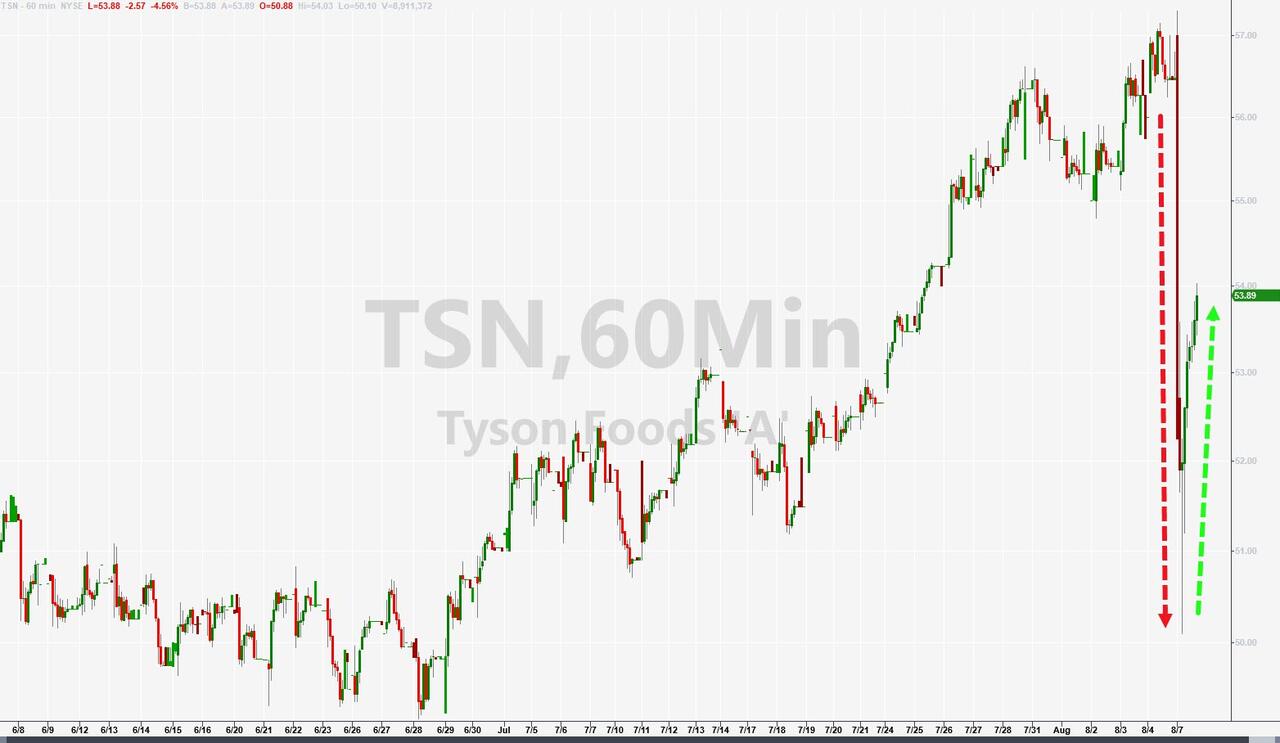
The market rebounded despite rising bond yields and Apple’s fifth consecutive day of losses, which shaved off 10% of its value since last week. This was its worst performance since November. Tyson Foods also had a rough day, but the market recovered some of its losses in the final hour thanks to bargain hunters.

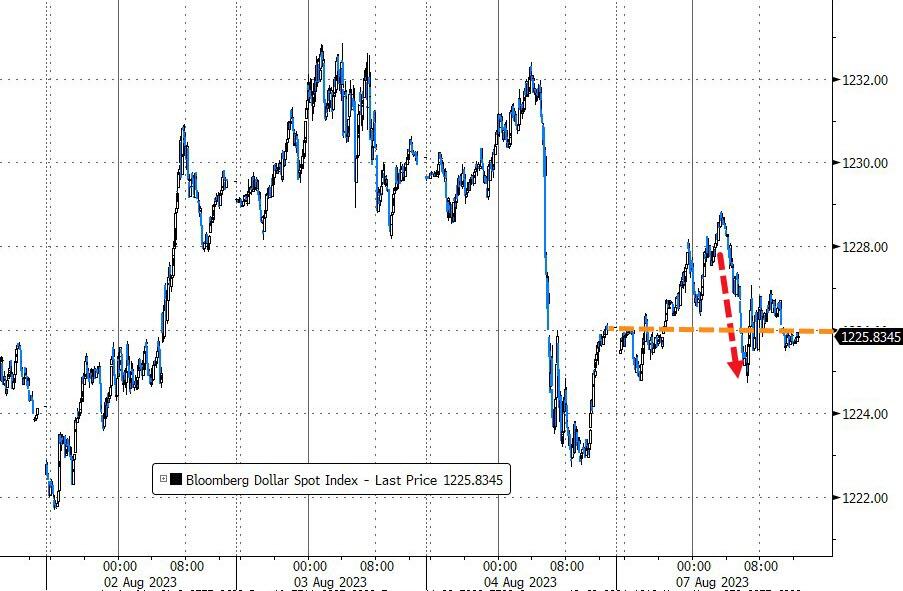
The dollar was flat, while gold dipped and then recovered but still closed in the red.

Later this week, investors will pay attention to the consumer and producer prices indexes, which are key indicators of inflation and economic health. Both could move the market significantly depending on their outcomes.

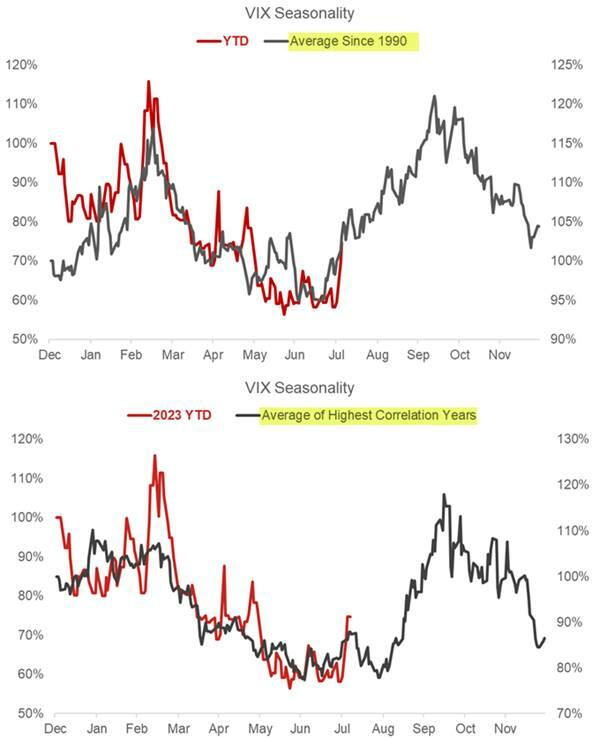
In the meantime, traders should be aware of the seasonal pattern of the volatility index (VIX), which tends to spike in August. This chart shows how this could spell trouble for stocks, as higher volatility usually means lower prices.

Remember, when the VIX goes up, stocks go down.

Read More
ETFs On The Cutline – Updated Through 08/04/2023

Ulli ETFs on the Cutline Contact

Do you want to know which ETFs are hot and which ones are not? Then you need my High-Volume ETF Cutline report. It tells you how close or far each of the 311 ETFs I follow is from its long-term trend line (39-week SMA). These are the ETFs that trade more than $5 million a day, so they are not some obscure funds that nobody cares about.

The report is split into two parts: The winners that are above their trend line (%M/A), and the losers that are below it. The yellow line is the line of shame that separates them. You can see how many ETFs are in each group and how they have changed since the last report (240 vs. 192 current).

Take a peek:

The HV ETF Master Cutline Report

If you are confused by some of the terms we use, don’t panic. I have a helpful Glossary of Terms for you.

If you want to learn more about the Cutline method and how it can make you rich (or at least less poor), read my original post here.

ETF Tracker Newsletter For August 4, 2023

Ulli ETF Tracker Contact

ETF Tracker StatSheet          

You can view the latest version here.

Tech Split, Wage Spike, Market Dip, Oil Rip: A Mixed Bag for the Economy

[Chart courtesy of MarketWatch.com]

  1. Moving the markets

Tech giants Amazon and Apple had a split decision in their earnings reports yesterday. Amazon delivered a knockout, while Apple got knocked out. The result? A combined loss of about $30 billion in market value today. Ouch indeed!

Meanwhile, the job market showed some signs of cooling down, but not enough to ease the inflation fears. The payroll report for July missed the mark, but the average hourly wages beat expectations by rising 0.4%. That means workers are getting paid more, but also paying more for everything else.

ZeroHedge had a bleak take on the situation:

According to the headlines, the US added 187K jobs in July, and 268K more people found employment. But a closer look reveals that most of these jobs were part-time, low-paying gigs. In fact, the number of full-time workers dropped by a staggering 585K, while the number of people working multiple jobs rose by 118K. So much for the economic “miracle”!

The Babylon Bee added some humor to the mix: “White House says that the economy is so successful that the average American has twice as many jobs as he had two years ago.” Haha!

The stock market started off strong, but then hit a wall and crashed hard. The major indexes ended up in the red, with the S&P 500 sinking to its lowest level in three weeks.

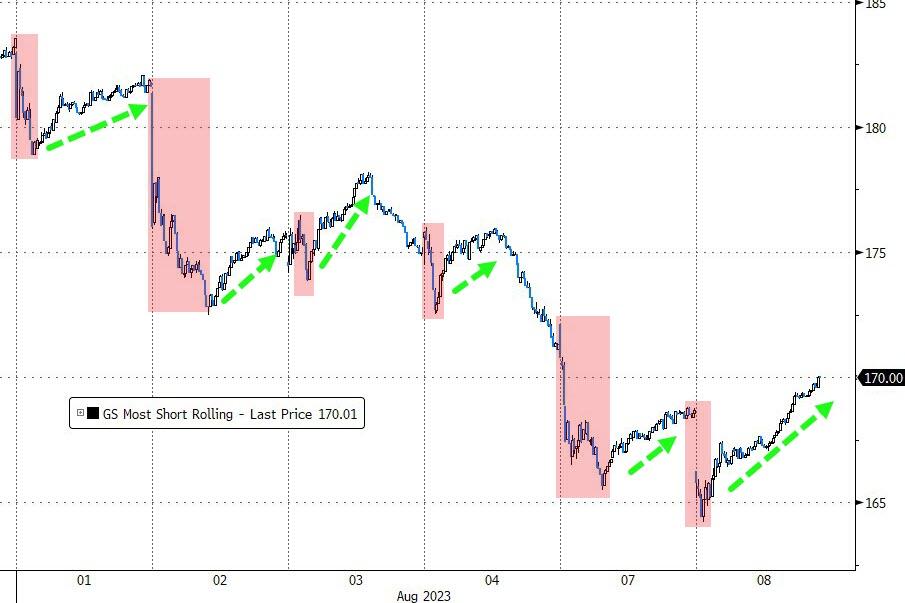
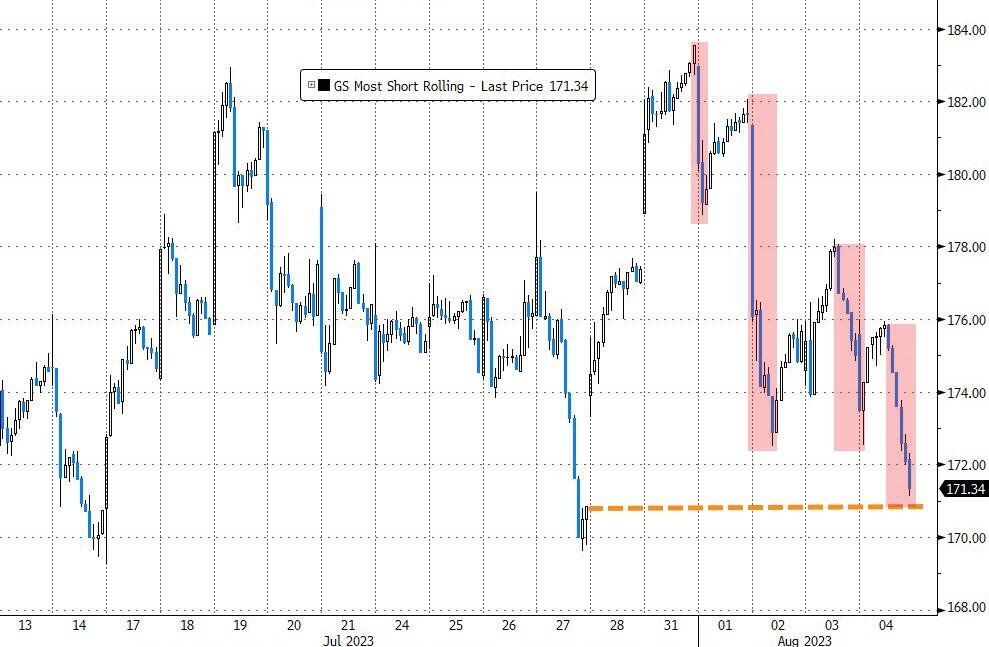
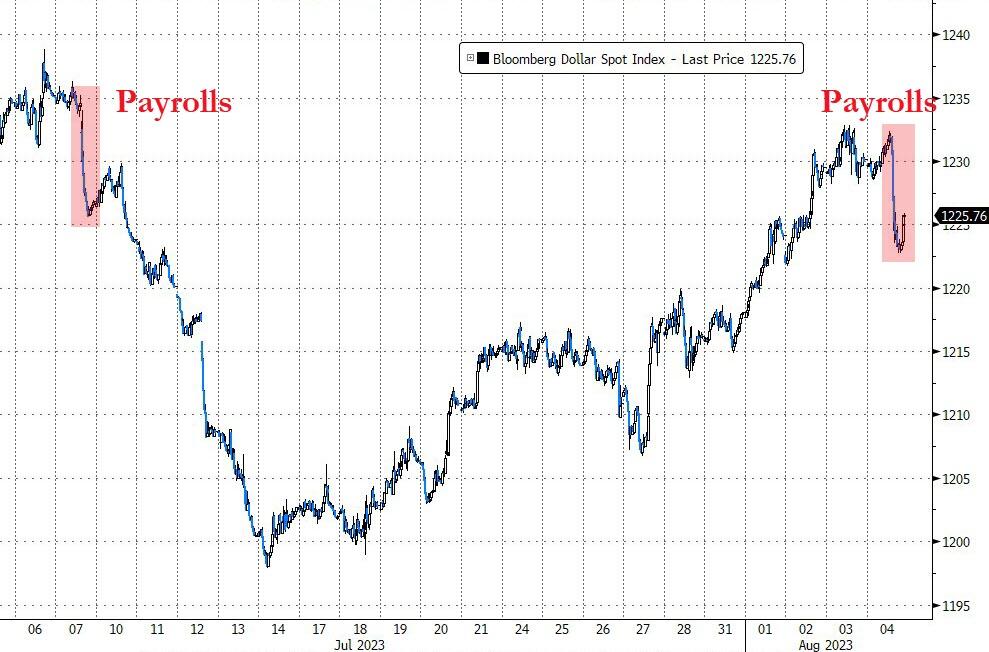
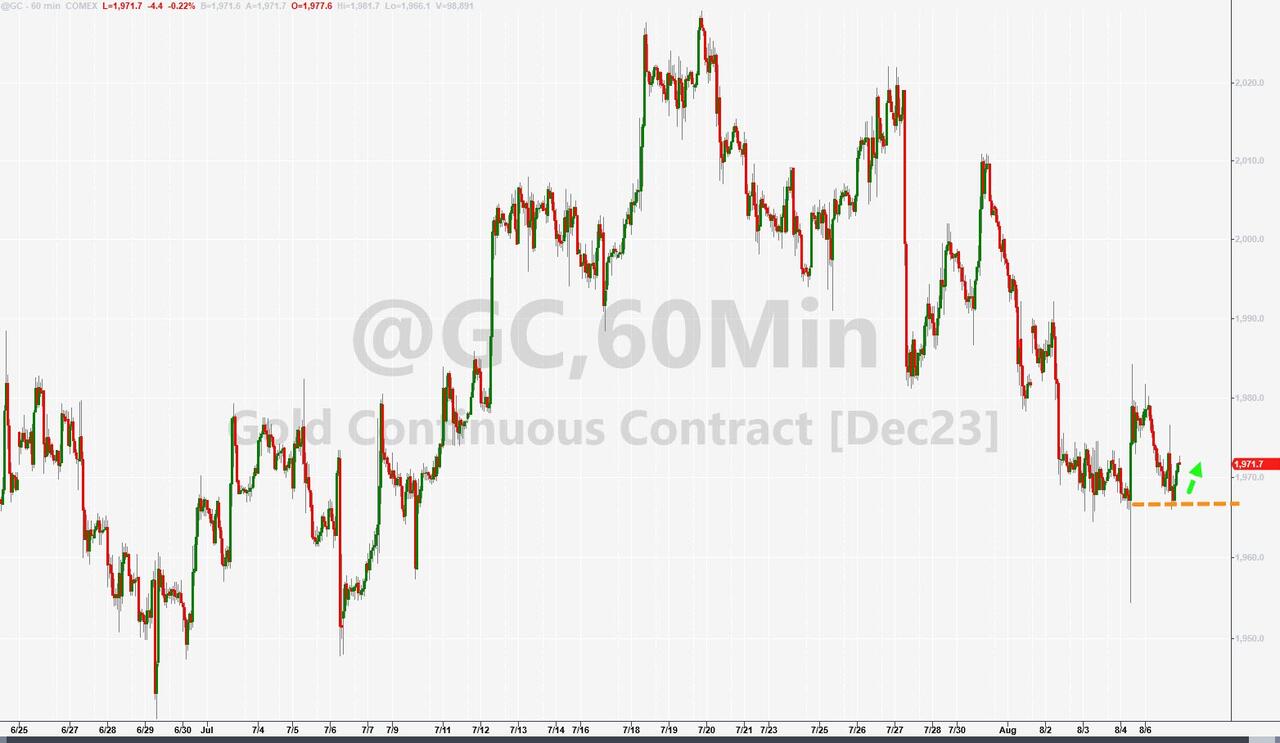
The most shorted stocks continued their downward spiral, and the dollar rallied for the third week in a row, although it lost some steam today. Gold benefited from the dollar’s weakness and bounced back, but still finished the week lower.

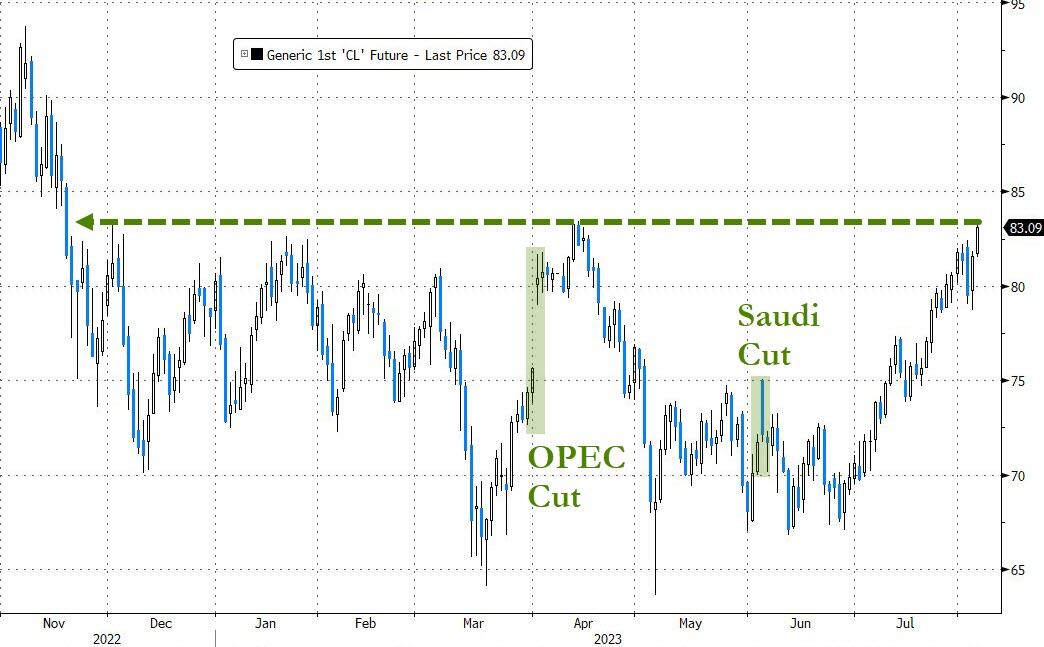
Oil prices soared to their highest level since November, topping $82 per barrel. This is bad news for anyone who hopes that inflation is under control.

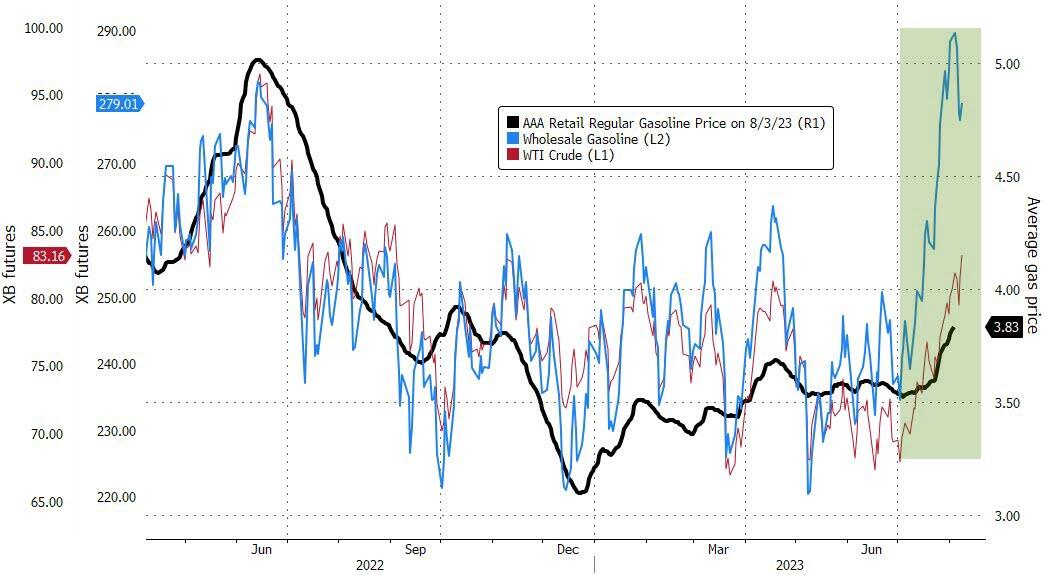
Why?

Because gas prices are going up too. And that brings us to the dreaded “S” word: Stagflation. That’s when you have no growth and high inflation. Not a good combination.

Read More