
ETF Tracker StatSheet
You can view the latest version here.
Tech Split, Wage Spike, Market Dip, Oil Rip: A Mixed Bag for the Economy
[Chart courtesy of MarketWatch.com]
- Moving the markets
Tech giants Amazon and Apple had a split decision in their earnings reports yesterday. Amazon delivered a knockout, while Apple got knocked out. The result? A combined loss of about $30 billion in market value today. Ouch indeed!
Meanwhile, the job market showed some signs of cooling down, but not enough to ease the inflation fears. The payroll report for July missed the mark, but the average hourly wages beat expectations by rising 0.4%. That means workers are getting paid more, but also paying more for everything else.
ZeroHedge had a bleak take on the situation:
According to the headlines, the US added 187K jobs in July, and 268K more people found employment. But a closer look reveals that most of these jobs were part-time, low-paying gigs. In fact, the number of full-time workers dropped by a staggering 585K, while the number of people working multiple jobs rose by 118K. So much for the economic “miracle”!
The Babylon Bee added some humor to the mix: “White House says that the economy is so successful that the average American has twice as many jobs as he had two years ago.” Haha!
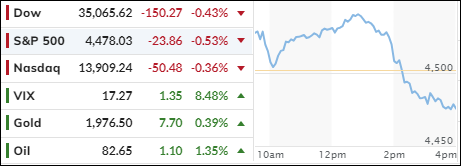
The stock market started off strong, but then hit a wall and crashed hard. The major indexes ended up in the red, with the S&P 500 sinking to its lowest level in three weeks.
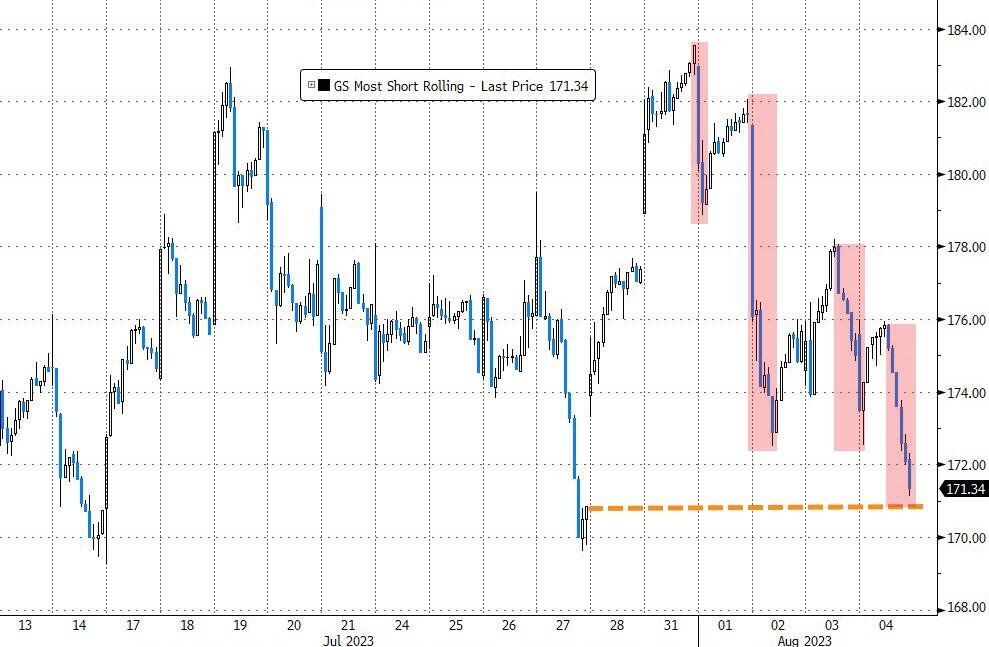
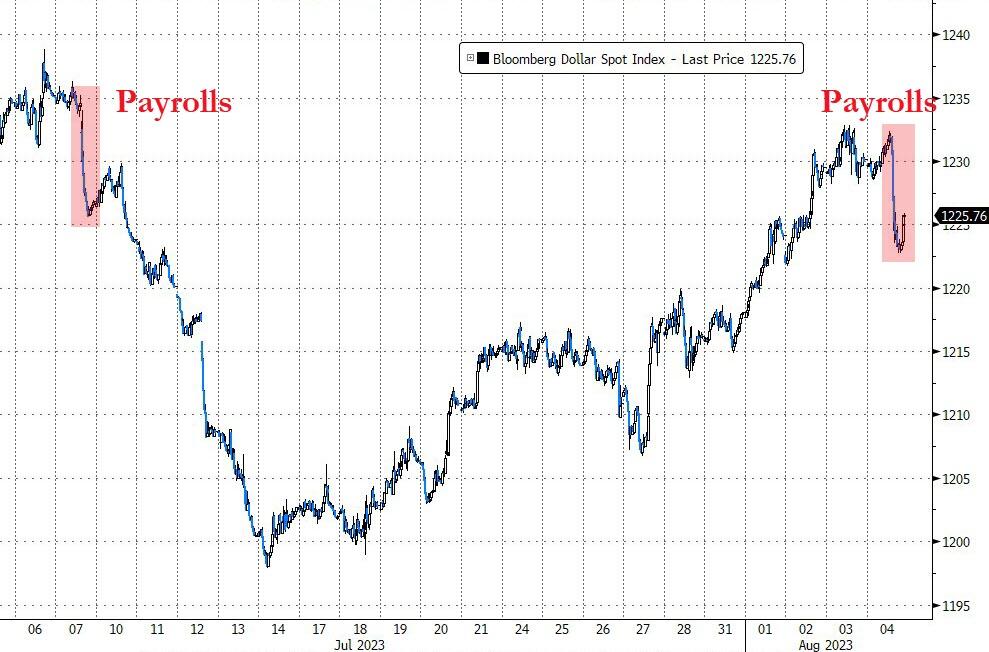
The most shorted stocks continued their downward spiral, and the dollar rallied for the third week in a row, although it lost some steam today. Gold benefited from the dollar’s weakness and bounced back, but still finished the week lower.
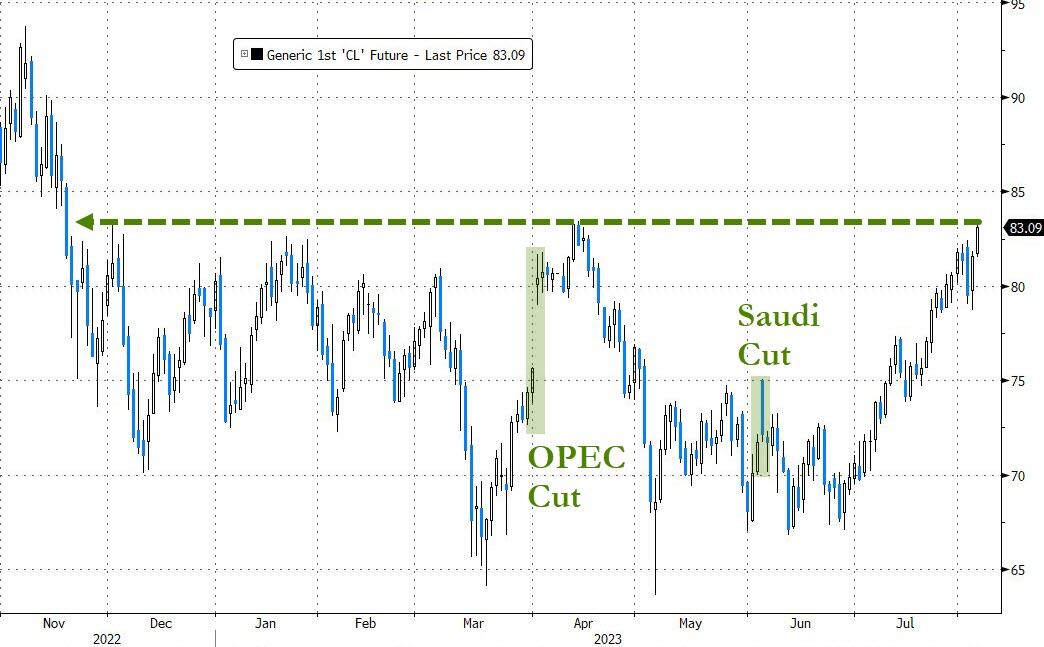
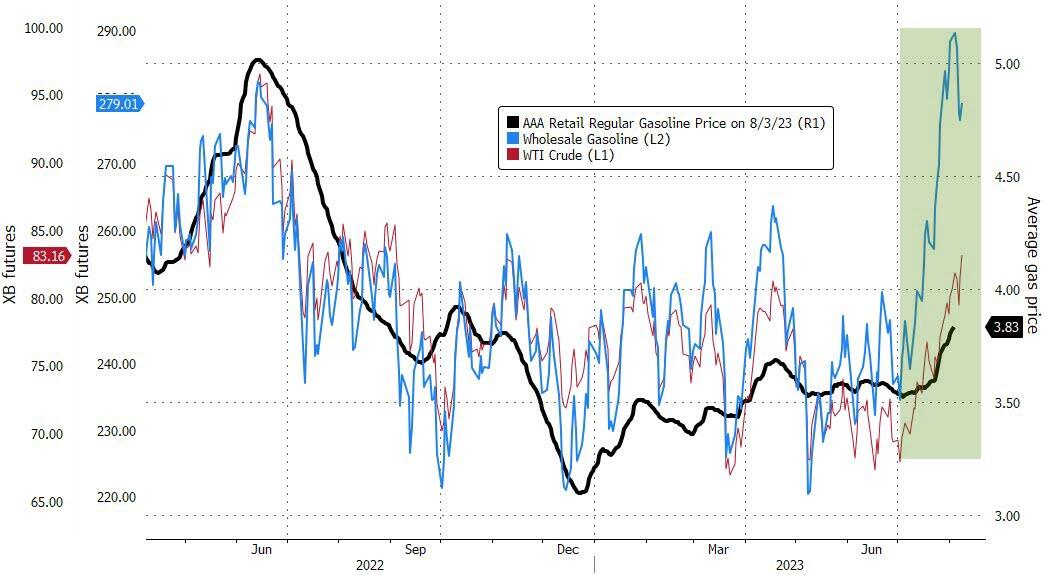
Oil prices soared to their highest level since November, topping $82 per barrel. This is bad news for anyone who hopes that inflation is under control.
Why?
Because gas prices are going up too. And that brings us to the dreaded “S” word: Stagflation. That’s when you have no growth and high inflation. Not a good combination.
- “Buy” Cycle Suggestions
The current Buy cycle began on 12/1/2022, and I gave you some ETF tips based on my StatSheet back then. But if you joined me later, you might want to check out the latest StatSheet, which I update and post every Thursday at 6:30 pm PST.
You should also think about how much risk you can handle when picking your ETFs. If you are more cautious, you might want to go for the ones in the middle of the M-Index rankings. And if you don’t want to go all in, you can start with a 33% exposure and see how it goes.
We are in a crazy time, with the economy going downhill and some earnings taking a hit. That will eventually drag down stock prices too. So, in my advisor’s practice, we are looking for some value, growth and dividend ETFs that can weather the storm. And of course, gold is always a good friend.
Whatever you invest in, don’t forget to use a trailing sell stop of 8-12% to protect yourself from big losses.
- Trend Tracking Indexes (TTIs)
The stock market reversed course in the middle of the day and ended on a negative note. This was the fourth consecutive day of losses for the major indexes.
Our Trend Tracking Indexes (TTIs) also declined, but they stayed above their respective trend lines by the below margins.
This is how we closed 08/04/2023:
Domestic TTI: +4.24% above its M/A (prior close +4.99%)—Buy signal effective 12/1/2022.
International TTI: +6.15% above its M/A (prior close +6.21%)—Buy signal effective 12/1/2022.
All linked charts above are courtesy of Bloomberg via ZeroHedge.
———————————————————-
WOULD YOU LIKE TO HAVE YOUR INVESTMENTS PROFESSIONALLY MANAGED?
Do you have the time to follow our investment plans yourself? If you are a busy professional who would like to have his portfolio managed using our methodology, please contact me directly to get more details.
Contact Ulli