How Long Can Stocks Defy Gravity Amid Geopolitical And Economic Risks?

Ulli Market Commentary Contact

[Chart courtesy of MarketWatch.com]

  1. Moving the markets

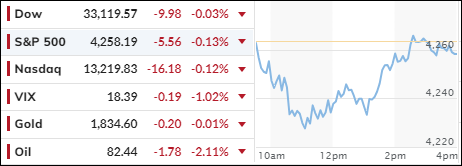
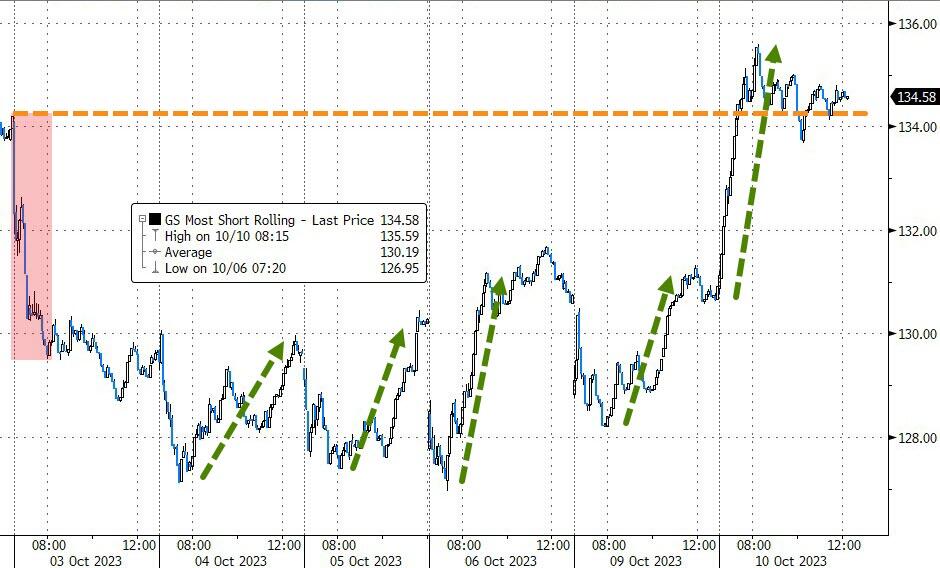
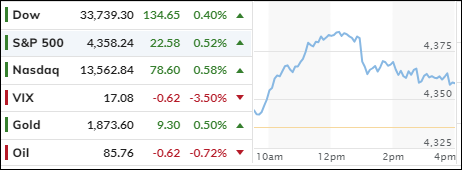
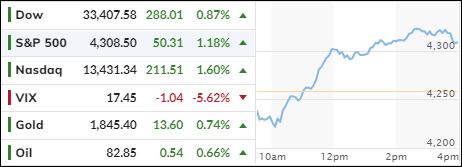
U.S. stocks went up on Tuesday, thanks to lower Treasury yields and a short squeeze.

Wall Street was busy assessing the geopolitical risks of the Israel-Hamas war, which has been going on for longer than some Netflix shows.

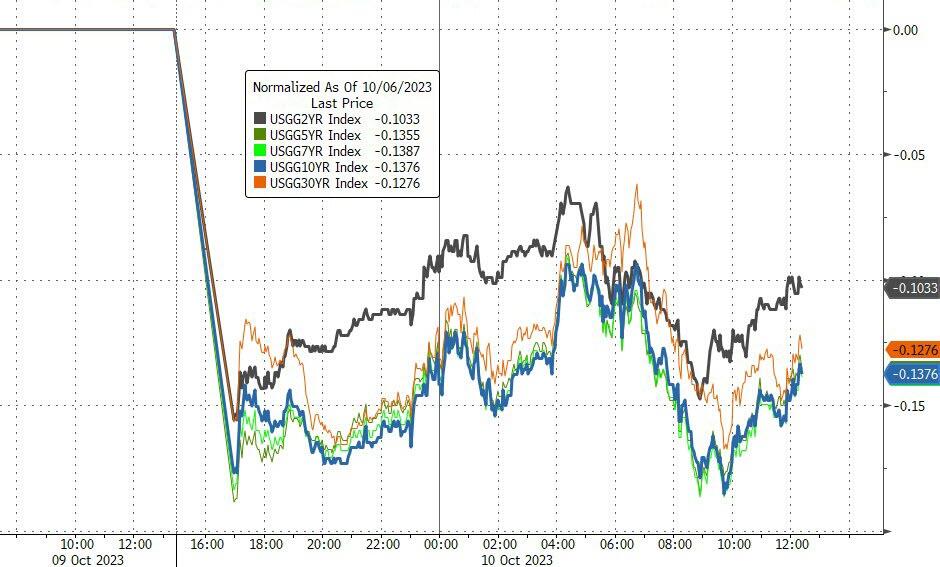
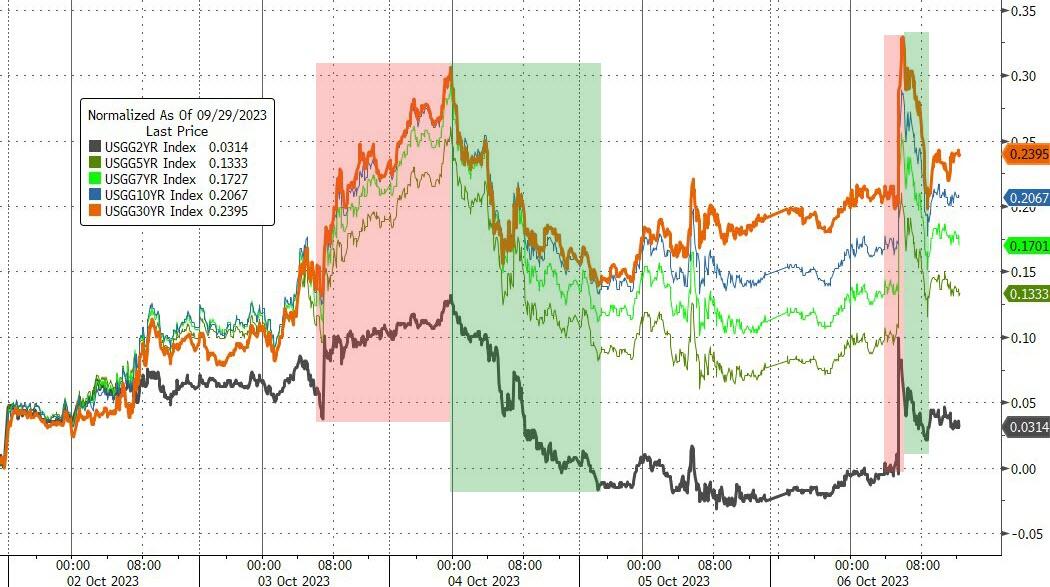
The 10-year Treasury yield ended down 15 basis points to 4.65%, as investors flocked to the safe haven of bonds amid the conflict. The bond market was closed on Monday for Columbus Day, so this was its first chance to react to the war.

The drop in yields gave stocks a boost, as Wall Street was worried about the recent spike in interest rates. Investors may also be ignoring the geopolitical risks caused by the conflict, helped by Friday’s allegedly strong September jobs report and optimism ahead of a bunch of earnings this week.

However, there was a buzzkill in the form of Paul Tudor Jones, the legendary hedge fund manager who said that he doesn’t like stocks right now. He prefers bitcoin and gold, as he thinks the US Treasury can’t protect investors like it used to.

I agree with him, and our Trend Tracking Indexes (TTIs) confirm the uncertainty and instability we are in. The bear market rally of the last few days has only helped investors recover some of their losses, which they suffered after our Sell signal on 9/22/23.

As I write this, I think the market may go up another 1-1.25% before hitting resistance and reversing. The inflation reports tomorrow, and Thursday (PPI and CPI), will likely affect market direction.

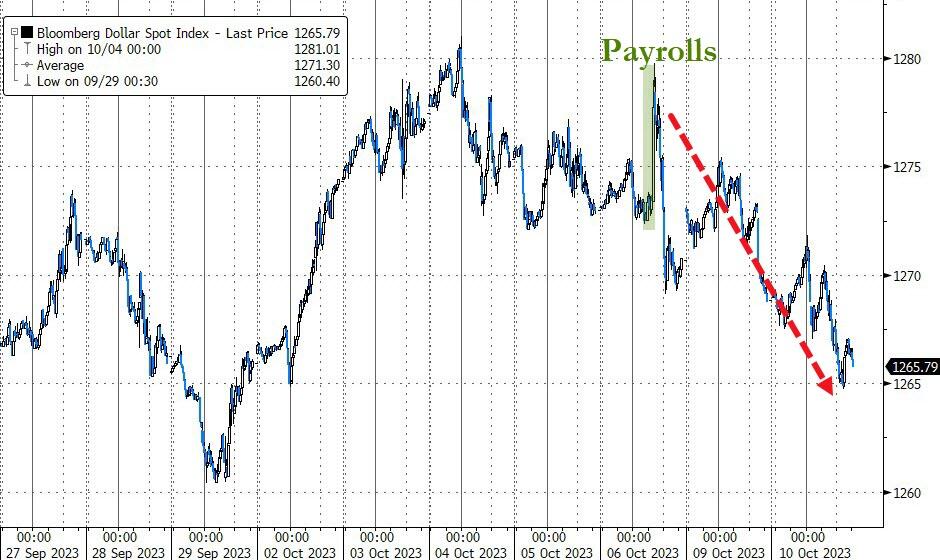
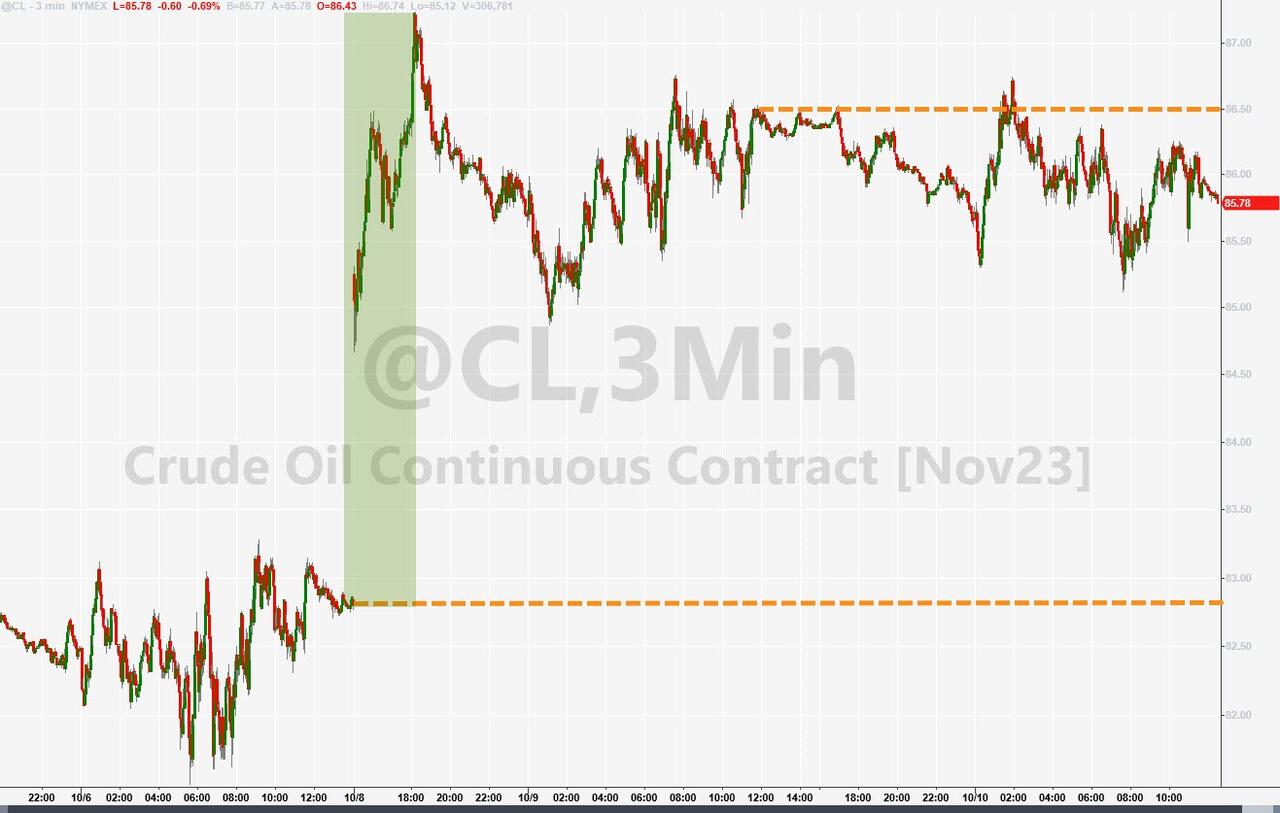
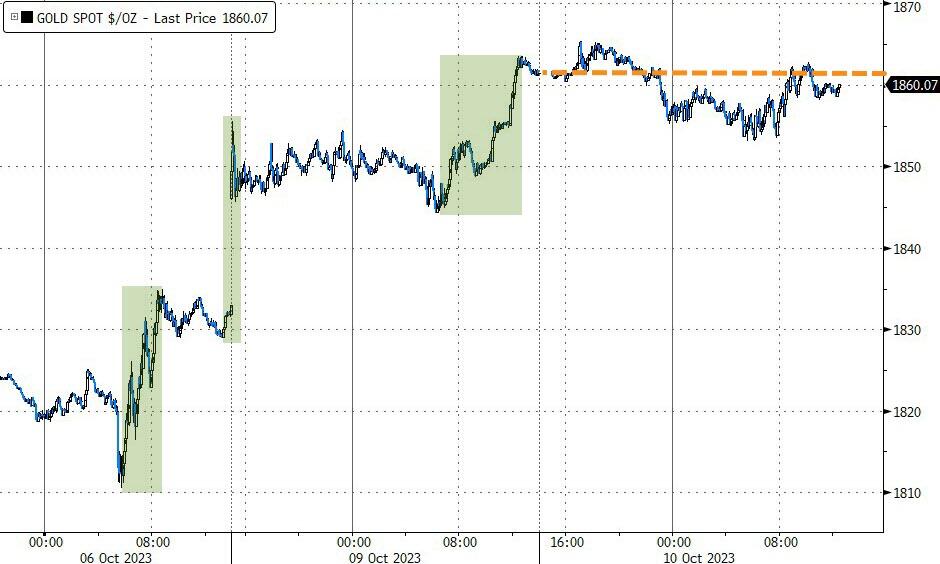
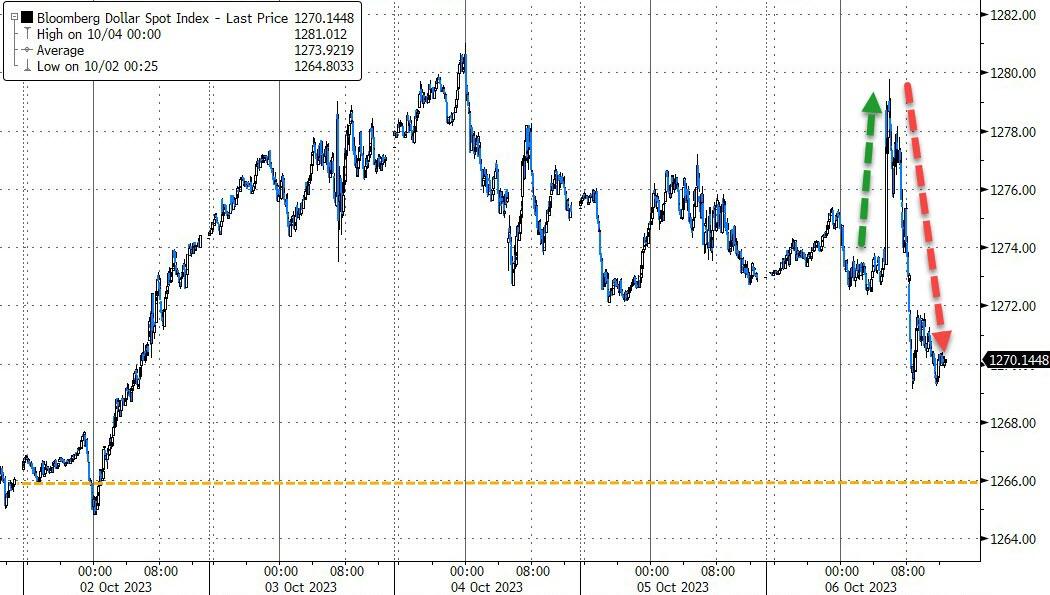
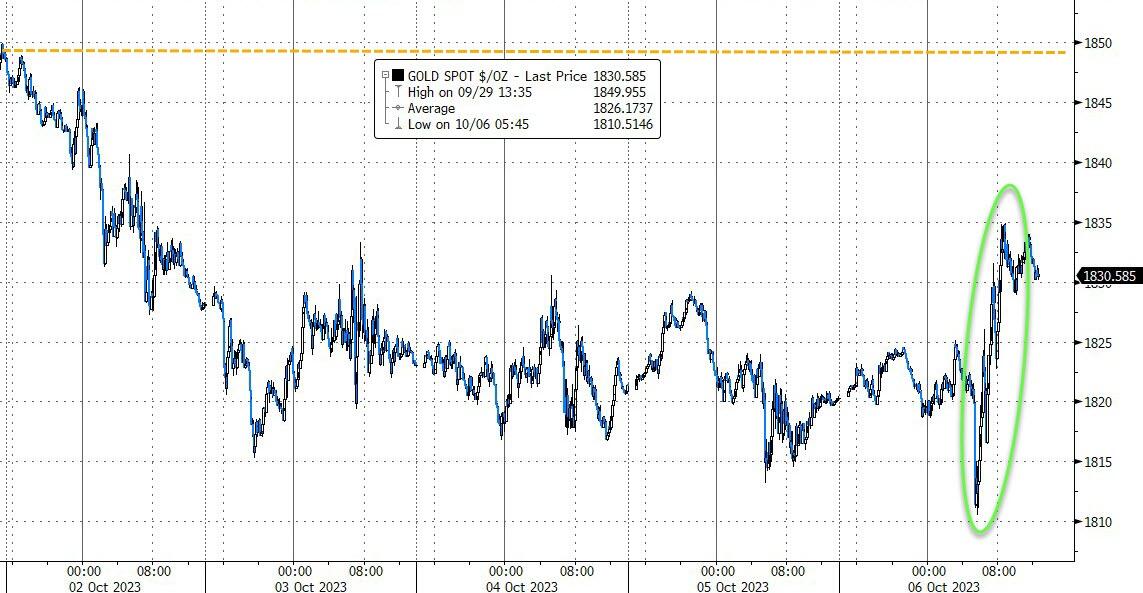
The dollar continued to slide, oil prices were slightly lower, and gold was flat but holding on to its gains.

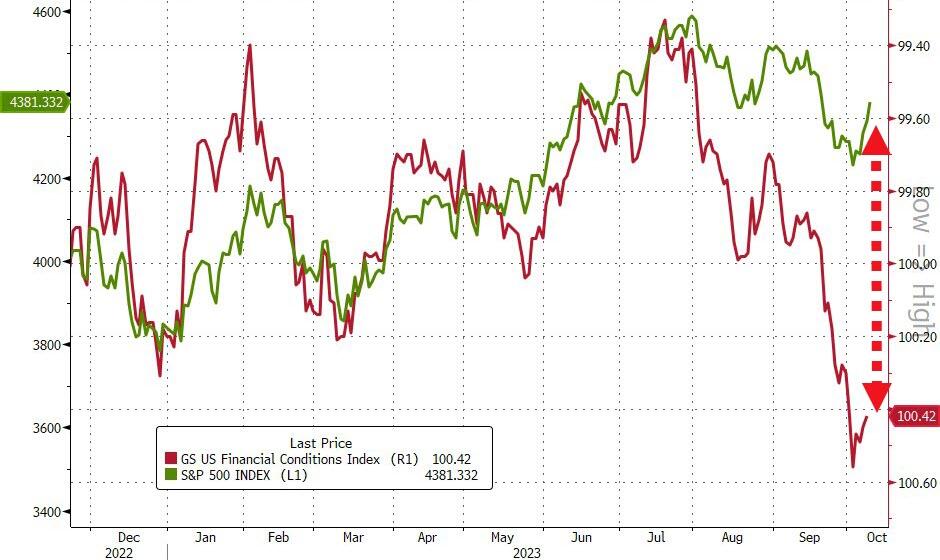
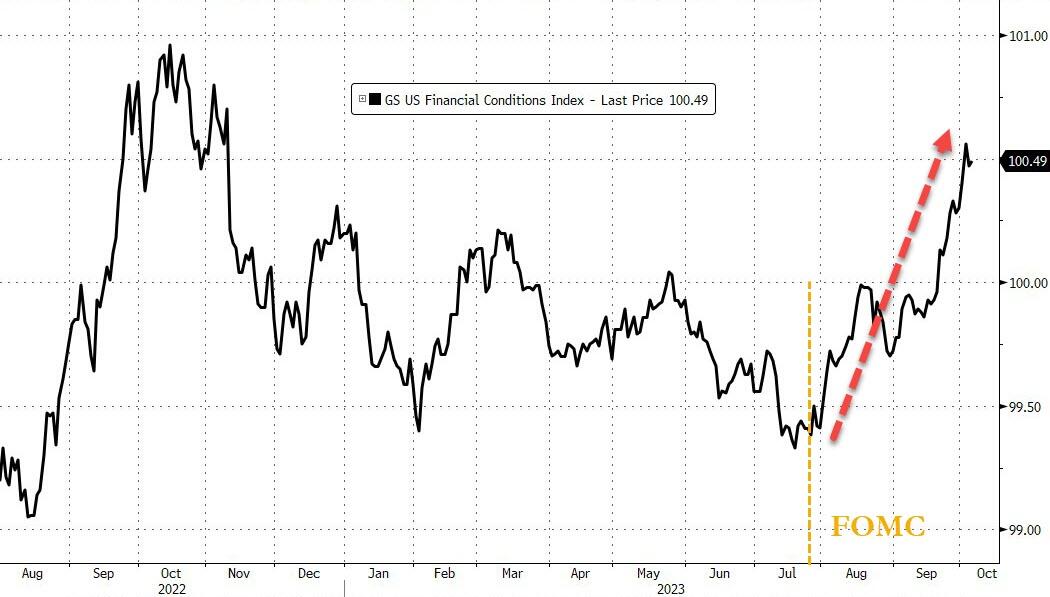
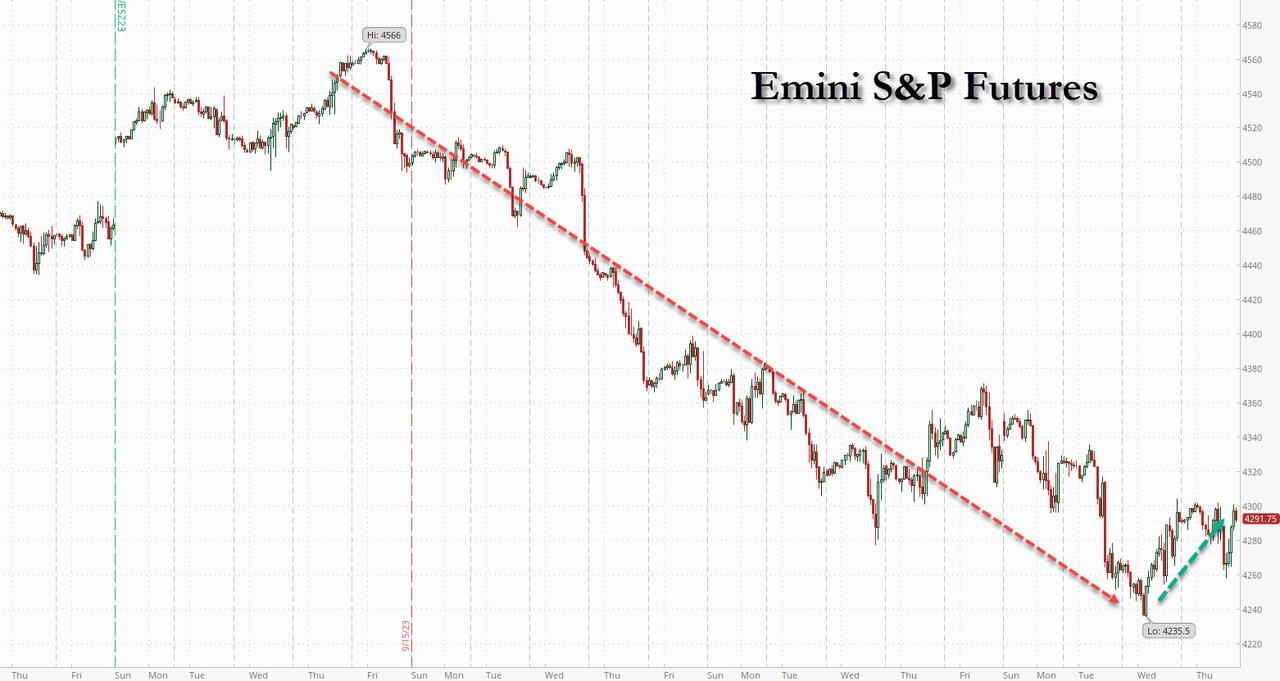
Looking at this chart, it seems that financial conditions are too tight for stocks to be this high. Or is this just a preview of what’s coming soon?

Read More
Stocks Defy Gravity As Bond Market Snoozes And Fed Sings

Ulli Market Commentary Contact

[Chart courtesy of MarketWatch.com]

  1. Moving the markets

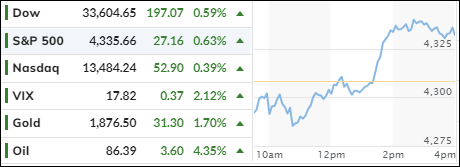
Monday was a day of surprises for the stock market, as it bounced back from a morning slump despite the escalating violence in the Middle East. The bond market took a holiday, leaving investors in the dark about the impact of the Israel-Hamas conflict on interest rates.

The major indexes started the day in the red, with the Dow dropping 154 points at its lowest point, and the S&P 500 and the Nasdaq losing 0.6% and 1.15%, respectively. But by the end of the day, they had recovered their losses and even posted some decent gains.

The market was rattled by the news that Hamas had launched a ground invasion of Israel on Saturday, catching the Israeli army off guard. The conflict could have implications for the energy market, as some analysts predicted a spike in oil prices, but others downplayed its significance. The conflict also added to the market’s anxiety about inflation and rising interest rates, which have been plaguing investors for months.

But what turned the tide for the market was a chorus of Fed officials who hinted that the Fed might be done with raising rates for now. They echoed what SF Fed President Mary Daly said on Friday, that the high 10-year Treasury yields have already done the Fed’s work of tightening financial conditions. Hmm…

If that’s true, and that’s a big if, then we might see a reversal of the recent trend in the market. Rate cuts could be back on the table, and that could boost everything from gold to stocks to crypto. But how likely is that scenario? And how long will it last?

That’s the question that traders will have to answer in the coming days. And depending on their answer, we might find ourselves back in domestic equities again—or not.

Read More

ETFs On The Cutline – Updated Through 10/06/2023

Ulli ETFs on the Cutline Contact

Do you want to know which ETFs are hot and which ones are not? Then you need my High-Volume ETF Cutline report. It tells you how close or far each of the 311 ETFs I follow is from its long-term trend line (39-week SMA). These are the ETFs that trade more than $5 million a day, so they are not some obscure funds that nobody cares about.

The report is split into two parts: The winners that are above their trend line (%M/A), and the losers that are below it. The yellow line is the line of shame that separates them. You can see how many ETFs are in each group and how they have changed since the last report (70 vs. 63 current).

Take a peek:

The HV ETF Master Cutline Report

If you are confused by some of the terms we use, don’t panic. I have a helpful Glossary of Terms for you.

If you want to learn more about the Cutline method and how it can make you rich (or at least less poor), read my original post here.

ETF Tracker Newsletter For October 6, 2023

Ulli ETF Tracker Contact

ETF Tracker StatSheet          

You can view the latest version here.

TRADERS IGNORE BOND YIELDS AND JOBS REPORT, LIFT STOCKS FROM LOWS

[Chart courtesy of MarketWatch.com]

  1. Moving the markets

The markets had a crazy day, as traders shrugged off soaring bond yields and the stellar jobs report and pushed the major indexes from the red to the green. Maybe they were just buying the dip, or maybe they were feeling optimistic, but they ignored the bad news that should have spooked them.

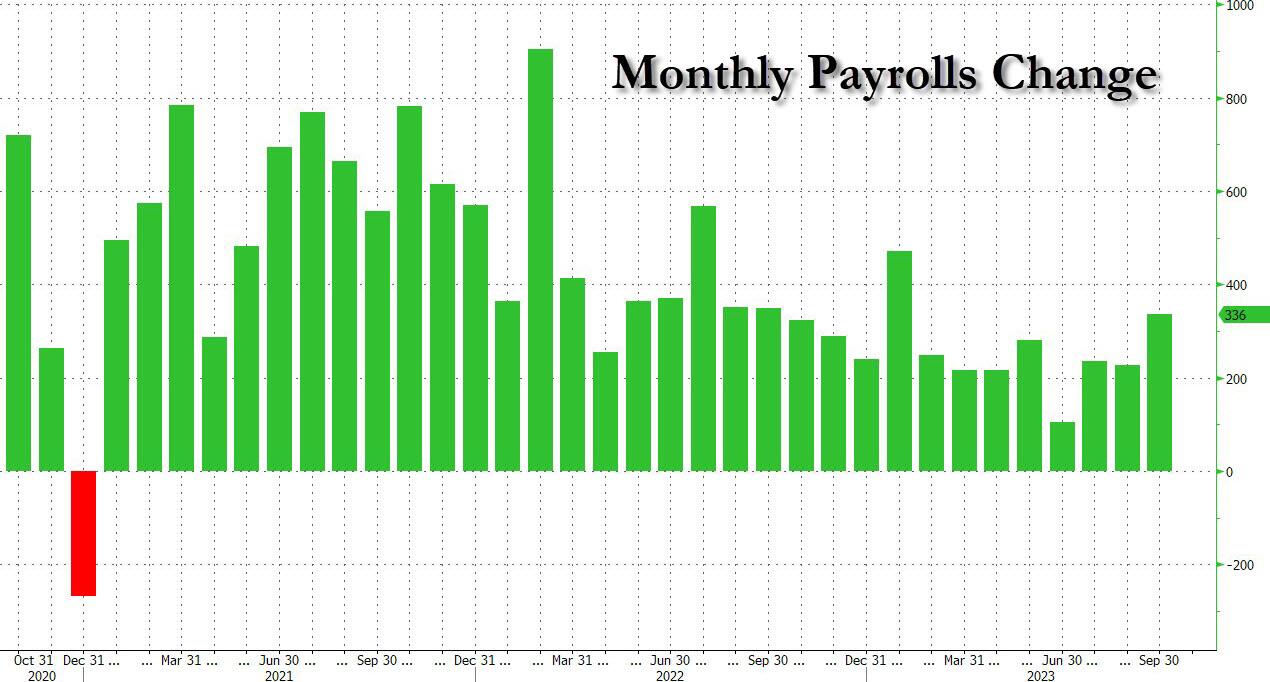
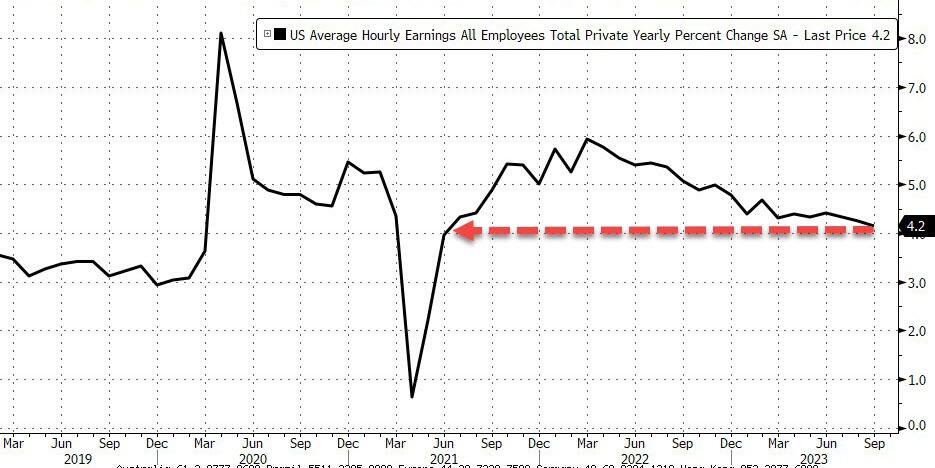
The U.S. economy added a jaw-dropping 336,000 jobs in September, the most since January. Economists expected only 170,000. But wages grew less than expected last month, so maybe it wasn’t all roses.

What sparked the turnaround?

Well, some traders might have smelled a rat in the jobs number. Remember how most of this year’s economic data was revised down a month later, when no one was paying attention? Maybe they thought that September was too good to be true, especially when many companies were closed due to labor strikes (i.e., people not working).

How did the US add 336K jobs, double the consensus, in such a month? It sounds fishy, doesn’t it?

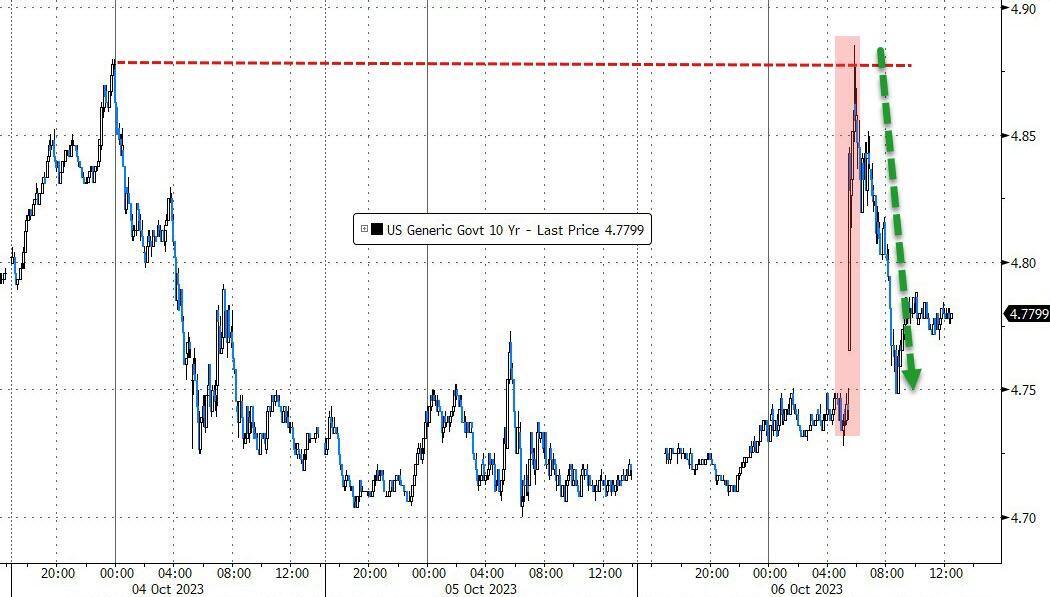
The 10-year Treasury yield jumped more than 12 basis points to trade near a 16-year high, but it retreated at the end and closed at 4.79%. Friday’s jobs report made investors worry that the Fed will have to keep rates high for longer to fight inflation.

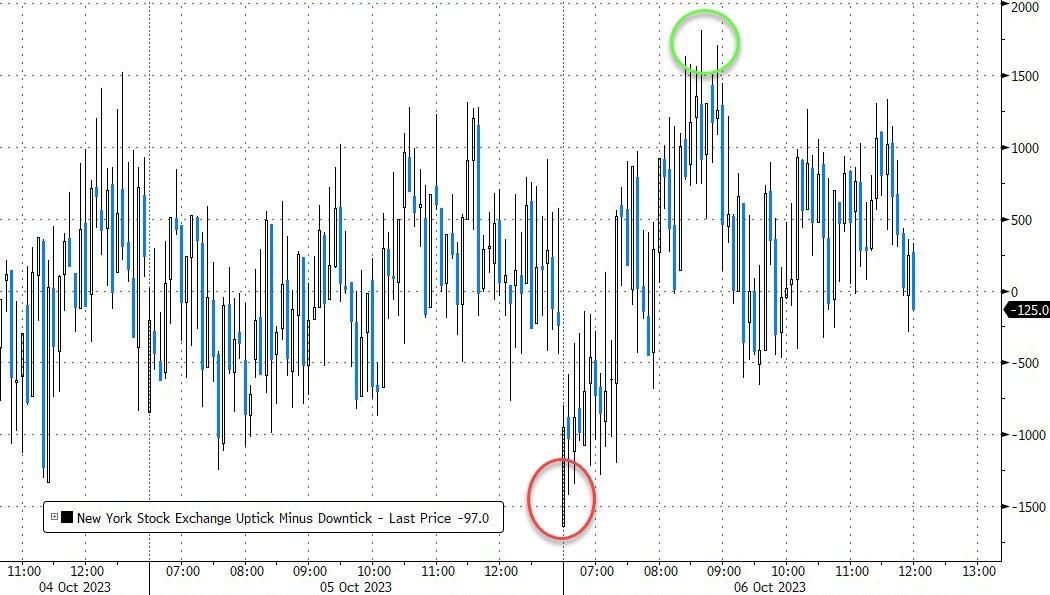
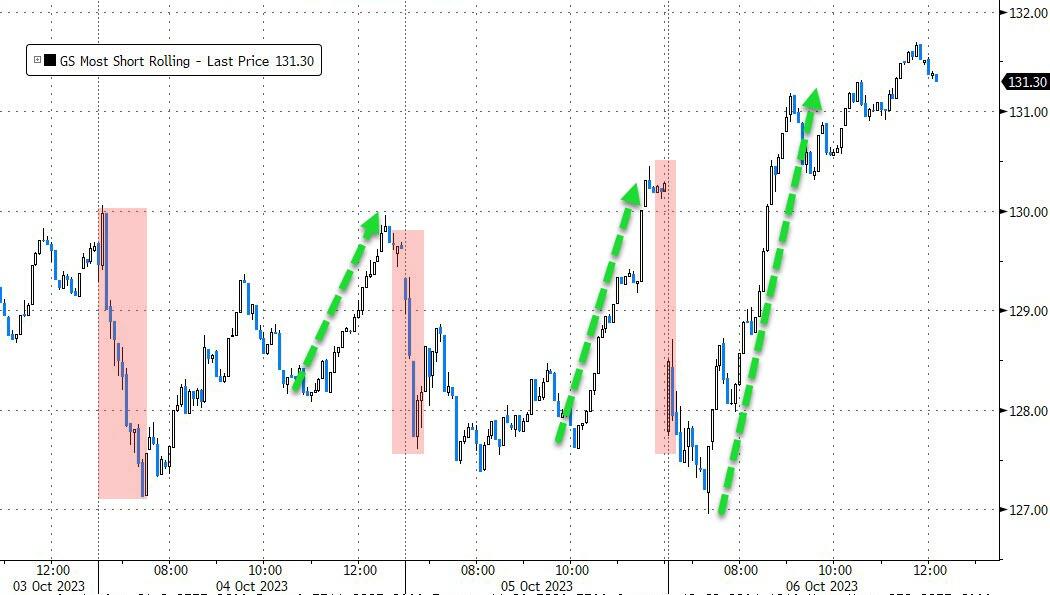
But others doubted the report and cut their losses in bonds and stocks, as the S&P 500 barely closed in the green for the week, thanks to a huge buy order and a ‘massive’ short squeeze. The 336K number is huge and means the Fed could easily hike another 25bp and stay high for a long time.

Rates will keep rising and that will hurt stocks, especially with tighter financial conditions. Those traders who bet that the Fed “has to” lower rates, and bought bonds too soon, saw the 20-year bond fund TLT lose another 1.2% today. TLT has dropped about 15% YTD, after a whopping 33% plunge in 2022. So much for bonds being safe.

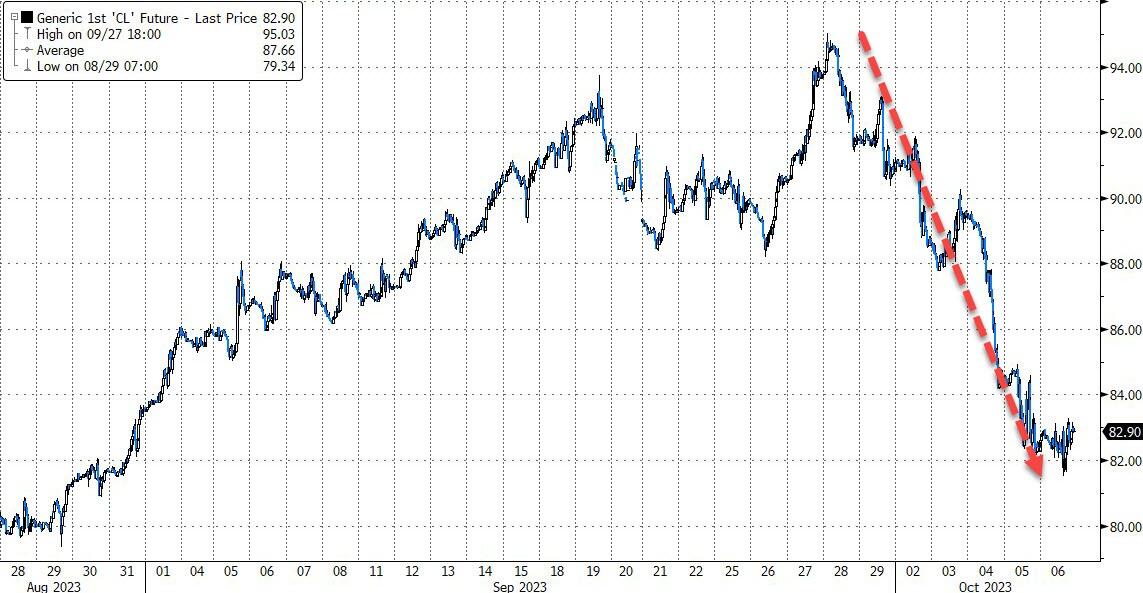
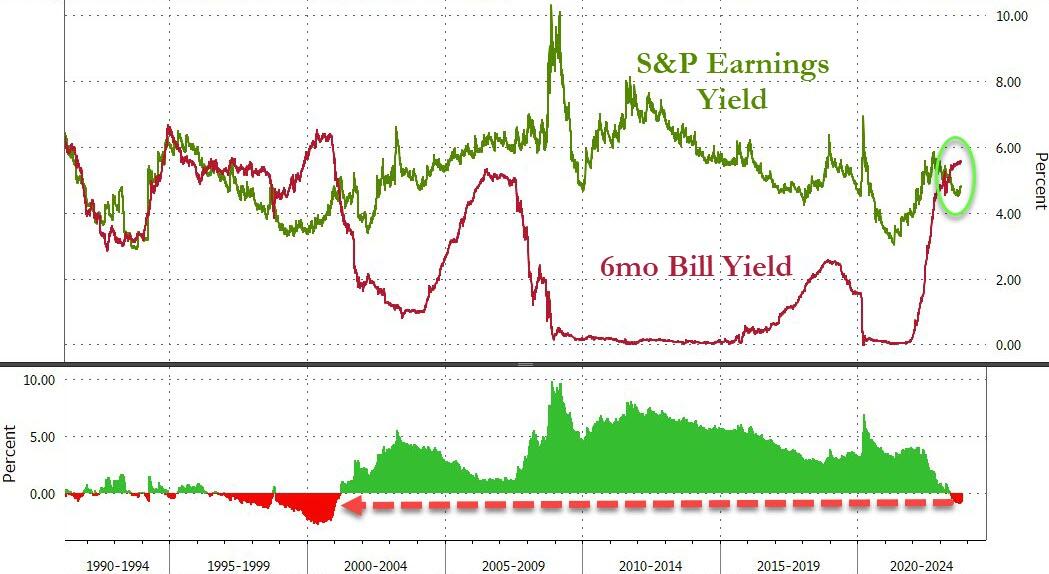
Bond yields spiked, the dollar rose for the week, gold rebounded but ended lower for the week, as crude oil fell but stayed above $82. As ZeroHedge pointed out, this year, S&P 500 companies are facing the biggest rise in borrowing costs since 2006.

Lending money to the US government at 5%-plus is tempting for investors who don’t like risk.

After all, why gamble on corporate performance when you can get a risk-free return in T-Bills?

Read More

Weekly StatSheet For The ETF Tracker Newsletter – Updated Through 10/05/2023

Ulli ETF StatSheet Contact

ETF Data updated through Thursday, October 5, 2023

How to use this StatSheet:

  1. Out of the 1,800+ ETFs out there, I only pick the ones that trade over $5 million per day (HV ETFs), so you don’t get stuck with a lemon that nobody wants to buy or sell.
  1. Trend Tracking Indexes (TTIs)

These are the main indicators that tell you when to buy or sell Domestic and International ETFs (section 1 and 2). They do that by comparing their position to their long-term M/A (Moving Average). If they cross above, and stay there, it’s a green light to buy. If they fall below, and keep going, it’s a red light to sell. And to make sure you don’t lose your shirt if things go south, I also use a 12% trailing stop loss on all positions in these categories.

  1. All other investment areas don’t have a TTI and should be traded based on the position of each ETF relative to its own trend line (%M/A). That’s why I call them “Selective Buy.” In other words, if an ETF goes above its own trend line, you can buy it. But don’t forget to use a trailing sell stop of 12%, or less if you’re feeling nervous.

If some of these words sound like Greek to you, please check out the Glossary of Terms and new subscriber information in section 9.

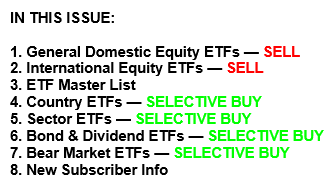
  1. DOMESTIC EQUITY ETFs: SELL— since 09/22/2023

Click on chart to enlarge

This is our main compass, the Domestic Trend Tracking Index (TTI-green line in the above chart). It has now broken below its long-term trend line (red) by -4.59% and has moved into “Sell” mode effectively 9/22/2023.

Read More

Will The Jobs Report Be A Trick Or A Treat For The Market?

Ulli Market Commentary Contact

[Chart courtesy of MarketWatch.com]

  1. Moving the markets

The major indexes tiptoed on Thursday, waiting for the big reveal of the jobs data on Friday that could make or break interest rate policy.

Weekly initial jobless claims were 207,000 for the week ending Sept. 30, a measly 2,000 more than the previous week. Economists had predicted 210,000. The tiny bump in jobless claims was no surprise to the Street, but it dashed the hopes of some investors who wanted to see some signs of a labor market meltdown and a stop to the rising rates that are killing the stocks.

The 10-year Treasury yield jumped a bit after the jobless claims report before crawling back down. It ended the day at 4.713% and stayed flat during the session.

On Friday, economists expect non-farm payrolls for September to show a 170,000 increase, down from a 187,000 boost in August. Investors are not rooting for a recession, but they are crossing their fingers for some labor market slack that would make the Federal Reserve think twice about hiking rates again and put an end to the soaring Treasury yields that hit 16-year highs.

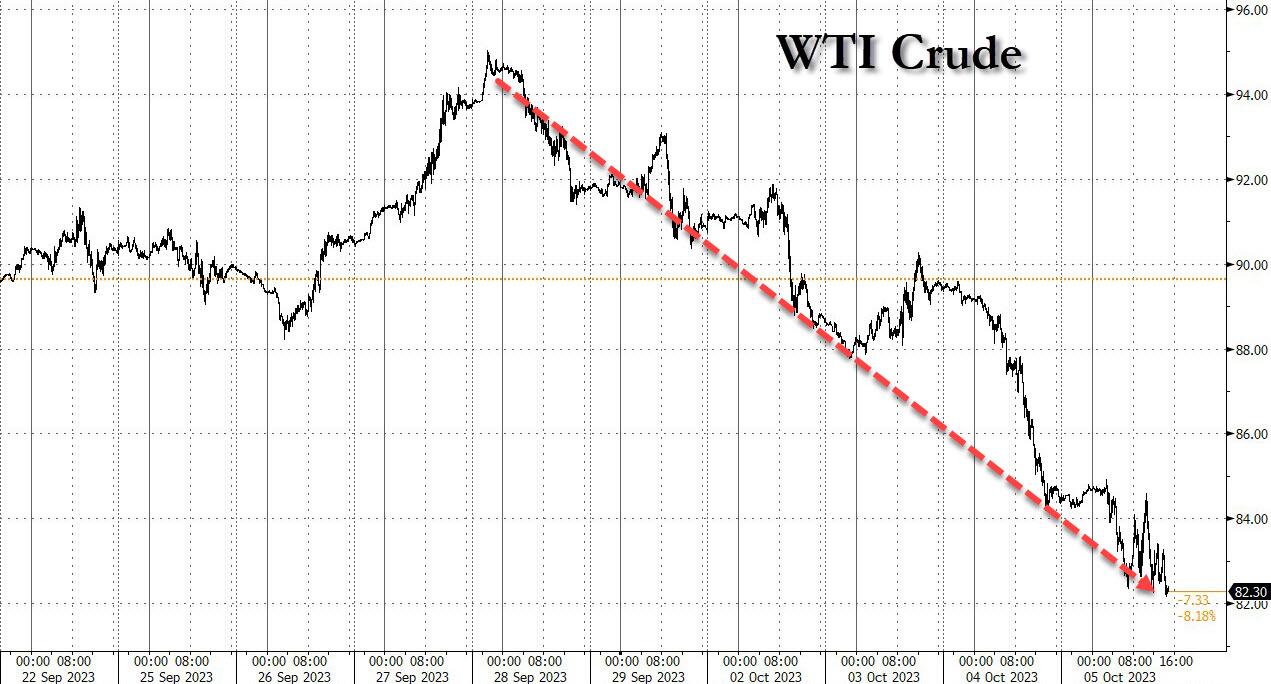
The crude oil moves in the past week have been a circus act, with WTI soaring above $95 last Thursday only to nosedive to $82 today, after tumbling by more than 5% yesterday, the biggest one day drop since last September’s panic attack. There are a few explanations for why oil has tanked so hard, such as weak demand, crowded bets on oil, and geopolitical worries. But who really knows…

The S&P 500 had a wild ride today, but in the end barely moved from yesterday’s turnaround. Still, the index has some work to do before getting back on track with a bullish trend.

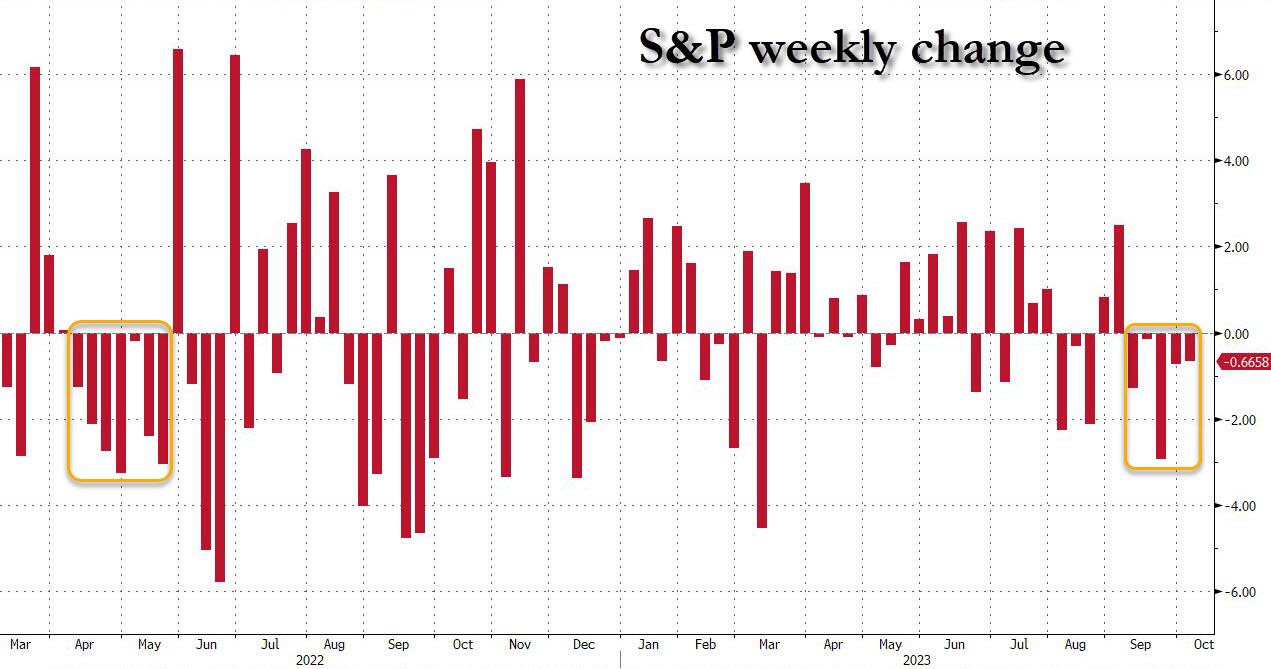
That said, unless we see a huge flop in the jobs report and a plunge tomorrow, it’s hard to imagine how stocks will manage to lift the S&P by 0.7% on Friday and erase what is likely to be another weekly loss for stocks, the fifth in a row, and the longest such streak since May 2022.

Will the payroll report save or sink the market tomorrow? Stay tuned…

Continue reading…

2. “Buy” Cycle (12/1/22 to 9/21/2023)

The current Domestic Buy cycle began on December 1, 2022, and concluded on September 21, 2023, at which time we liquidated our holdings in “broadly diversified domestic ETFs and mutual funds”.

Our International TTI has now dipped firmly below its long-term trend line, thereby signaling the end of its current Buy cycle effective 10/3/23.

We have kept some selected sector funds. To make informed investment decisions based on your risk tolerance, you can refer to my Thursday StatSheet and Saturday’s “ETFs on the Cutline” report.

Considering the current turbulent times, it is prudent for conservative investors to remain in money market funds—not bond funds—on the sidelines.

3. Trend Tracking Indexes (TTIs)

The major indexes fluctuated throughout the day and closed with a slight loss.

Our Trend Tracking Indexes (TTIs) showed mixed results, with the Domestic TTI declining and the International TTI rising slightly. These trends did not change our bearish outlook on the market.

This is how we closed 10/5/2023:

Domestic TTI: -4.59% below its M/A (prior close –4.32%)—Sell signal effective 9/22/2023.

International TTI: -2.54% below its M/A (prior close -2.88%)—Sell signal effective 10/3/2023.

All linked charts above are courtesy of Bloomberg via ZeroHedge.