Market Fizzles Out As Economic Data Sends Mixed Signals

Ulli Market Commentary Contact

[Chart courtesy of MarketWatch.com]

  1. Moving the markets 

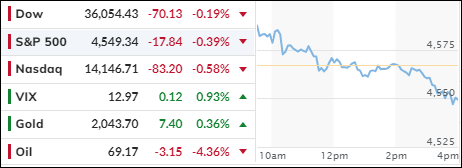
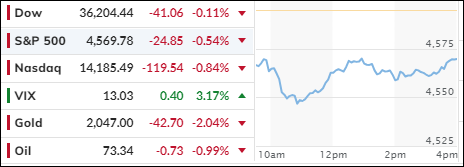
The stock market had a roller-coaster ride on Wednesday, as investors weighed the mixed signals from the latest economic data. On one hand, inflation seemed to be cooling, as labor costs fell, and productivity rose more than expected. On the other hand, the job market showed signs of slowing down, as private payrolls grew less than forecasted. These data points set the stage for the upcoming jobs report on Friday, which could have a big impact on the Fed’s policy decisions.

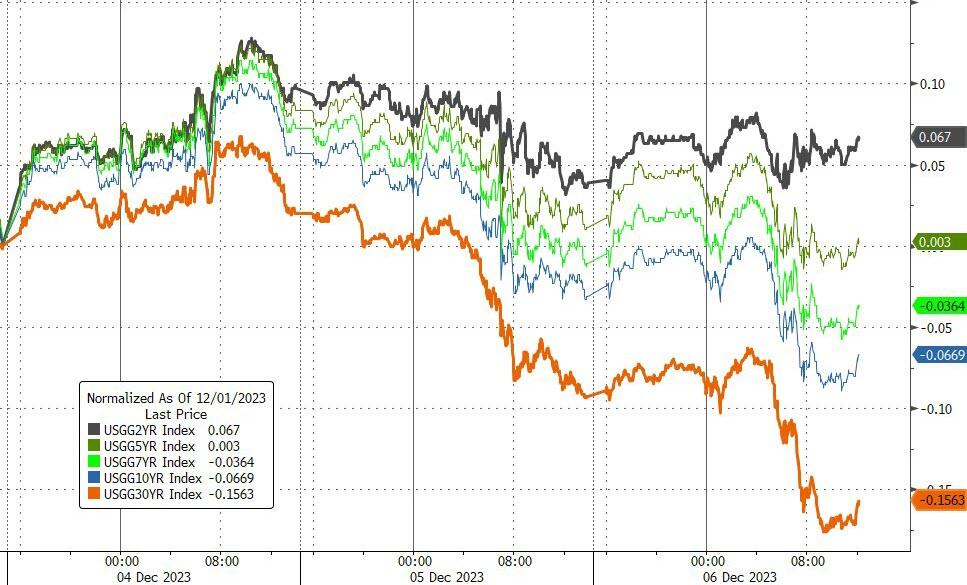
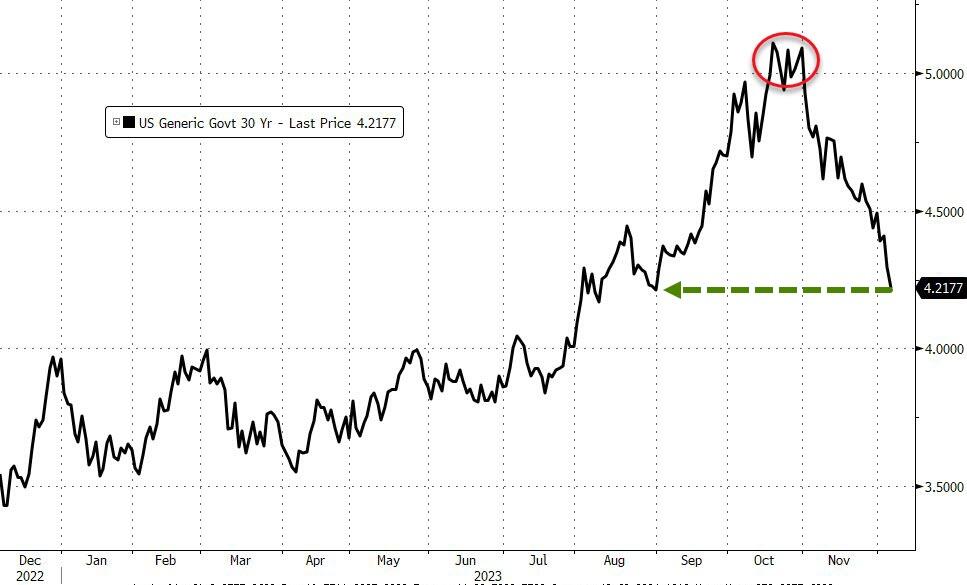
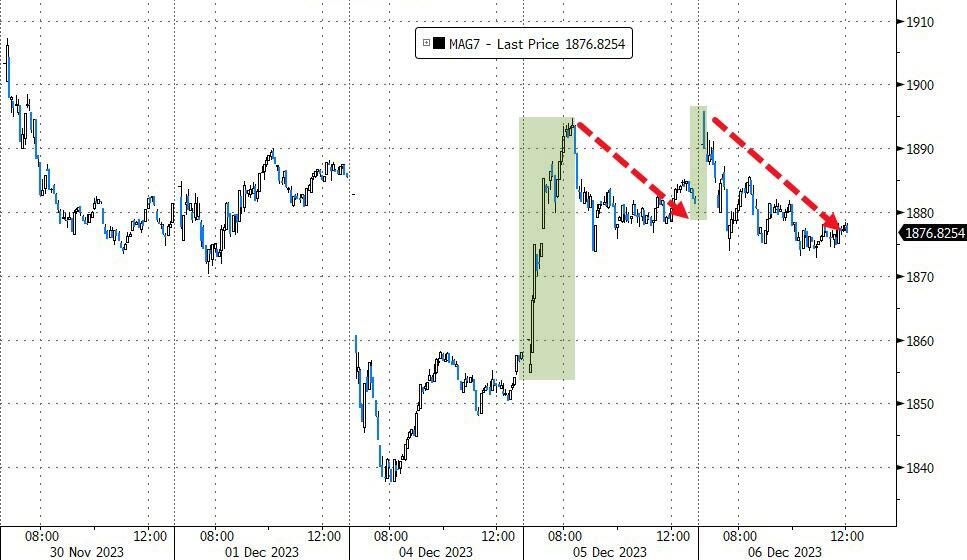
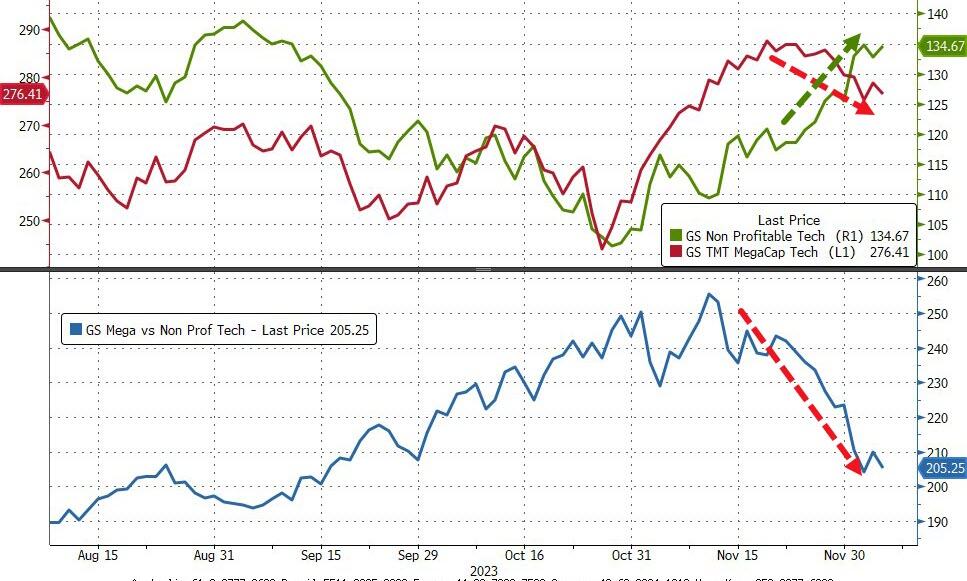
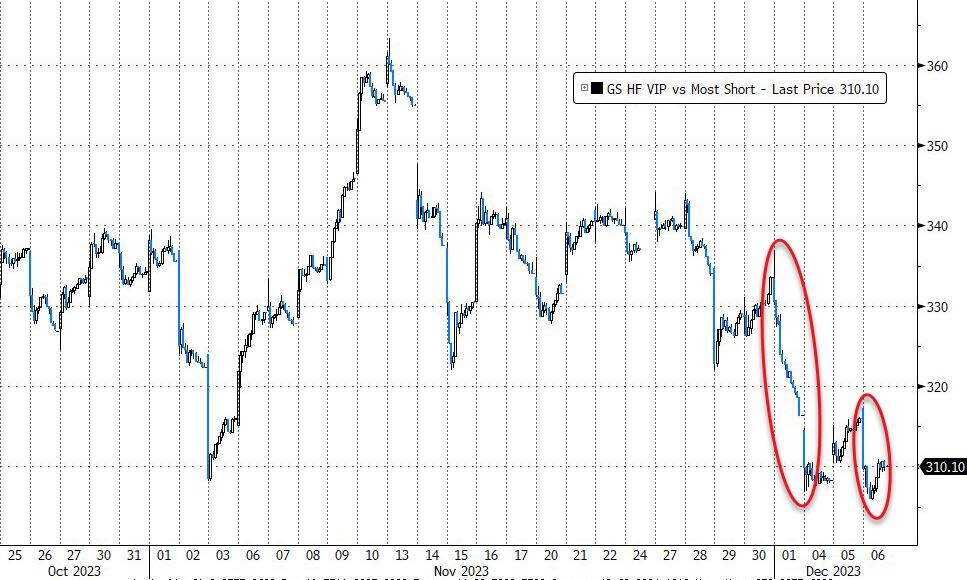
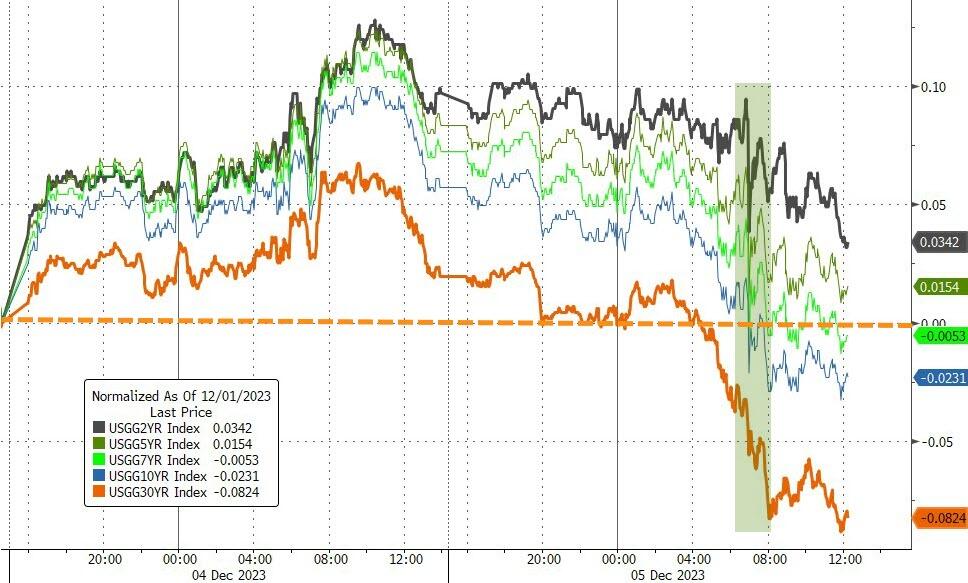
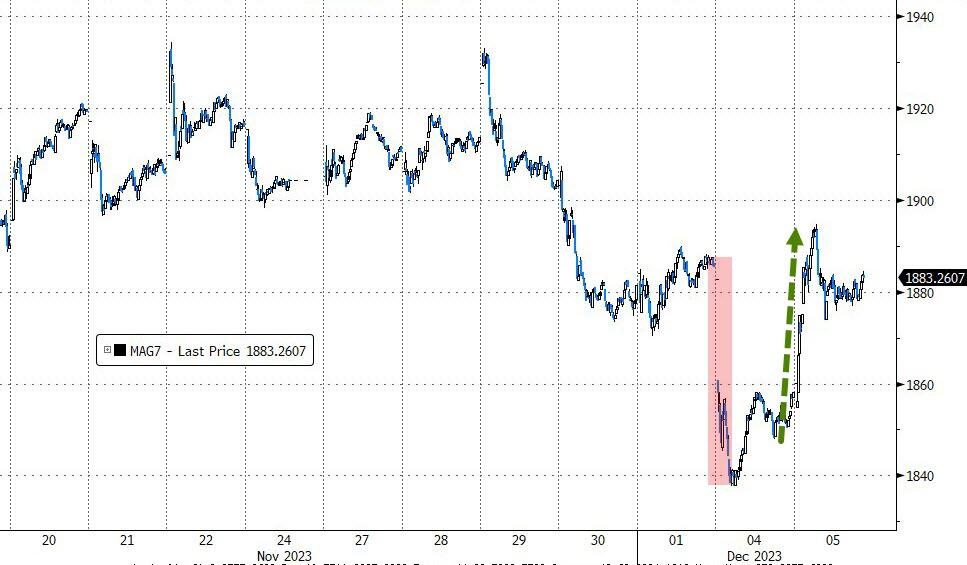
The market opened higher, boosted by lower inflation pressure and higher productivity growth. However, the rally faded as bond yields diverged, with the long-term rates dropping to their lowest level since August. The tech sector also lost steam, as the so-called “Magnificent 7” stocks gave up their early gains, while the unprofitable tech stocks continued to surge. The short-squeeze attempts failed to lift the market, and the major indexes ended the day in the red.

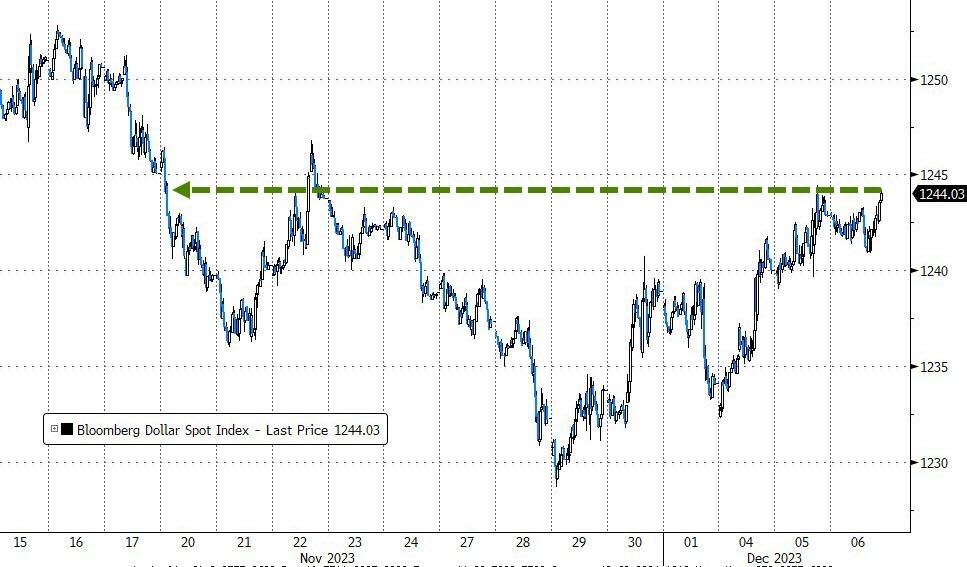
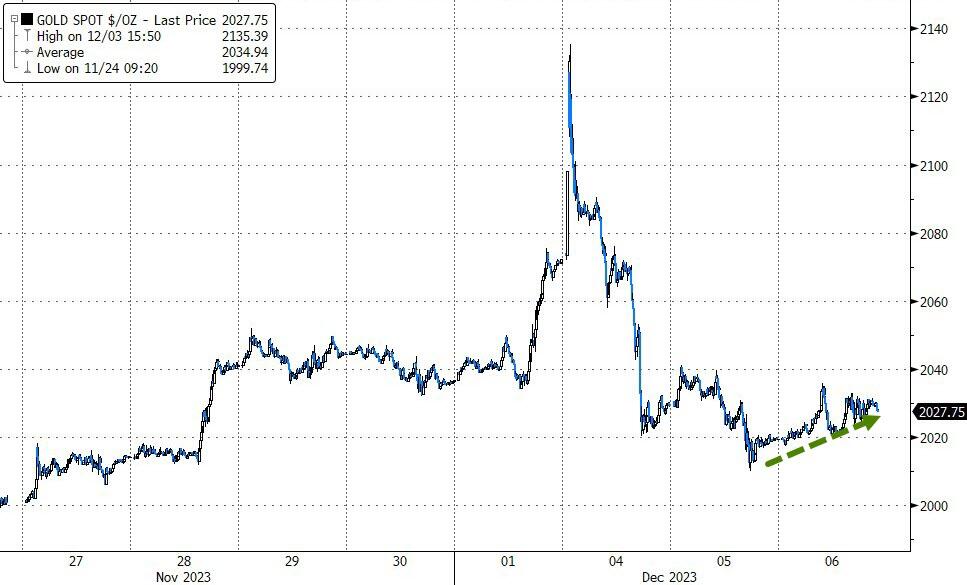
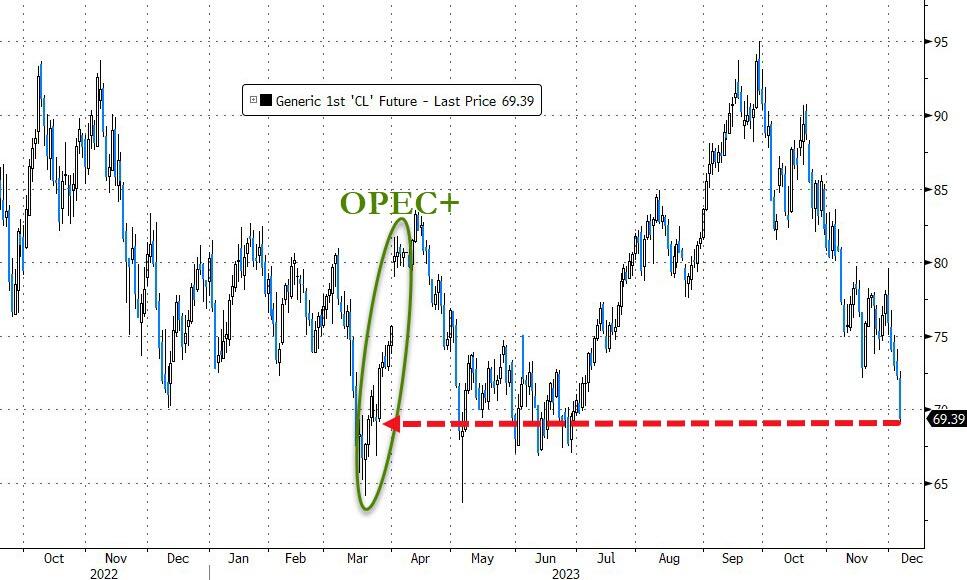
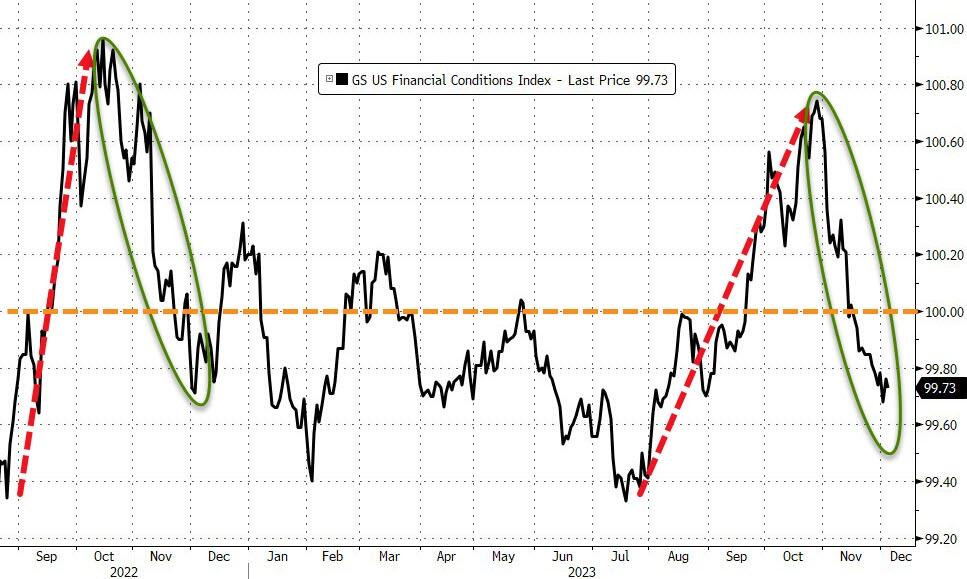
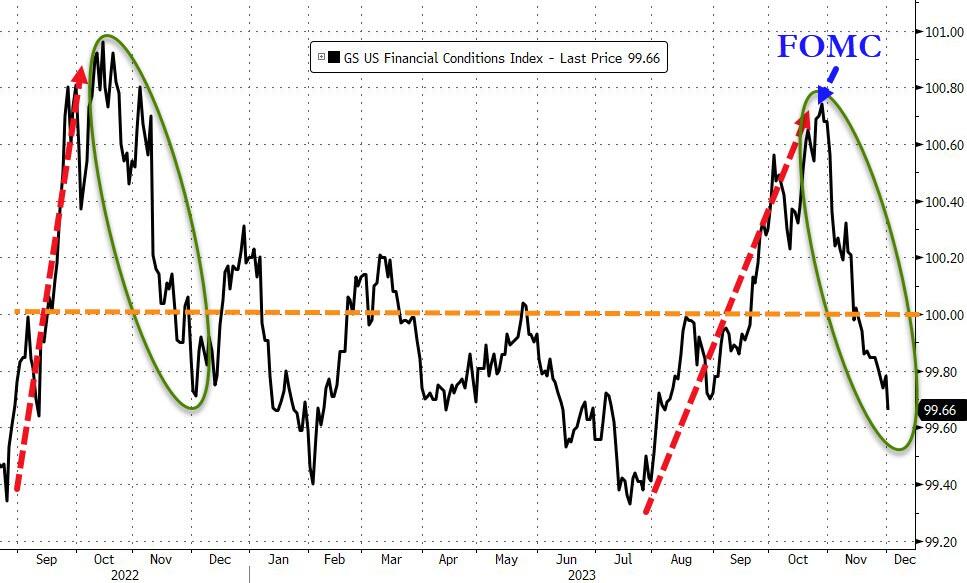
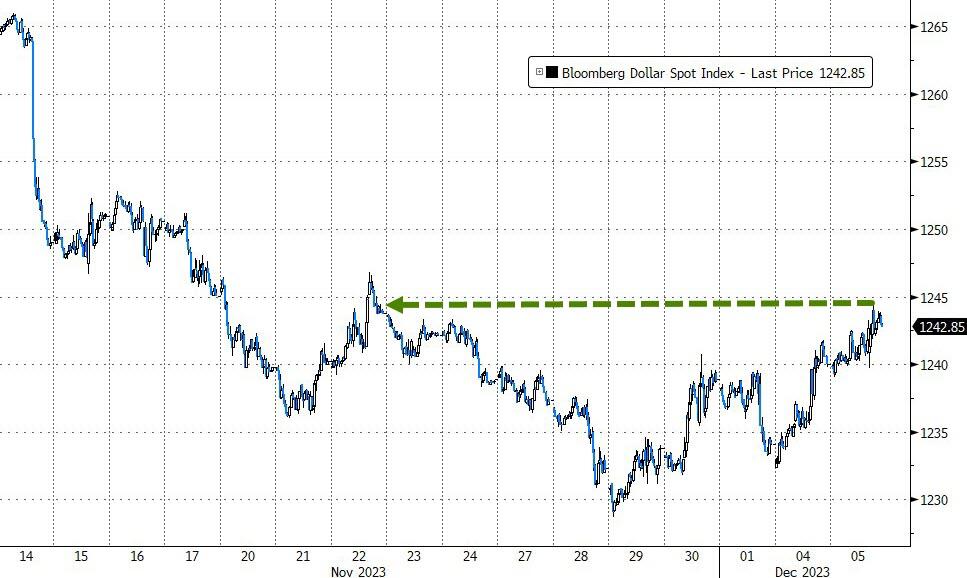
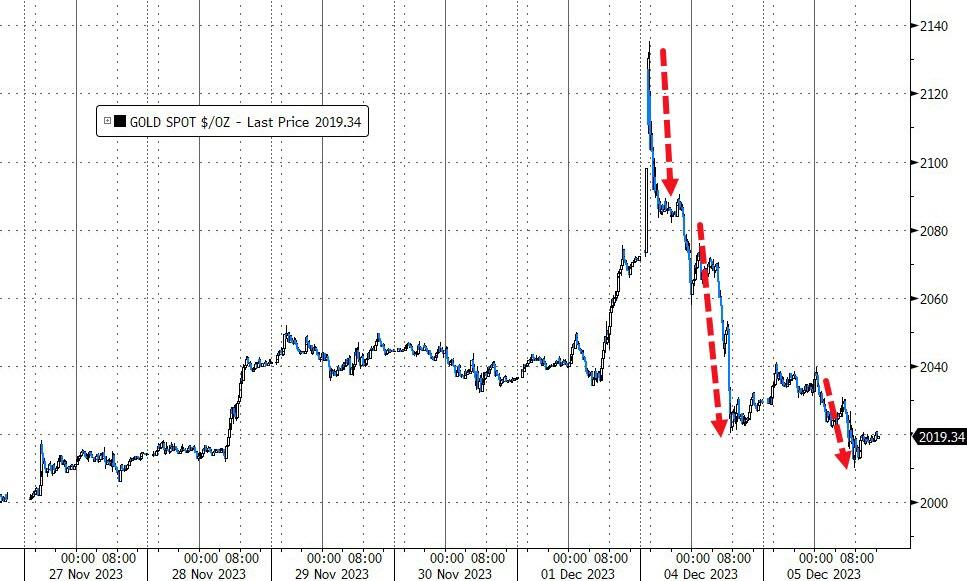
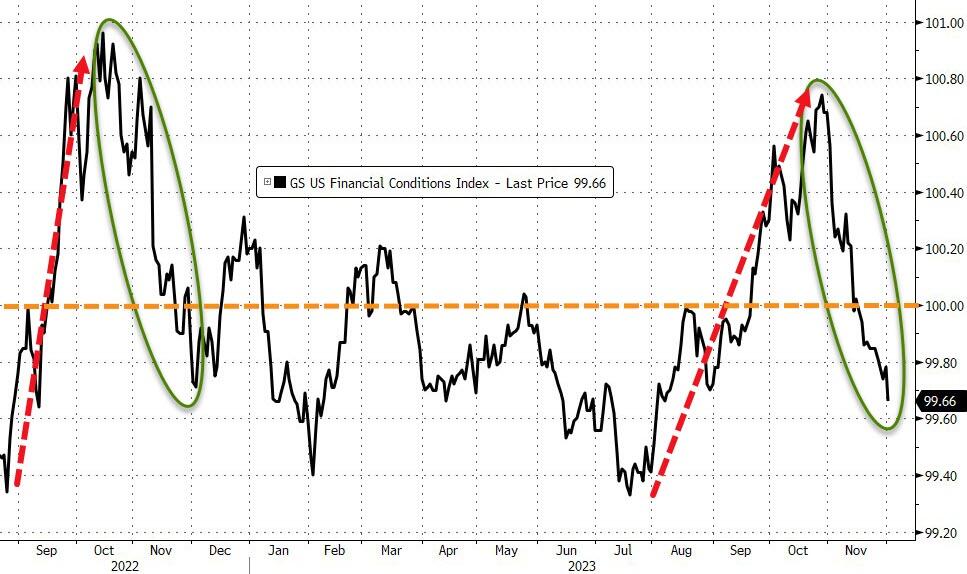
The dollar edged higher, along with gold, which bounced back from the 2,020-support level. Crude oil extended its losing streak to five days, as financial conditions loosened, reversing the tightening that occurred from August to October.

Fed chair Powell had previously said that the market was doing the job for him (tightening), but now that the market has undone most of that job, will the Fed have to step in and intervene?

Read More
Nasdaq Outperforms As Liquidity Divergence Widens

Ulli Market Commentary Contact

[Chart courtesy of MarketWatch.com]

  1. Moving the markets 

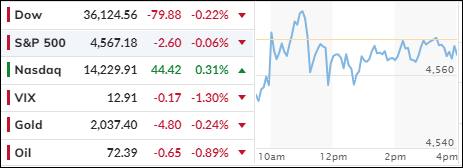
The stock market seemed to be in a daze as it drifted sideways without a clear direction. After a strong rally in the past weeks, investors seemed to lose their enthusiasm and confidence. The previous session ended with losses for the major indexes, raising doubts about the sustainability of the market’s momentum. Despite the recent slump, the indexes are still up for the quarter, showing how impressive the market’s performance was before this week.

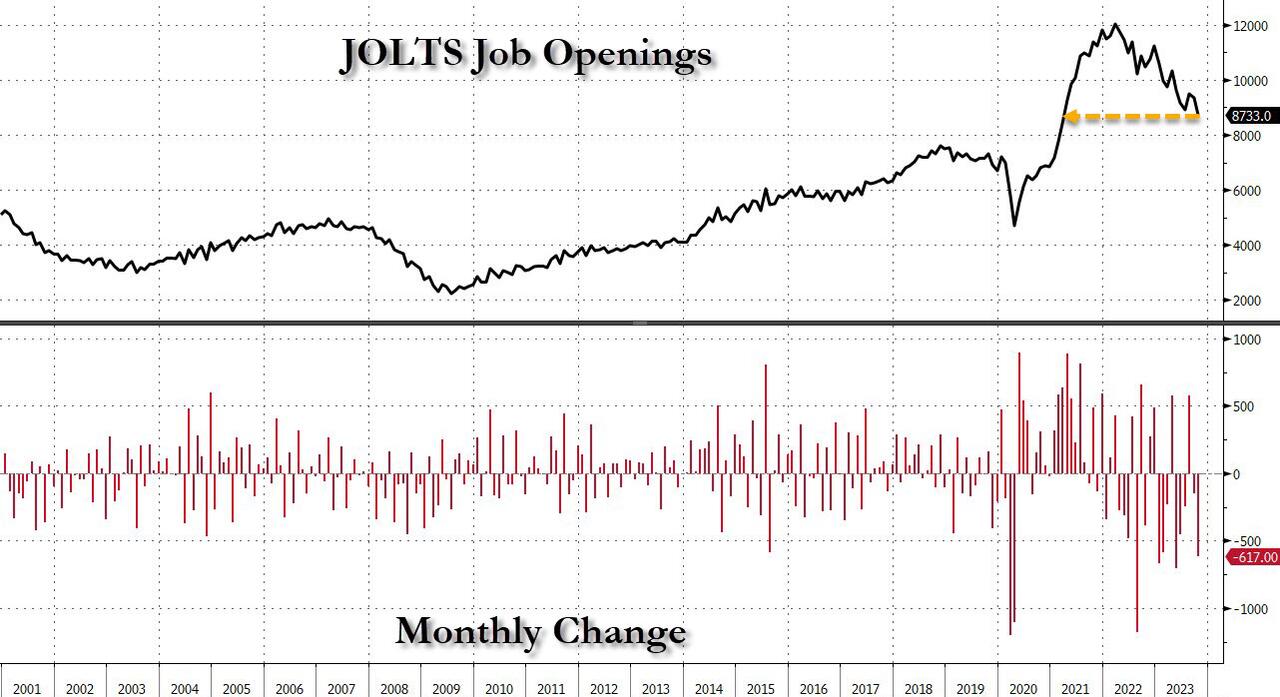
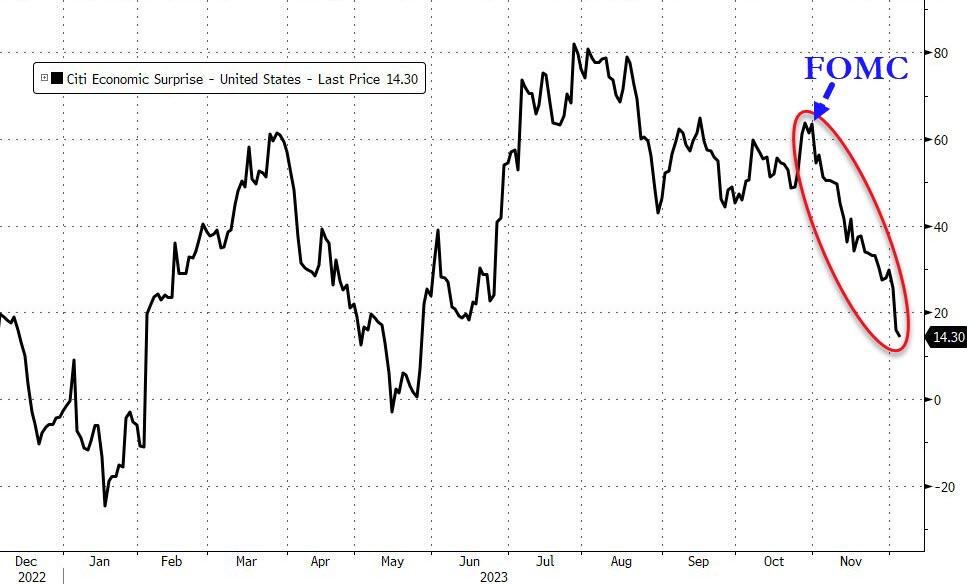
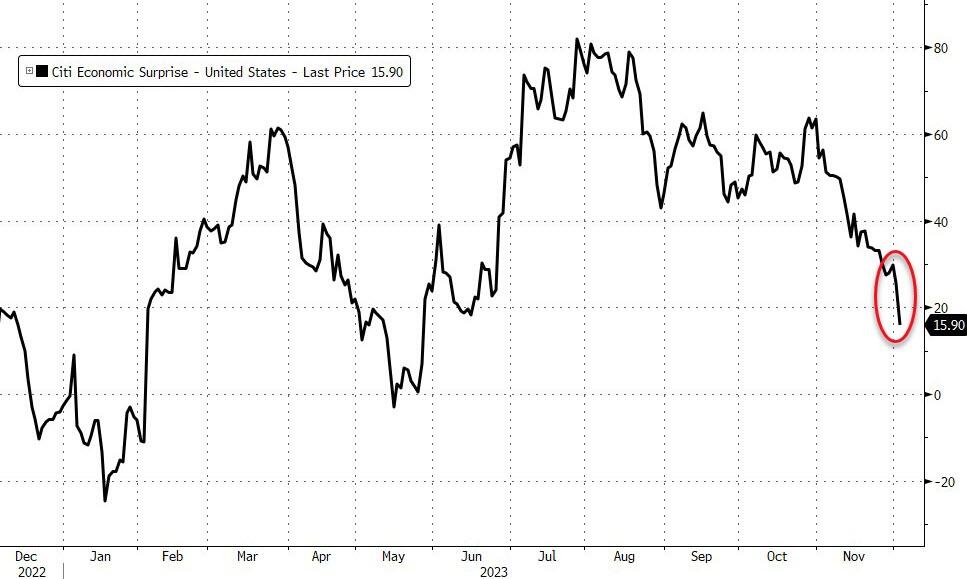
The market got a slight boost on Tuesday as the tech sector recovered some of its losses, lifting the Nasdaq into the green zone. The 10-year Treasury yield also dropped below the critical 4.2% mark, signaling a cooling off in the labor market. This came after a disappointing report on job openings, which showed a sharp decline and a downward revision of previous data. The Citi Economic Surprise index continued to slide, reflecting the gap between expectations and reality.

Meanwhile, traders are still betting on five rate cuts next year, which seems overly optimistic and wishful. Such a scenario would imply a severe economic and financial crisis, which is not very likely. BlackRock, the world’s largest asset manager, expects only one rate cut, and not until the second half of 2024.

Bond yields slipped, but the 10-year and 30-year remained above Friday’s lows, indicating some resilience in the bond market. Financial conditions also eased significantly, creating a favorable environment for borrowing and lending.

The Nasdaq managed to overcome its early weakness thanks to the rebound of the “Magnificent 7” stocks, which are the seven most influential tech companies in the market. The dollar rallied for the second day in a row, while gold retreated from its record highs two days ago.

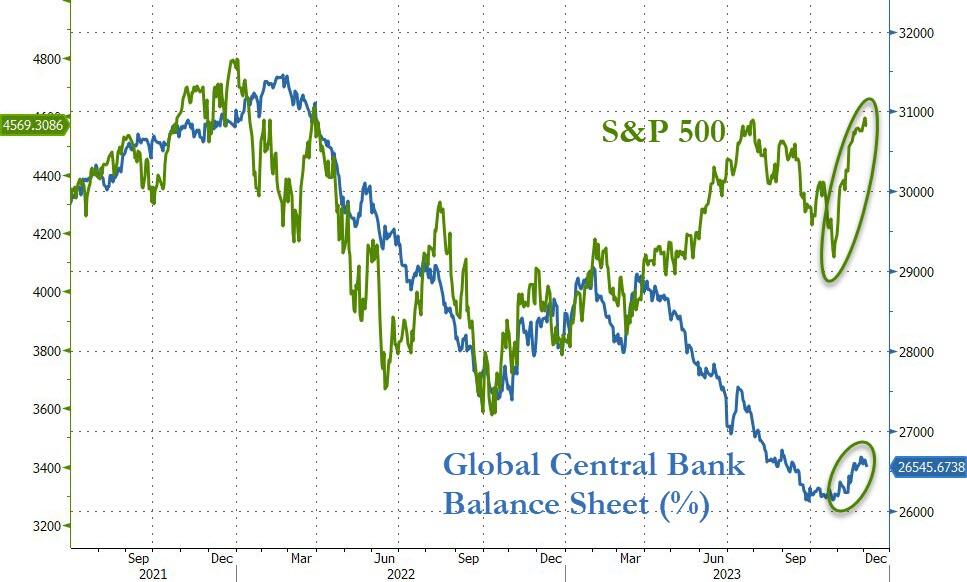
Liquidity is the key factor that drives the market movements. This chart shows the relationship between liquidity and the stock market, but it also raises a question: “How long can this divergence last?”

Read More

Markets Slip, Bitcoin And Gold Shine, Nvidia Sells: What’s Going On?

Ulli Market Commentary Contact

[Chart courtesy of MarketWatch.com]

  1. Moving the markets 

The markets had a case of the Mondays, as they dipped after five weeks of gains. But they didn’t give up easily and bounced back in the afternoon to minimize the damage.

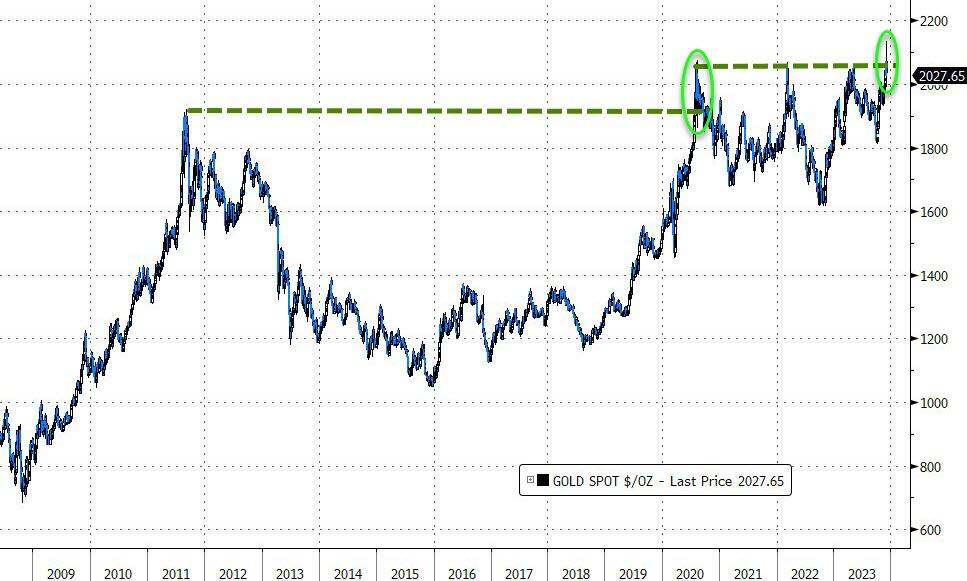
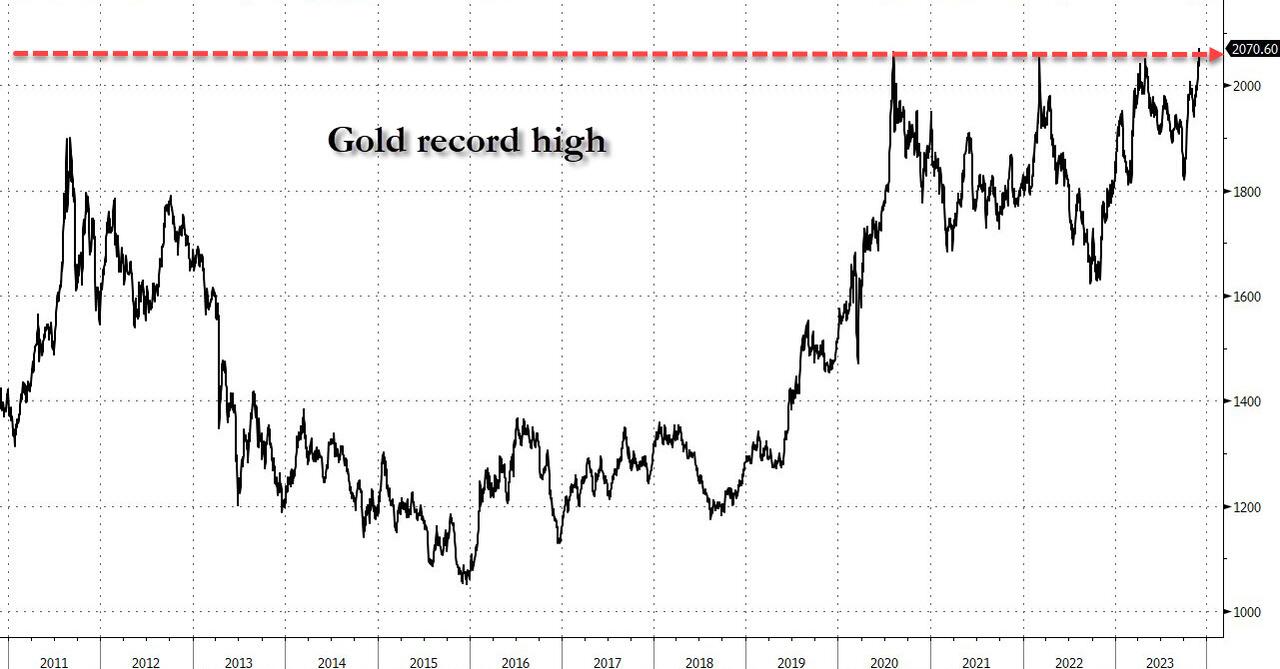
While stocks were having a hard time, bitcoin and gold were having a party in overnight trading. Bitcoin soared past $41,000 to hit a 19-month high, while gold reached its highest level ever before dropping during the day.

Monday’s moves were a sign of caution after a strong run in the market. Tech stocks took a hit, with Nvidia, Alphabet and Meta all losing more than 2%.

The market rally since late October was fueled by traders betting that the Fed will cut interest rates next year. They kept this belief last week even as Fed Chair Jerome Powell tried to cool them down, saying it’s too early to think about easing policy. In other words, they ignored him.

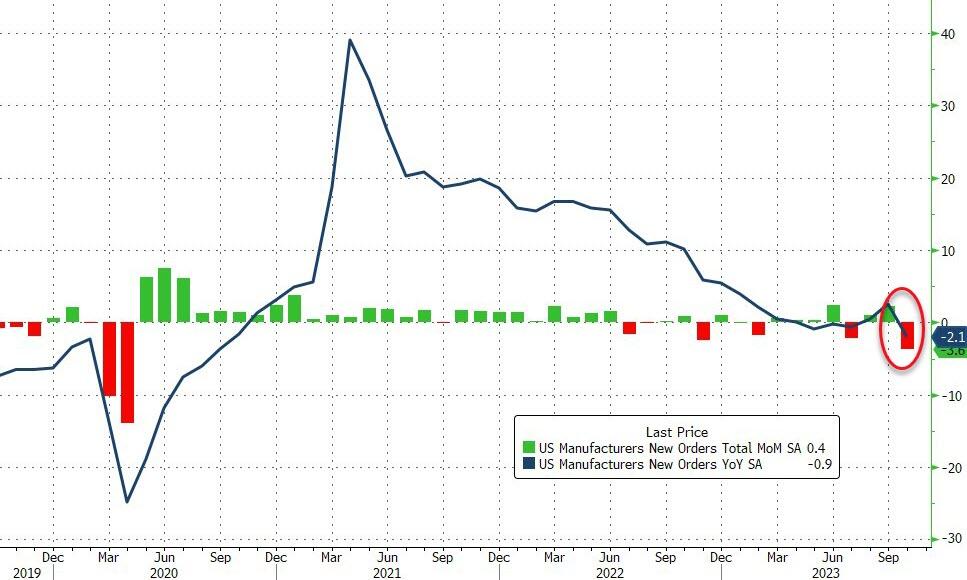
Weak economic data, such as US factory orders falling the most since Covid lockdowns, dragged the Citi Economic Surprise index lower, as financial conditions turned sour in October and never recovered.

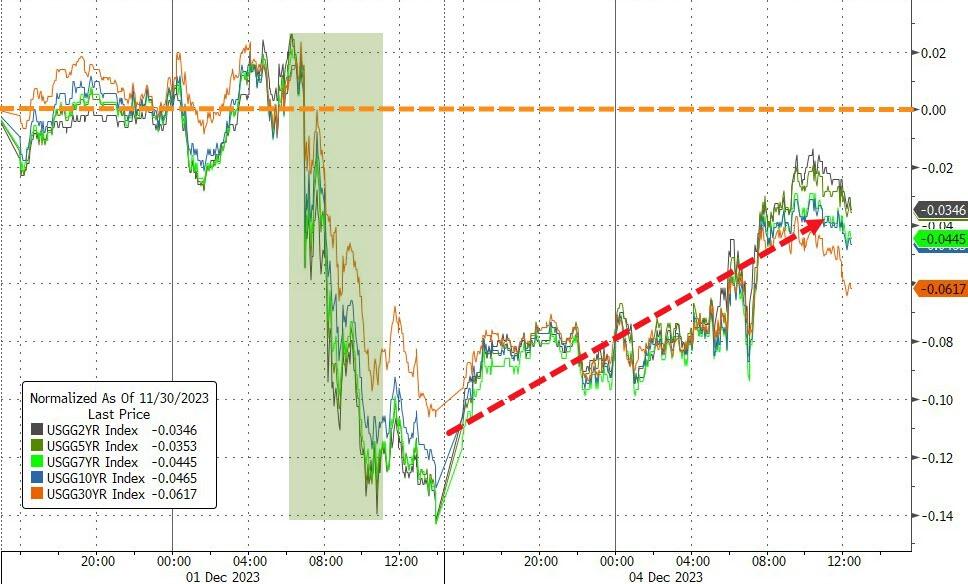
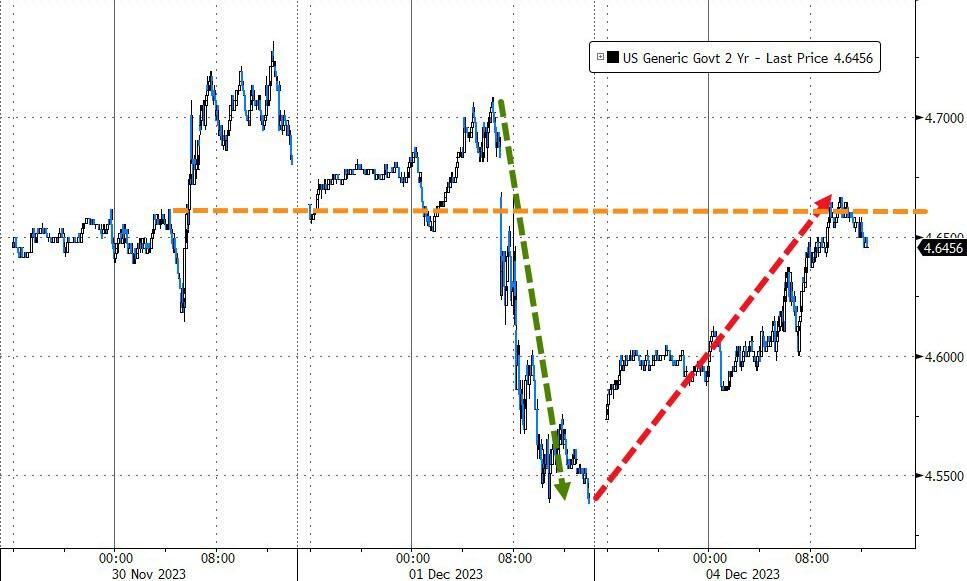
Bond yields rose from Friday’s low, with the 2-year jumping 14 basis points, while the dollar ran faster.

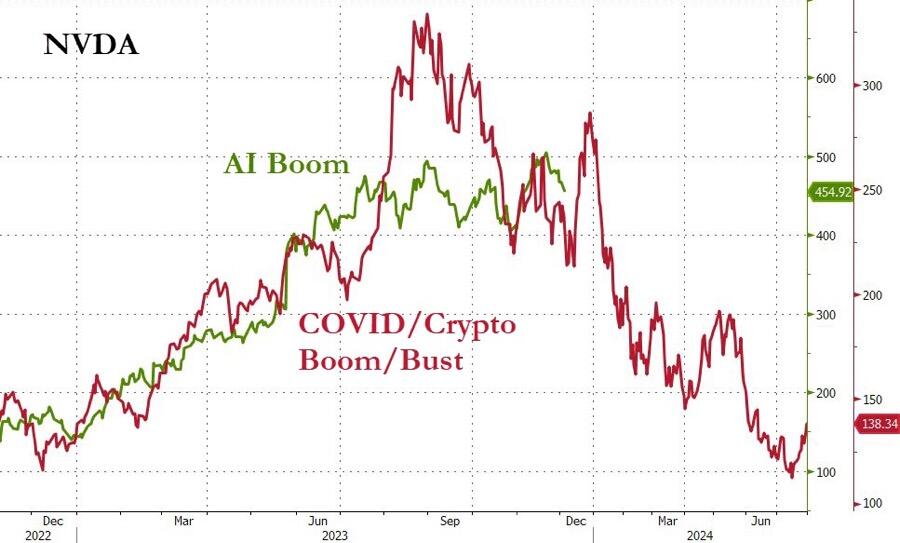
We also found out that Nvidia, the Wall Street tech darling, filed paperwork to sell 370,000 shares held by insiders, despite their stellar 3rd quarter earnings.

What do they know that we don’t? Or are we heading for an AI bust, as this chart suggests?

Read More

ETFs On The Cutline – Updated Through 12/01/2023

Ulli ETFs on the Cutline Contact

Do you want to know which ETFs are hot and which ones are not? Then you need my High-Volume ETF Cutline report. It tells you how close or far each of the 311 ETFs I follow is from its long-term trend line (39-week SMA). These are the ETFs that trade more than $5 million a day, so they are not some obscure funds that nobody cares about.

The report is split into two parts: The winners that are above their trend line (%M/A), and the losers that are below it. The yellow line is the line of shame that separates them. You can see how many ETFs are in each group and how they have changed since the last report (179 vs. 245 current).

Take a peek:

The HV ETF Master Cutline Report

If you are confused by some of the terms we use, don’t panic. I have a helpful Glossary of Terms for you.

If you want to learn more about the Cutline method and how it can make you rich (or at least less poor), read my original post here.

ETF Tracker Newsletter For December 1, 2023

Ulli ETF Tracker Contact

ETF Tracker StatSheet          

You can view the latest version here.

STOCKS SOAR, BONDS AND GOLD RALLY, BUT EXPERTS WARN OF TROUBLE AHEAD

[Chart courtesy of MarketWatch.com]

  1. Moving the markets 

The markets soared on Friday, ending the best month of the year with a bang. The Dow Jones Industrial Average hit a new 2023 record, while the S&P and Nasdaq followed suit. But not everyone is celebrating the rally. Some experts are warning that the party may soon be over, as the economy shows signs of slowing down and the Fed signals rate cuts in sight.

One of the skeptics was Fed Chair Jerome Powell, who poured cold water on the market’s hopes for lower interest rates. He said it was too early to say if the Fed’s policy was too tight, and that the central bank would not act based on “speculation”. His remarks sent bond yields tumbling, as investors priced in a higher chance of a rate cut as soon as March. The market now thinks there is an 80% probability of a cut, up from 40% yesterday.

Gold also surged, hitting a new all-time high of around $2,090 an ounce. The precious metal has been on a tear since October, thanks to strong demand from central banks and investors. Gold is seen as a “safe haven” in times of uncertainty, and a hedge against inflation. Some traders think the current environment is perfect for gold, as the economy is cooling but not collapsing, and the Fed is on hold but not hiking. They call it the Goldilocks scenario: not too hot, not too cold.

But not all the market moves made sense. Bloomberg noted that bonds had a better reason to rally than stocks, which had to factor in the growth concerns that underpin Powell’s remarks. The latest data showed that the manufacturing sector contracted for the fourth month in a row in November, and that the economy was showing typical early signs of recession, according to Bloomberg Economics.

ZeroHedge pointed out that, historically, stocks tend to drop sharply right before the Fed cuts rates, as the market realizes why the Fed is panicking. The last time the Fed cut rates, in March 2020, stocks plunged by 30% in a matter of weeks, as the coronavirus pandemic triggered a global lockdown.

Will history repeat itself?

Read More

Weekly StatSheet For The ETF Tracker Newsletter – Updated Through 11/30/2023

Ulli ETF StatSheet Contact

ETF Data updated through Thursday, November 30, 2023

How to use this StatSheet:

  1. Out of the 1,800+ ETFs out there, I only pick the ones that trade over $5 million per day (HV ETFs), so you don’t get stuck with a lemon that nobody wants to buy or sell.
  1. Trend Tracking Indexes (TTIs)

These are the main indicators that tell you when to buy or sell Domestic and International ETFs (section 1 and 2). They do that by comparing their position to their long-term M/A (Moving Average). If they cross above, and stay there, it’s a green light to buy. If they fall below, and keep going, it’s a red light to sell. And to make sure you don’t lose your shirt if things go south, I also use a 12% trailing stop loss on all positions in these categories.

  1. All other investment areas don’t have a TTI and should be traded based on the position of each ETF relative to its own trend line (%M/A). That’s why I call them “Selective Buy.” In other words, if an ETF goes above its own trend line, you can buy it. But don’t forget to use a trailing sell stop of 12%, or less if you’re feeling nervous.

If some of these words sound like Greek to you, please check out the Glossary of Terms and new subscriber information in section 9.

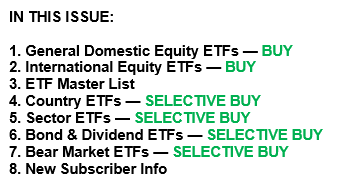
  1. DOMESTIC EQUITY ETFs: BUY— since 11/21/2023

Click on chart to enlarge

This is our main compass, the Domestic Trend Tracking Index (TTI-green line in the above chart). It has now broken above its long-term trend line (red) by +2.87% and has generated a new “Buy” as posted.

Read More