Do you want to know which ETFs are hot and which ones are not? Then you need my High-Volume ETF Cutline report. It tells you how close or far each of the 311 ETFs I follow is from its long-term trend line (39-week SMA). These are the ETFs that trade more than $5 million a day, so they are not some obscure funds that nobody cares about.
The report is split into two parts: The winners that are above their trend line (%M/A), and the losers that are below it. The yellow line is the line of shame that separates them. You can see how many ETFs are in each group and how they have changed since the last report (271 vs. 270 current).
MARKETS MIXED AS INFLATION SLOWS, INCOME DIVERGES, AND RATE CUTS LOOM
[Chart courtesy of MarketWatch.com]
Moving the markets
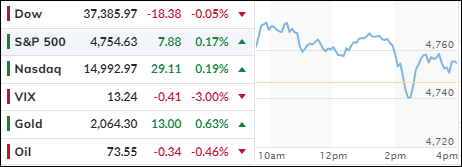
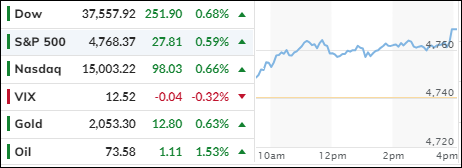
The S&P and Nasdaq managed to squeeze out a tiny gain, thanks to tame inflation data, and extended their weekly winning streak to eight. The Dow was not so lucky and ended in the red.
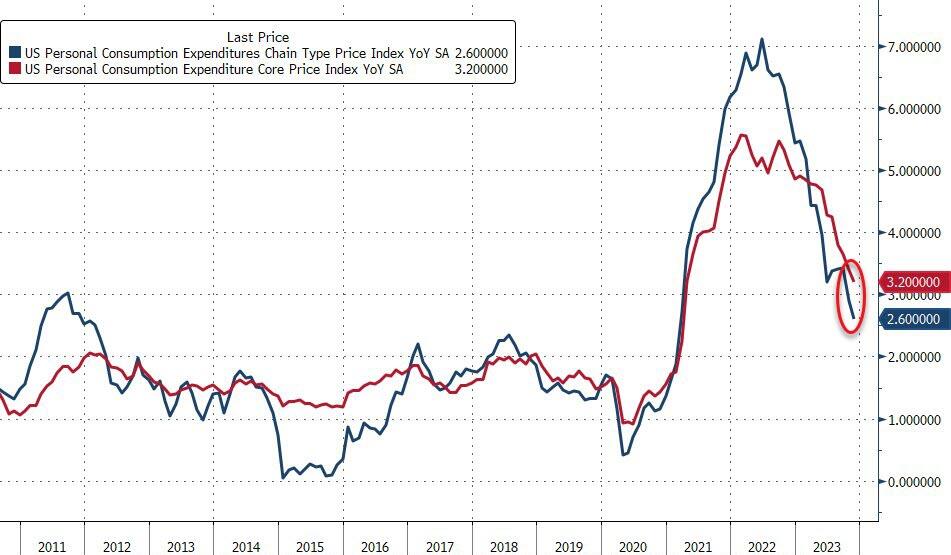
The latest inflation report showed that prices rose less than expected in November. The core PCE index, which the Fed watches closely, increased by 0.1% from the previous month and 3.2% from a year ago, matching the forecasts. Economists had predicted a 0.1% monthly rise and a 3.3% annual gain.
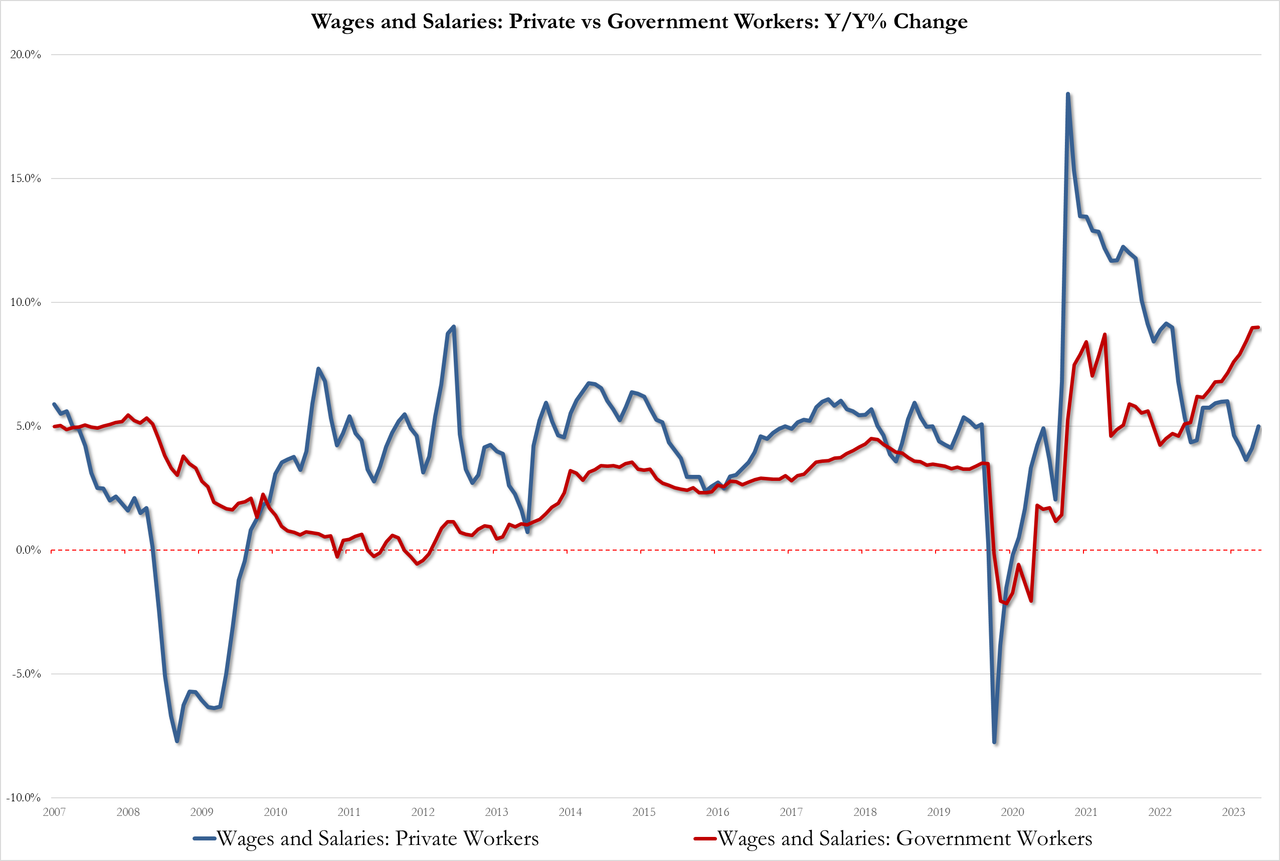
On the income front, private sector workers saw their wages grow by 5.0% year-over-year, after a sluggish 4.1% in October, which was the lowest in three years. Meanwhile, government workers enjoyed a whopping 9.0% year-over-year increase, tying a record high. Something seems fishy here…
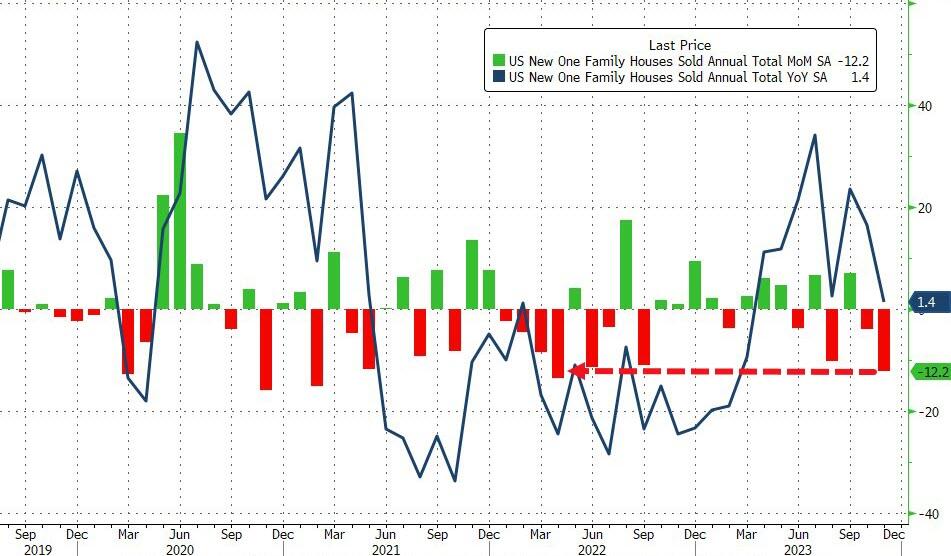
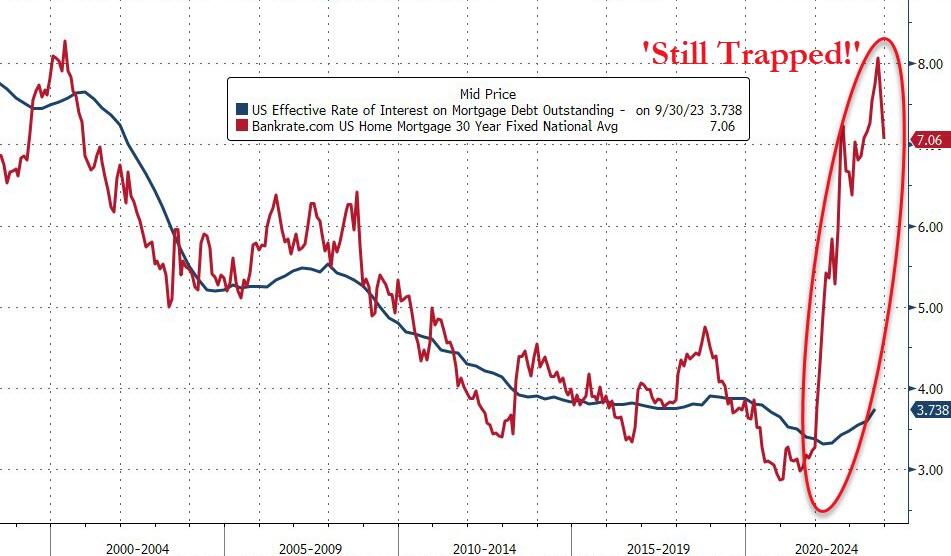
US new home sales plummeted 12.2% in November, despite lower mortgage rates, but existing home sales bounced back slightly from record lows. However, the average mortgage rate for new borrowers is still much higher than the effective rate for all homeowners.
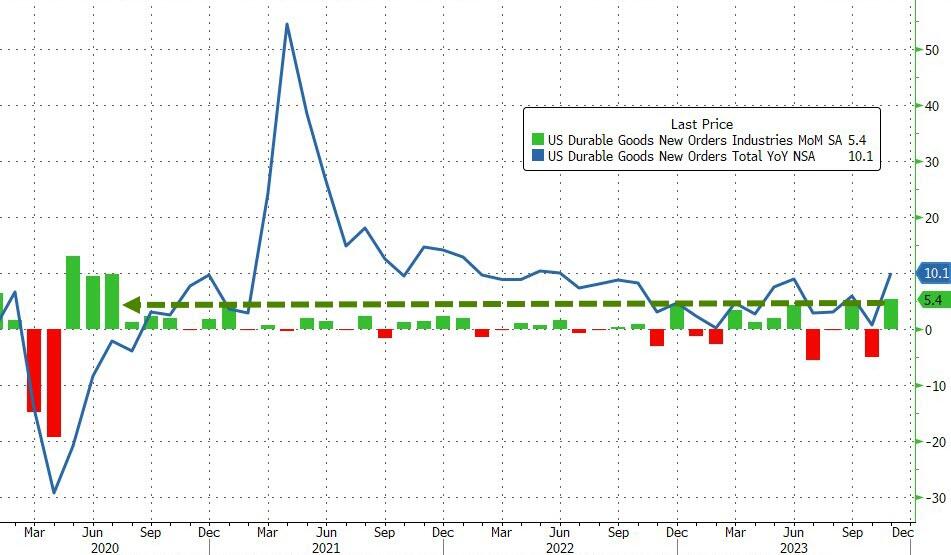
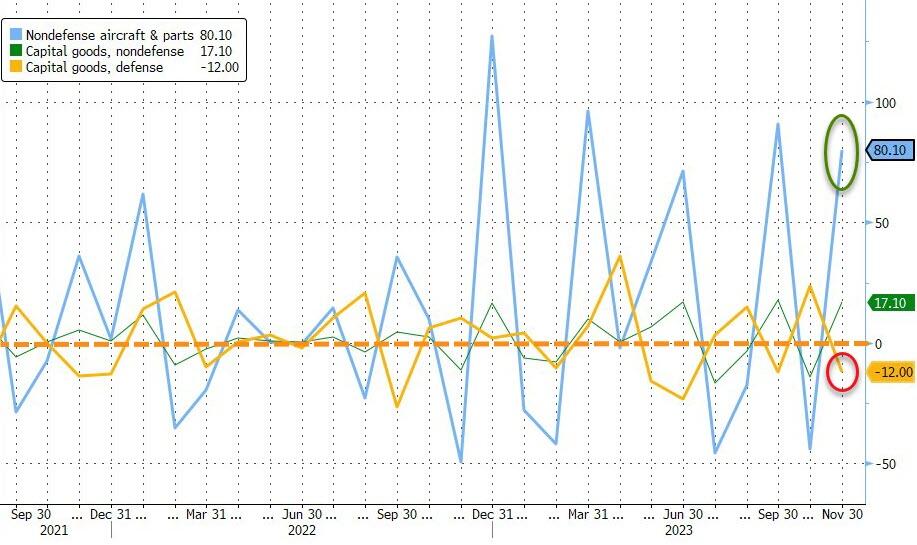
On the bright side, US durable goods orders jumped the most since July 2020, but it’s been a wild ride. The jump in orders was mainly driven by an 80.1% monthly surge in non-defense aircraft and parts orders.
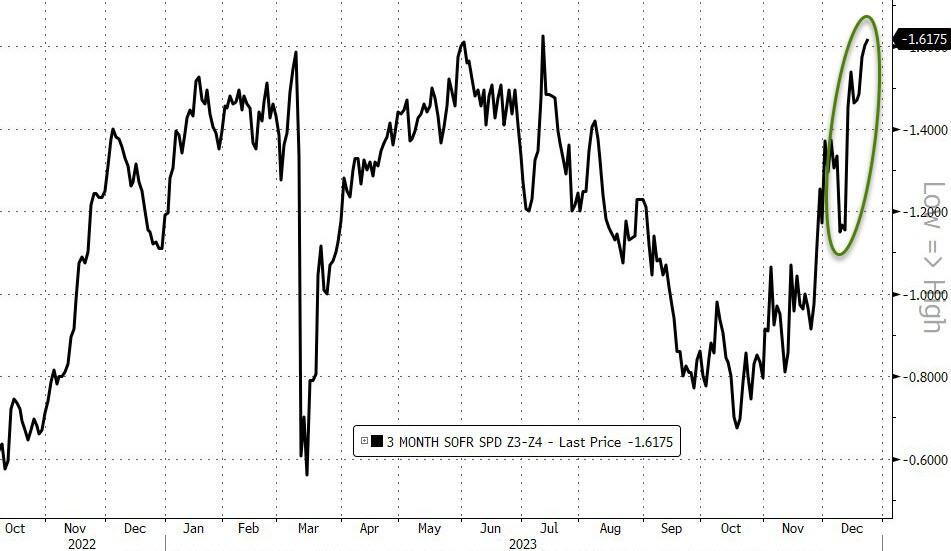
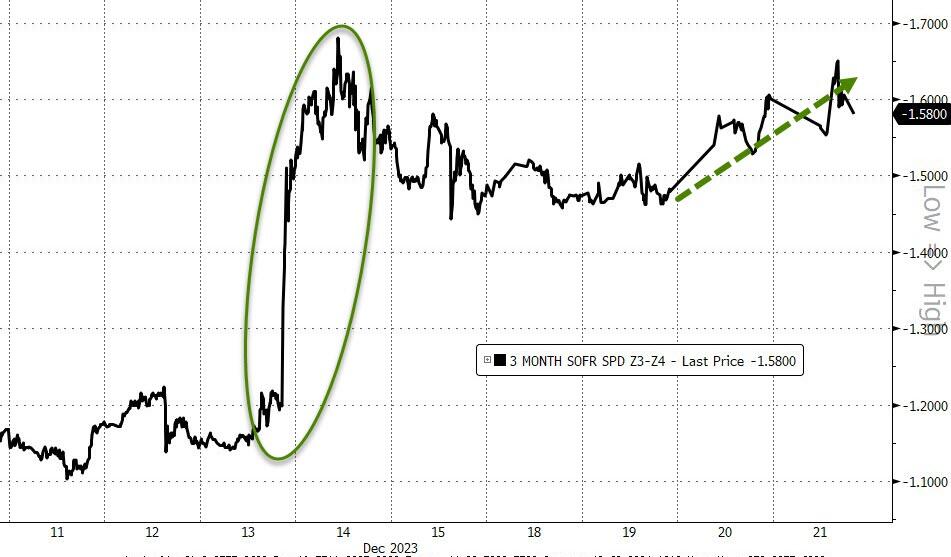
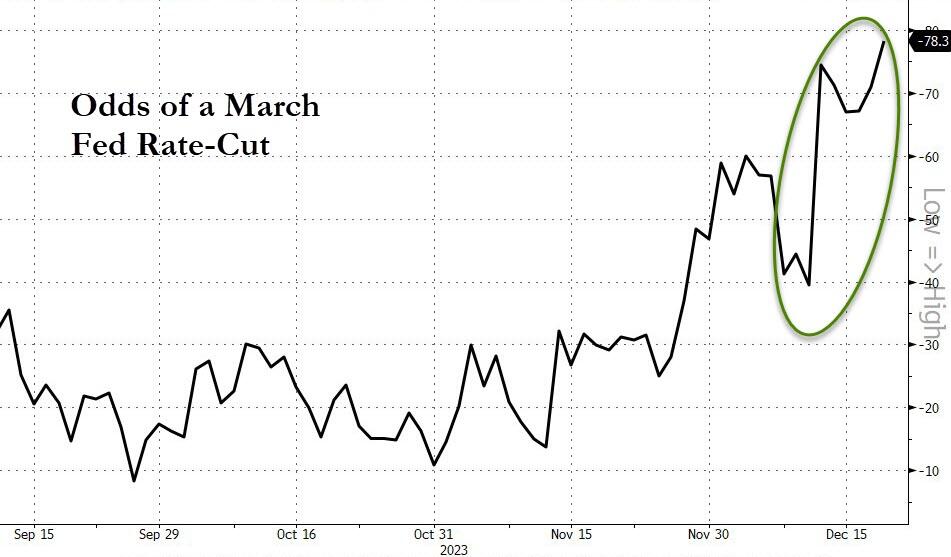
Rate-cut expectations reached a new high this week, now pricing in 163 basis points of cuts in 2024. As ZeroHedge noted, if the Fed needs to slash rates that much, that fast, it won’t be because of cooling inflation – it will be because of worsening depression… which is not good for stocks.
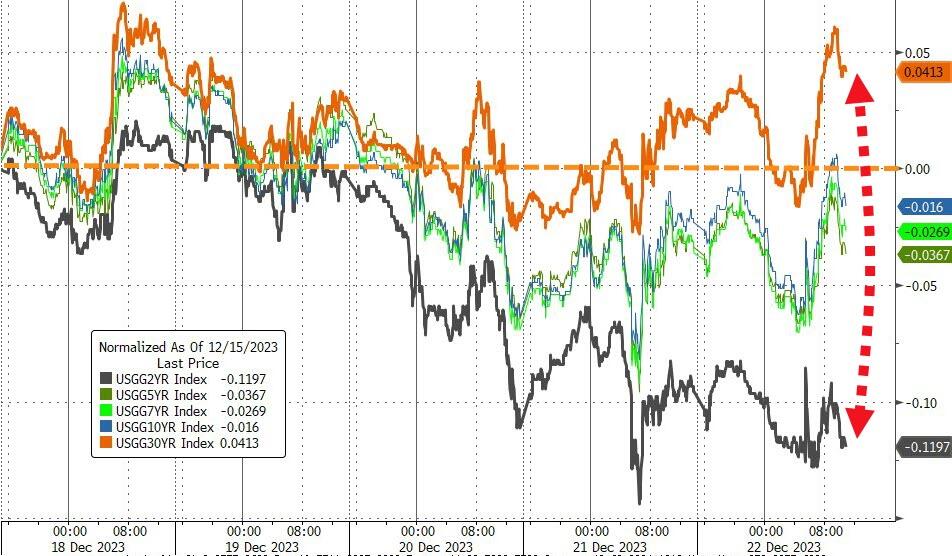
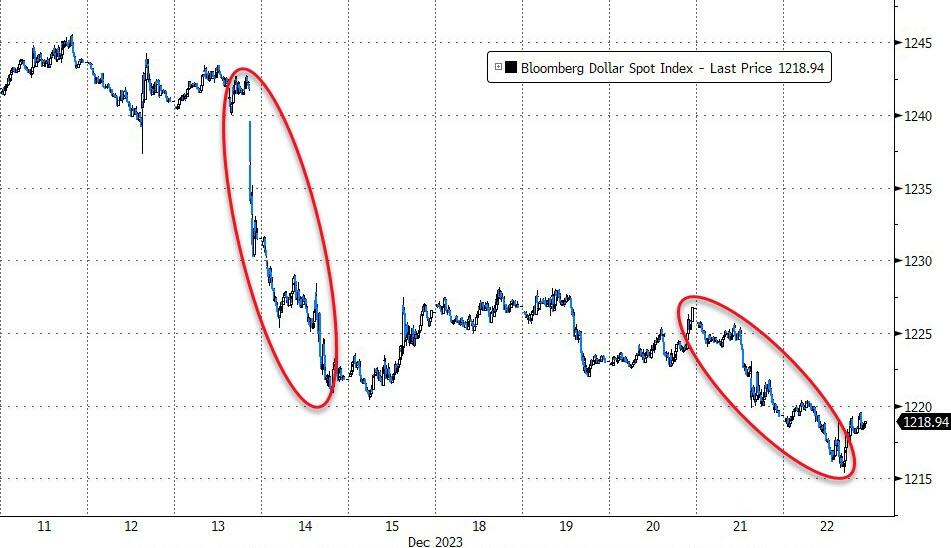
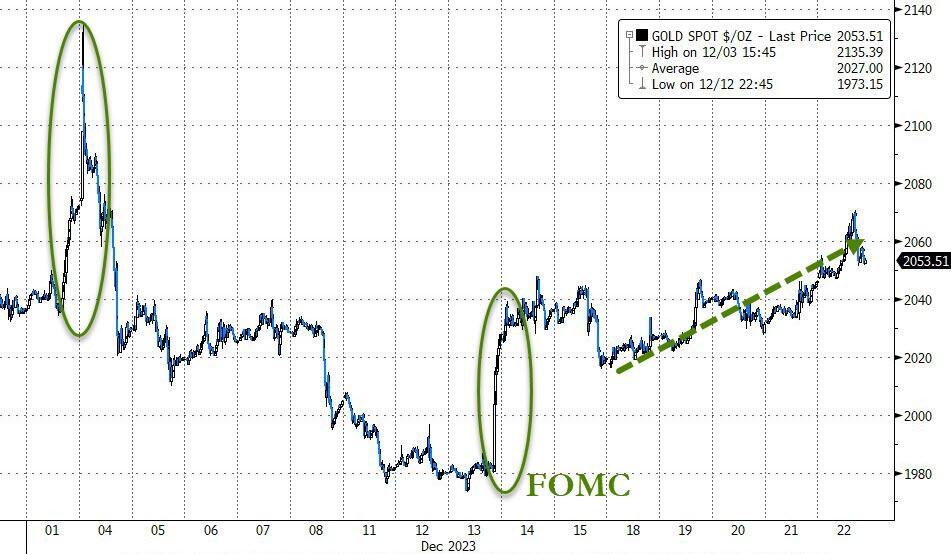
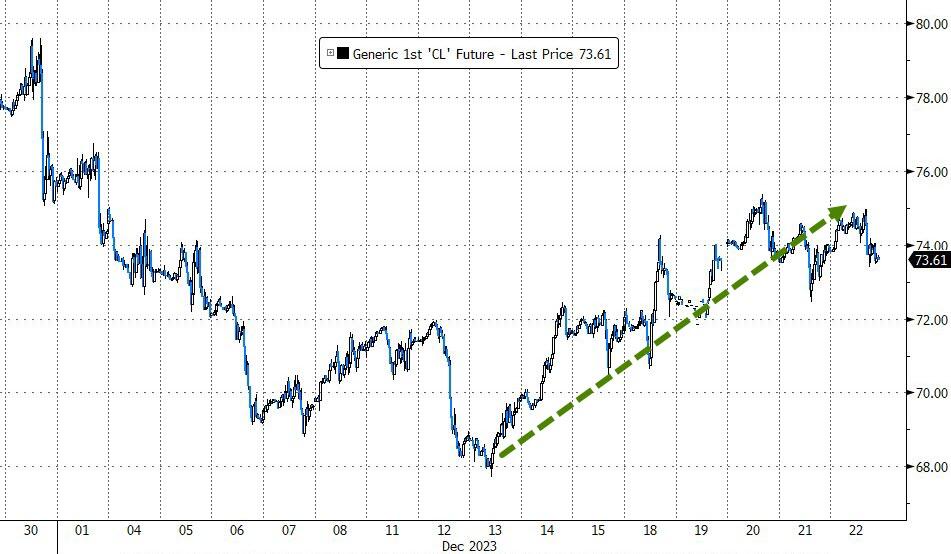
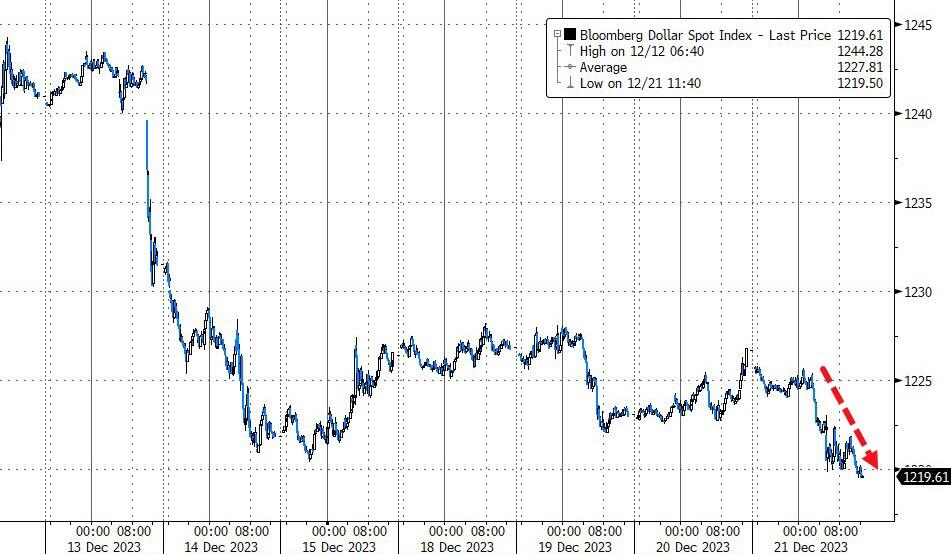
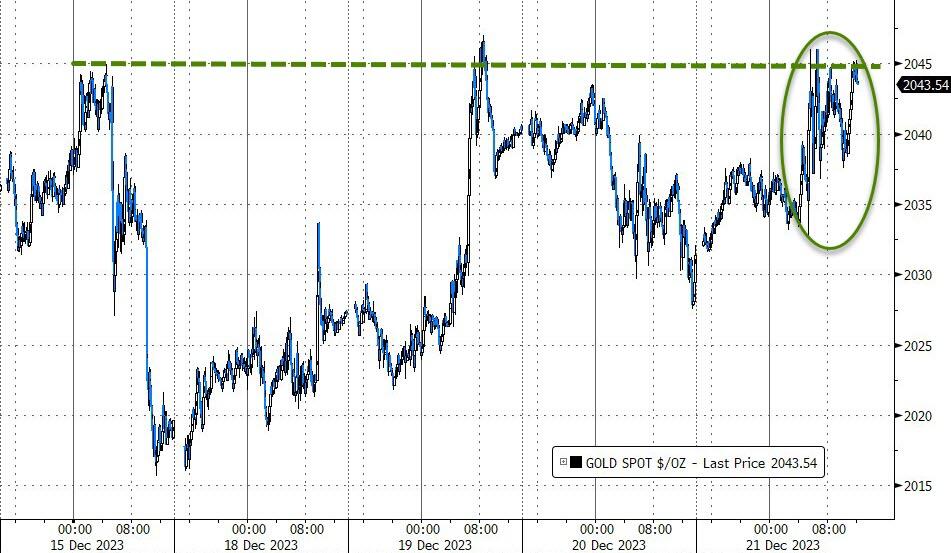
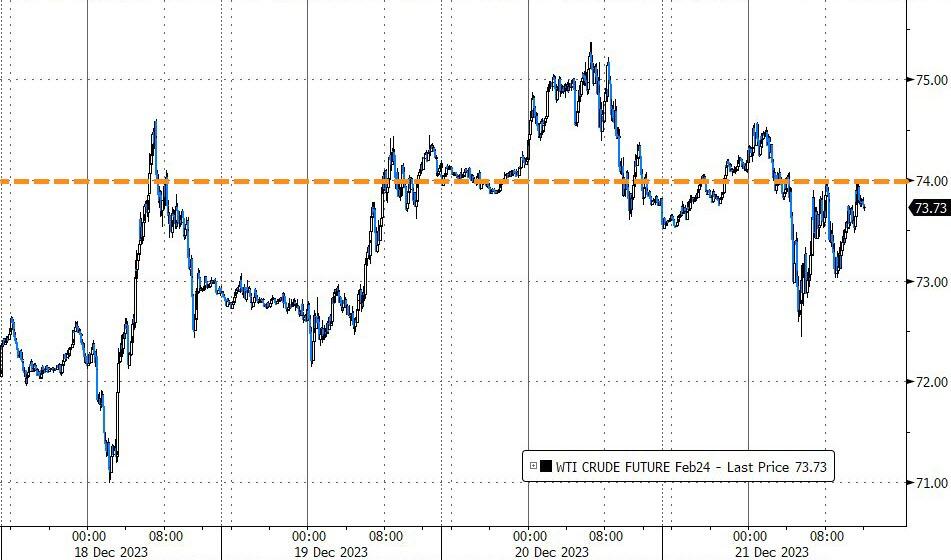
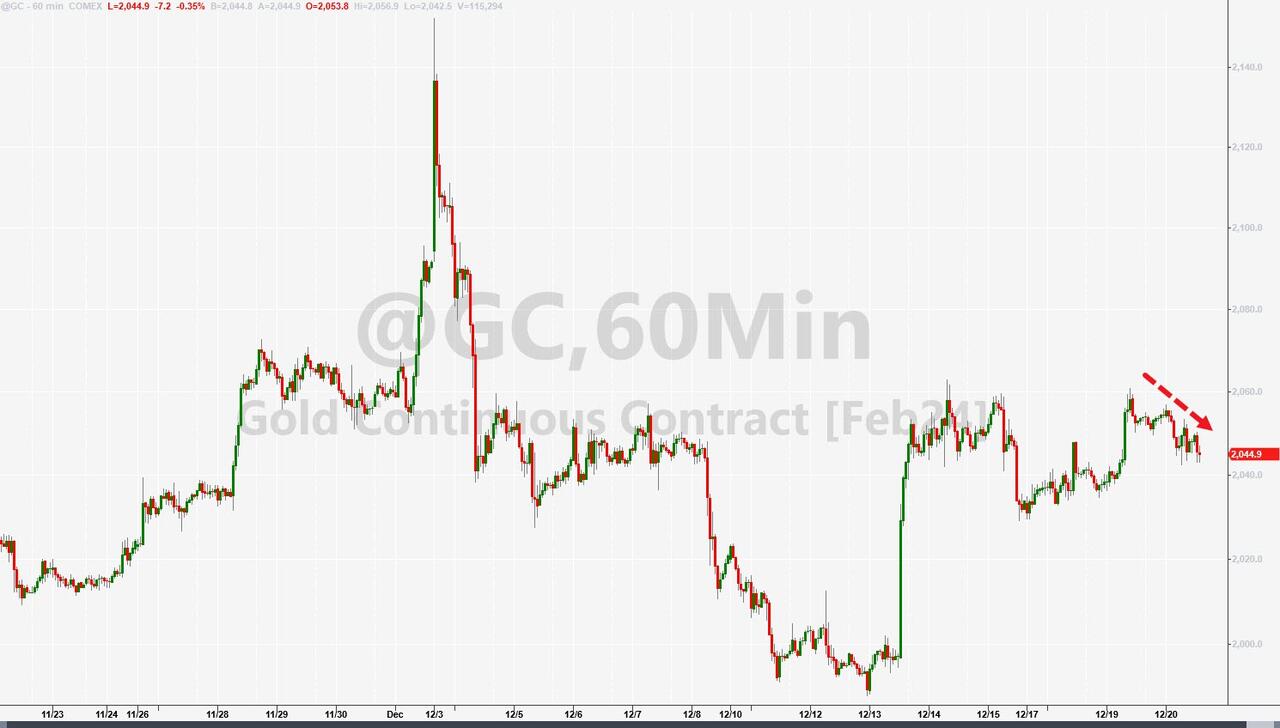
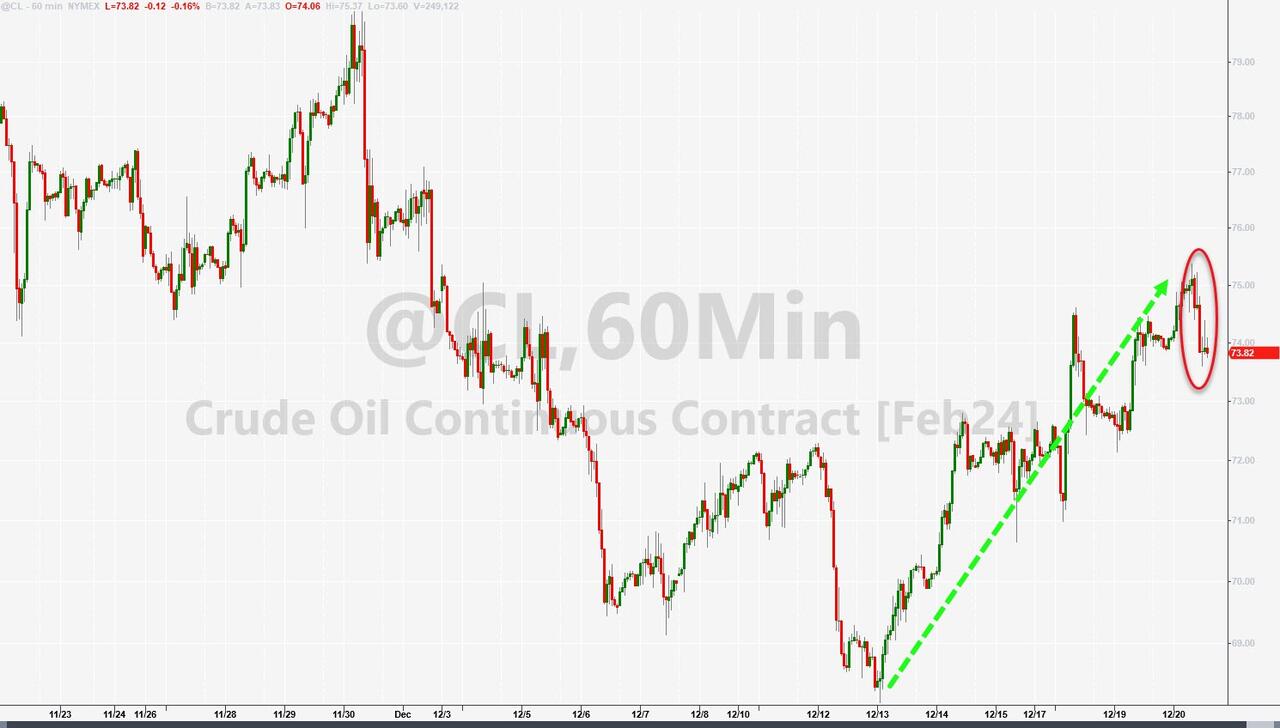
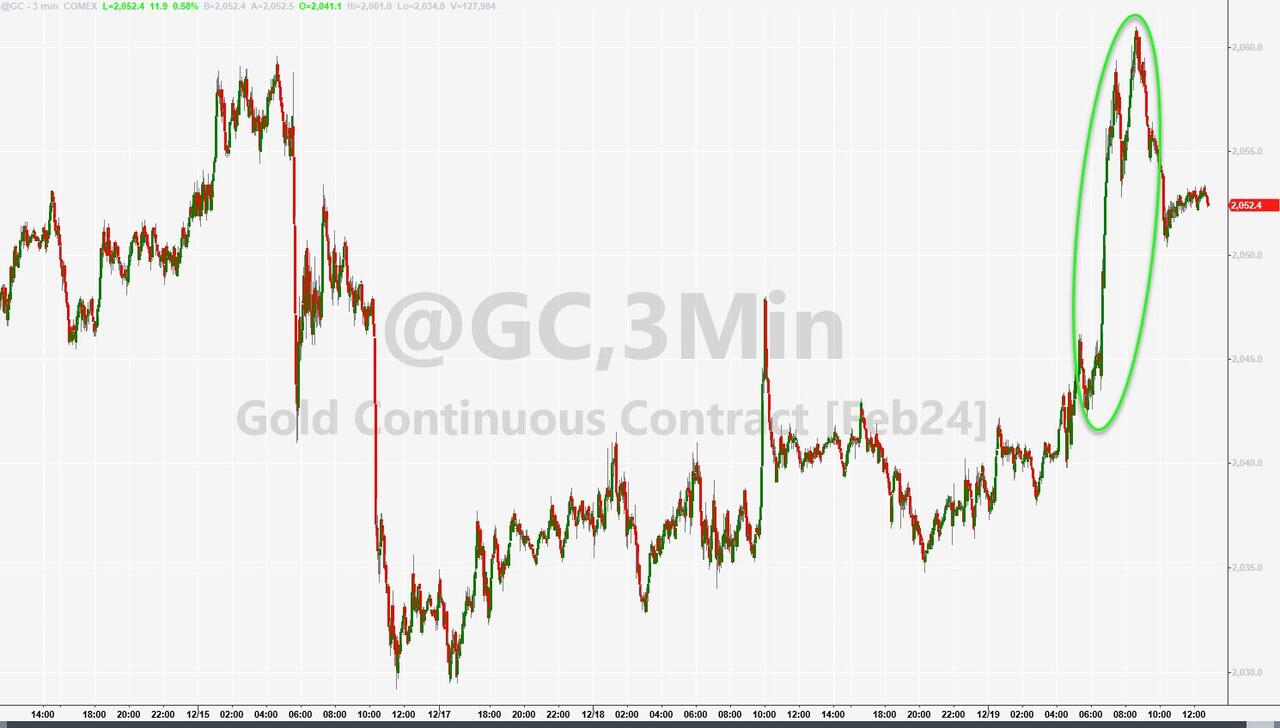
Bond yields were mixed, the dollar fell to its lowest since July and is now down for the 5th week in the last 6. That helped gold, which is up 4 of the last 5 days and rising for the 5th week of the last 6. Oil followed suit and rose for the second week in a row.
I will be back next Tuesday for the market report.
ETF Data updated through Thursday, December 21, 2023
How to use this StatSheet:
Out of the 1,800+ ETFs out there, I only pick the ones that trade over $5 million per day (HV ETFs), so you don’t get stuck with a lemon that nobody wants to buy or sell.
Trend Tracking Indexes (TTIs)
These are the main indicators that tell you when to buy or sell Domestic and International ETFs (section 1 and 2). They do that by comparing their position to their long-term M/A (Moving Average). If they cross above, and stay there, it’s a green light to buy. If they fall below, and keep going, it’s a red light to sell. And to make sure you don’t lose your shirt if things go south, I also use a 12% trailing stop loss on all positions in these categories.
All other investment areas don’t have a TTI and should be traded based on the position of each ETF relative to its own trend line (%M/A). That’s why I call them “Selective Buy.” In other words, if an ETF goes above its own trend line, you can buy it. But don’t forget to use a trailing sell stop of 12%, or less if you’re feeling nervous.
If some of these words sound like Greek to you, please check out the Glossary of Terms and new subscriber information in section 9.
DOMESTIC EQUITY ETFs: BUY— since 11/21/2023
Click on chart to enlarge
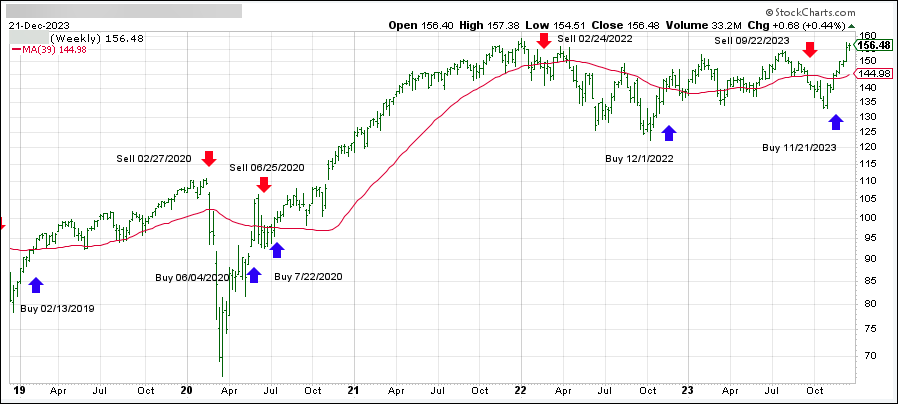
This is our main compass, the Domestic Trend Tracking Index (TTI-green line in the above chart). It has broken above its long-term trend line (red) by +7.89% and is in “Buy” mode as posted.
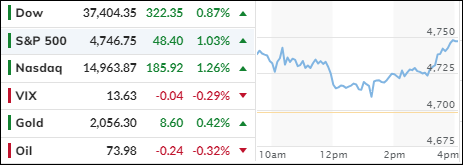
The markets bounced back from yesterday’s beating and regained most of their ground.
Traders are feeling optimistic about the yearend rally and ready to pop the champagne. Almost every stock in the S&P rose, led by Micron Technology, which soared 9% after smashing earnings estimates and raising its outlook.
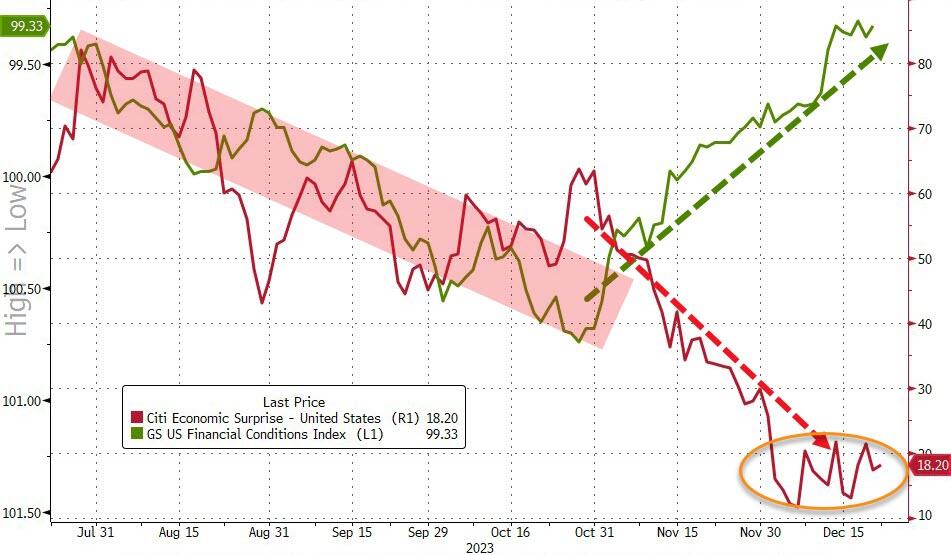
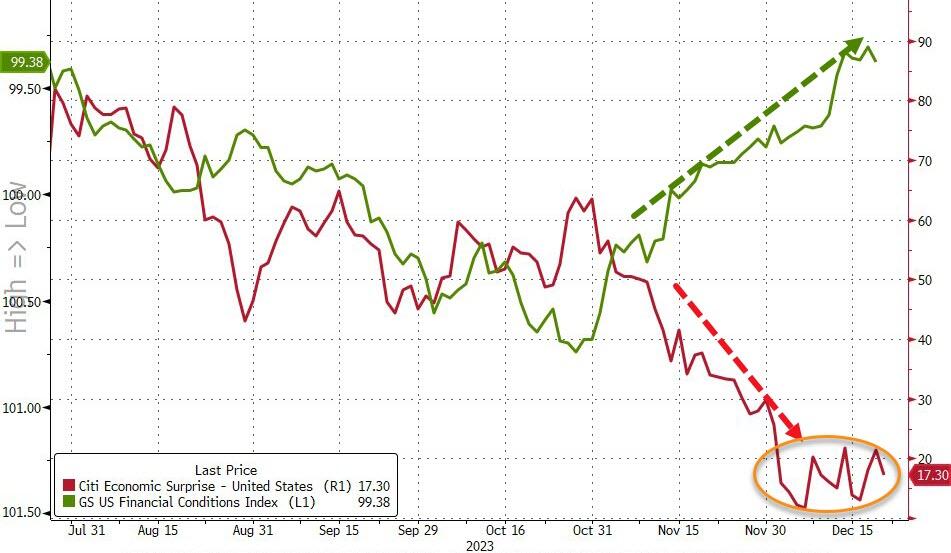
The bulls were also encouraged by weak economic data and easy money policies, which made them think that the economy is just right, not too hot, and not too cold. They used words like “goldilocks,” “soft landing” and “everything is awesome” to describe their euphoria. They are now betting that the Fed will slash interest rates by 160 bps next year, according to ZeroHedge.
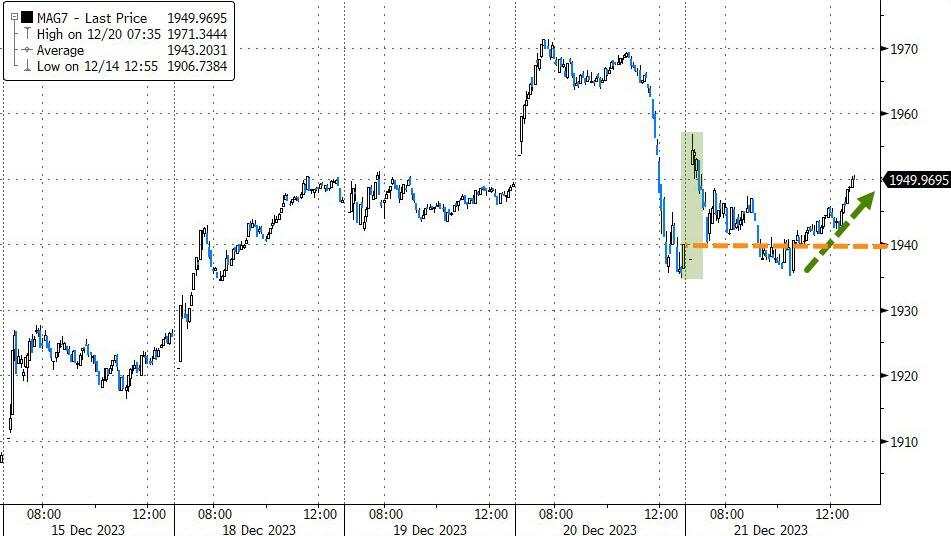
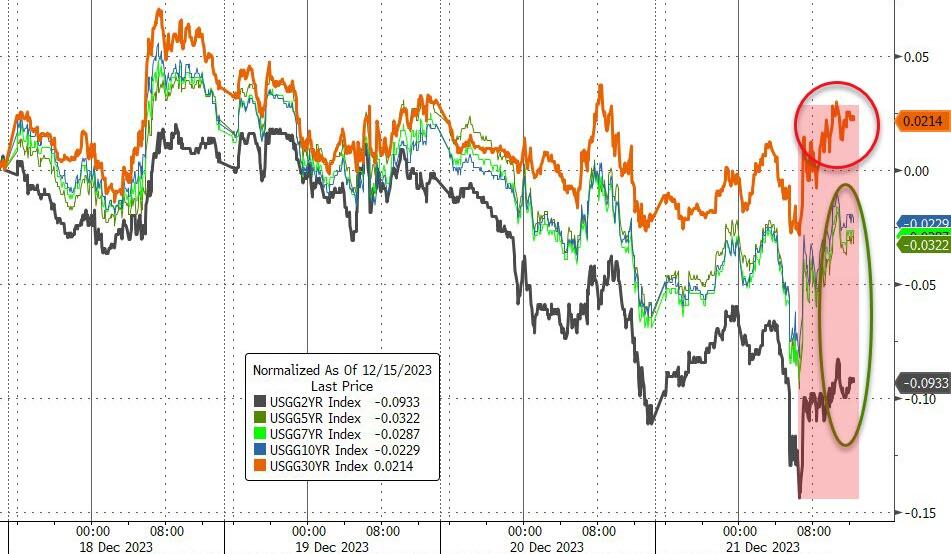
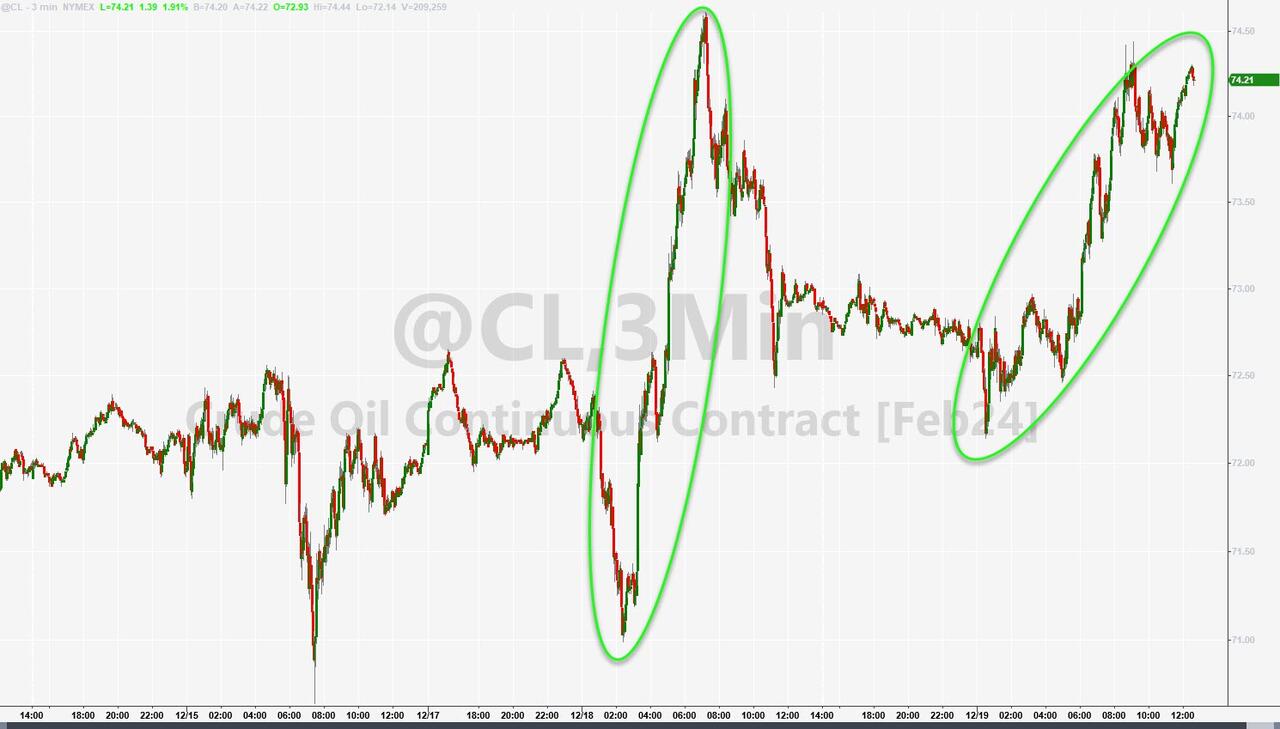
The MAG7 stocks had a mixed day but managed to end in the green. Bond yields edged up but did not spoil the party for stocks. The dollar slipped, giving gold a chance to shine again, while oil had a wild ride but finished slightly down.
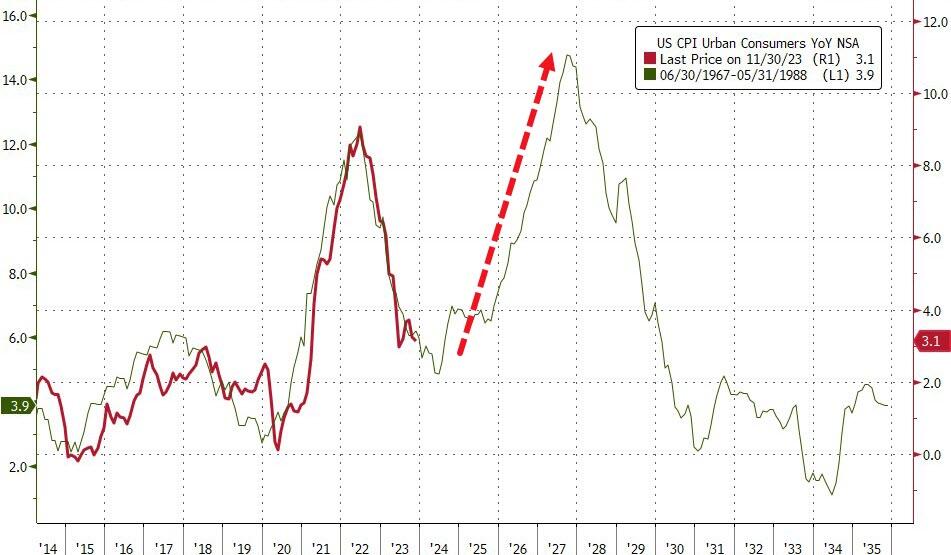
I have repeatedly warned that inflation is not dead and will come back to haunt us. The markets and the Fed don’t agree and think that history, as shown in this chart, won’t repeat itself.
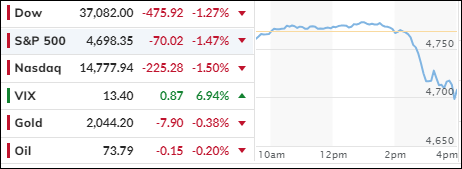
The markets have been soaring to dizzying heights lately, but today they came back down to earth a bit. Some traders decided to take some profits off the table after a long winning streak. This is normal and healthy for a bull market, and it doesn’t mean that the fundamentals have changed.
One of the biggest losers today was FedEx, which plunged 10% after disappointing investors with its revenue outlook and quarterly results. The company blamed higher costs, labor shortages, and supply chain disruptions for its woes.
The market’s retreat followed a strong session on Tuesday, when both the Dow and the Nasdaq extended their gains for nine days in a row. Despite today’s dip, all three major indexes are still on track to end the month and the year in positive territory, as investors anticipate lower interest rates from the Federal Reserve in 2023.
But what triggered the sudden sell-off today?
It seems that some exotic options played a role. These are options that expire on the same day they are traded, giving the holders the right to buy or sell the underlying asset at a fixed price.
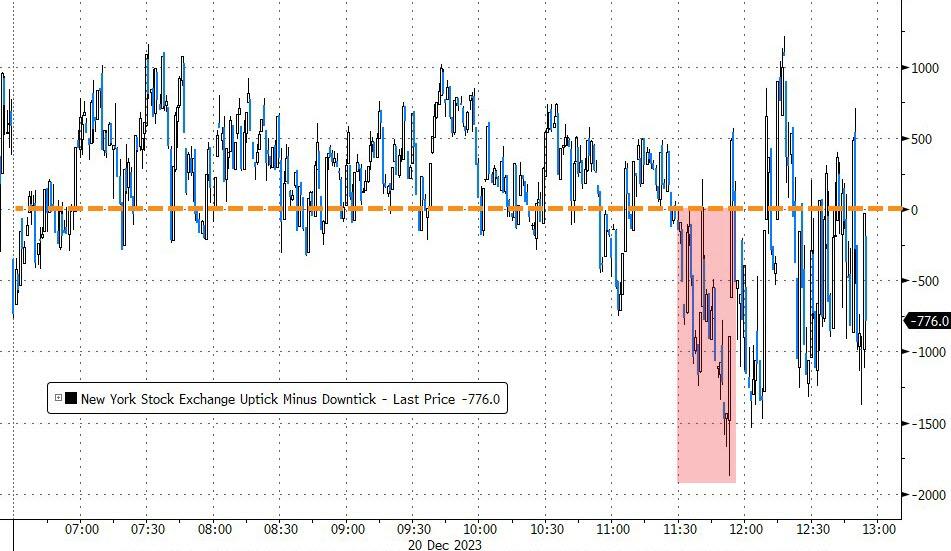
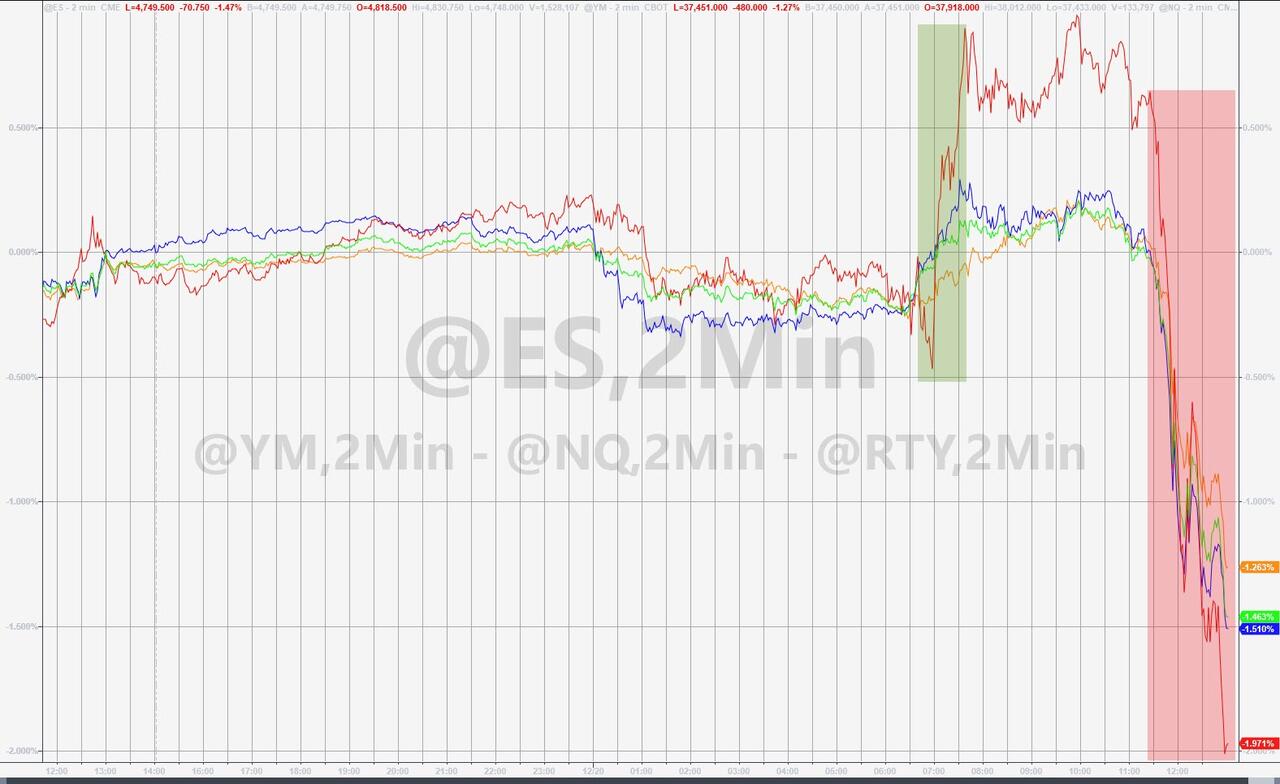
Today, nearly a million of these options on the S&P 500 expired with a strike price of $475. When the market reached that level, the selling pressure intensified, and the market hit a speed bump. The largest sell program since July sent stocks tumbling.
ZeroHedge summed up today’s action like this:
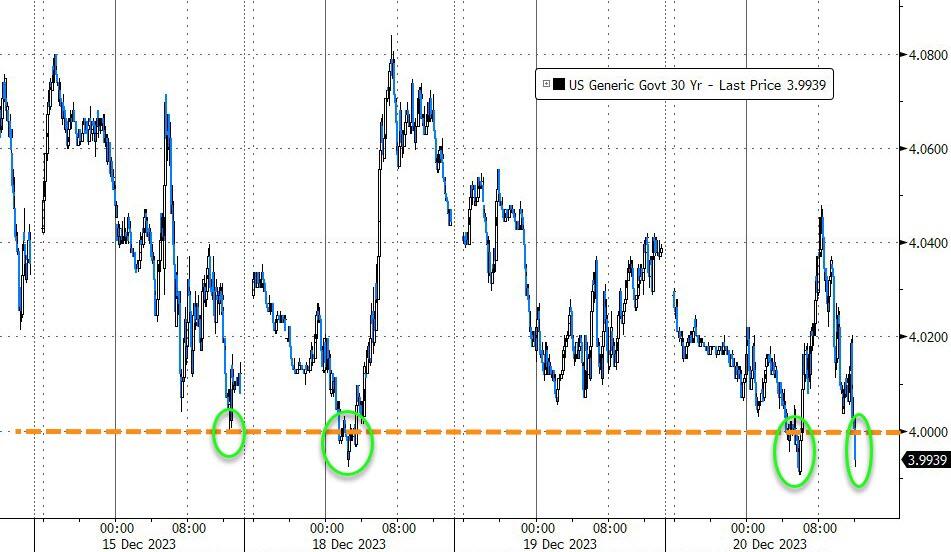
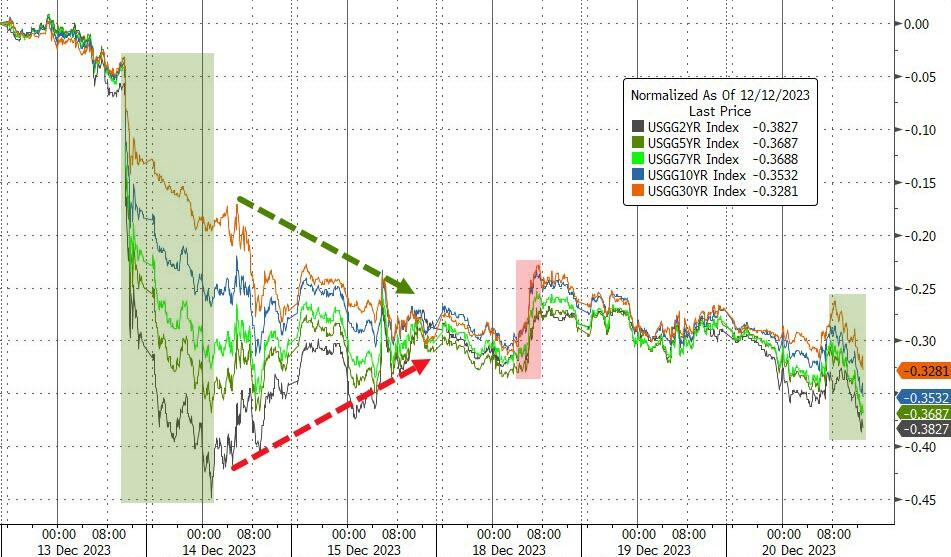
30-year Treasury yield fell below 4.00% for the first time since July
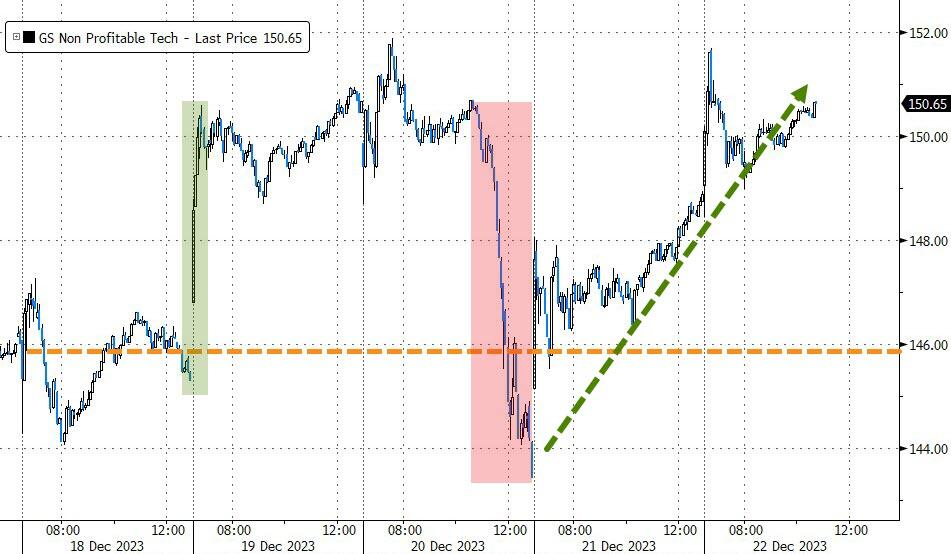
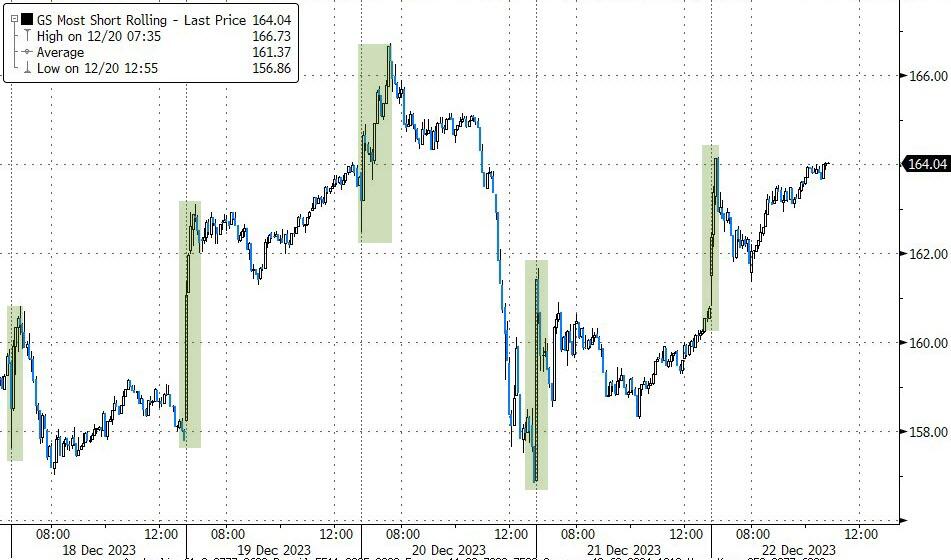
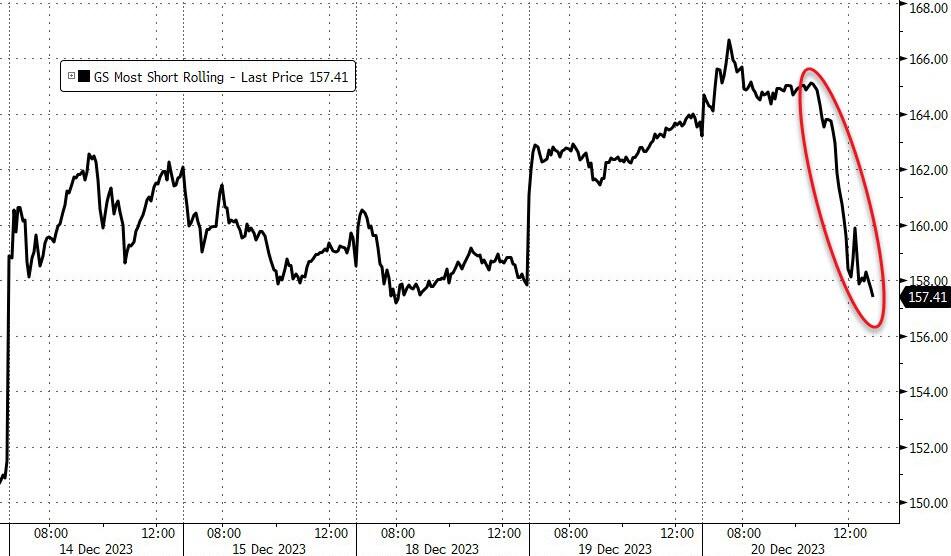
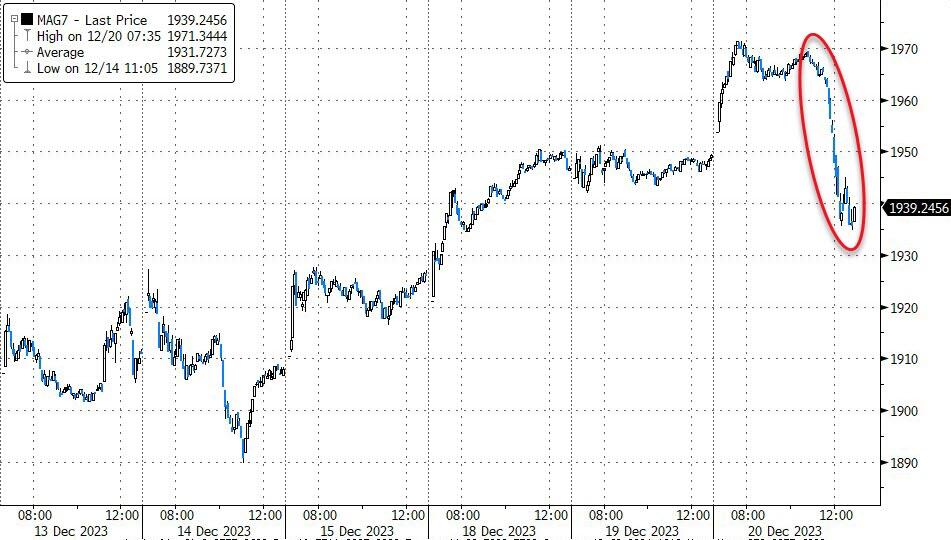
The short sellers finally had a reason to celebrate, as the most hated stocks suffered their biggest daily drop since February. Even the “Magnificent Seven” stocks couldn’t resist the selling wave and got dumped.
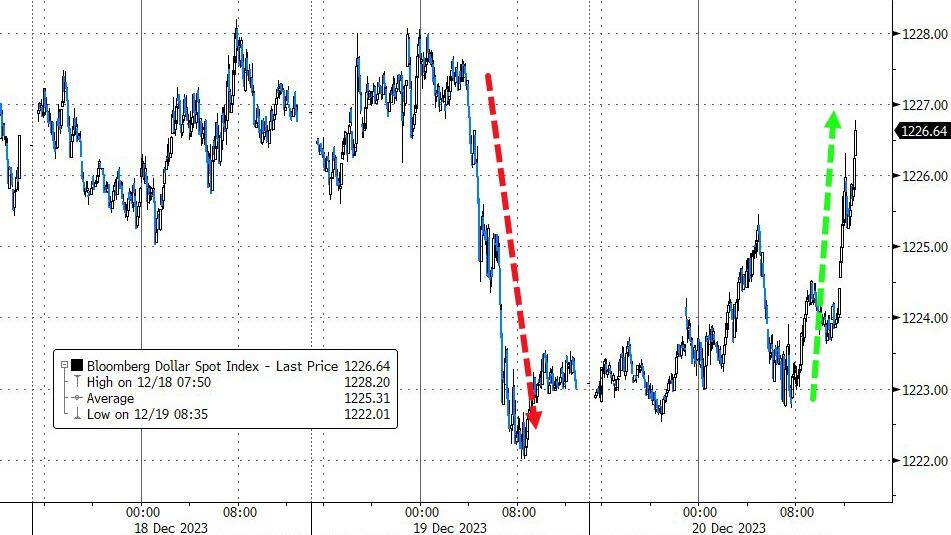
The dollar bounced back and erased most of yesterday’s losses, which weighed on gold. The precious metal slid lower. Oil also closed lower after briefly breaking above $75 yesterday.
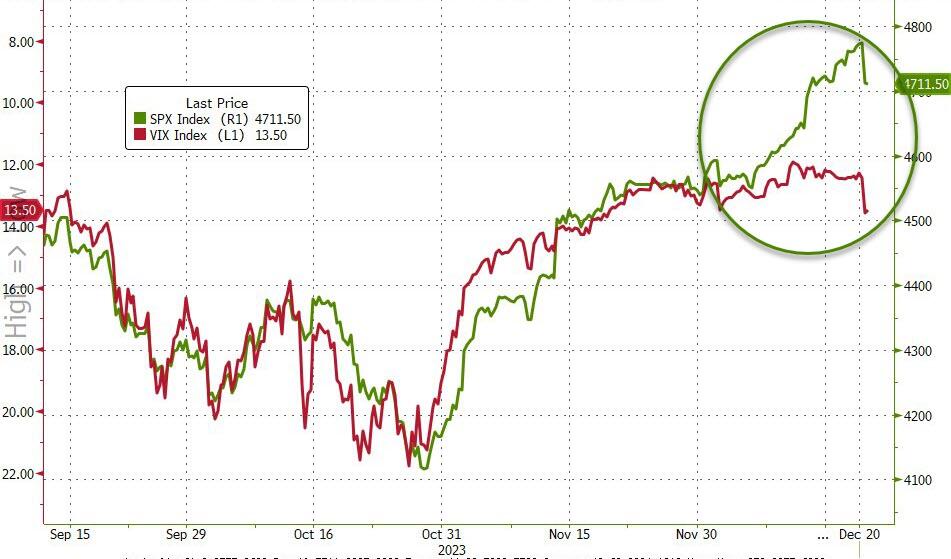
If the volatility index (VIX) is any indication, there could be more trouble ahead for the market, as this chart shows.
The Fed’s dovish statement last week sparked a rally that pushed the S&P 500 close to a record high.
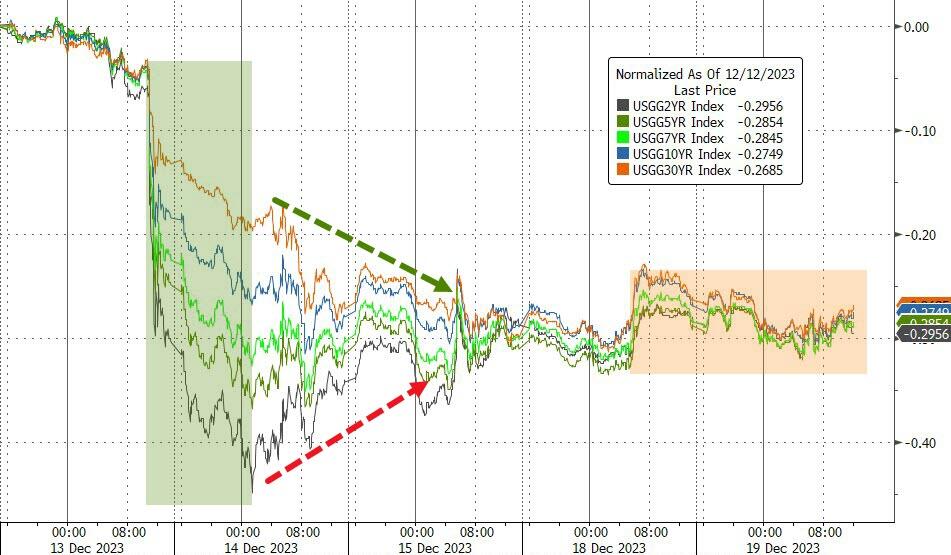
Three rate cuts in 2024, cooling inflation, and lower Treasury yields boosted the market mood in this seasonally strong period for stocks. The Fed thinks it has tamed inflation, but it may be in for a rude awakening.
Oil prices jumped as Yemeni militants attacked ships in the Red Sea, prompting BP to halt its Suez Canal shipments. The U.S. sent more naval forces to protect the vessels.
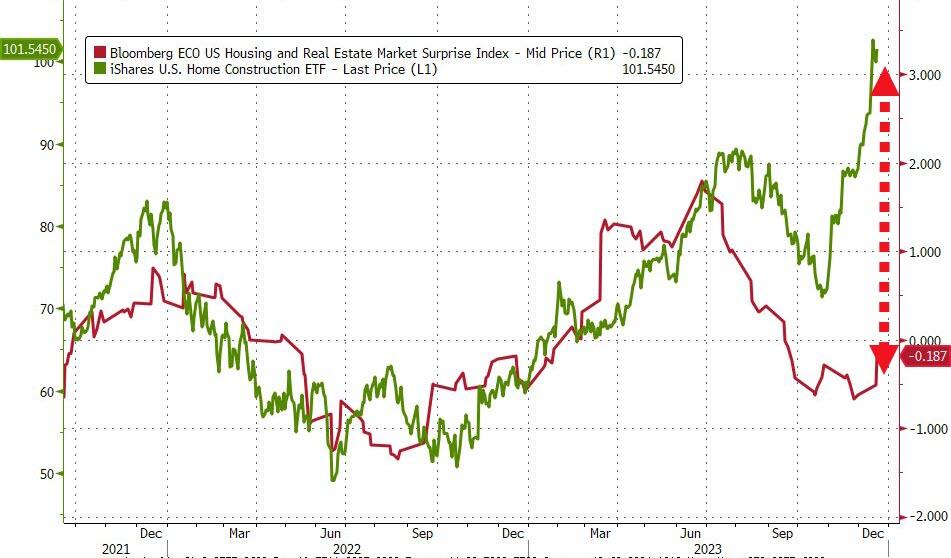
Housing starts soared unexpectedly, lifting homebuilder stocks. Is this a sign of a housing recovery or a fluke?
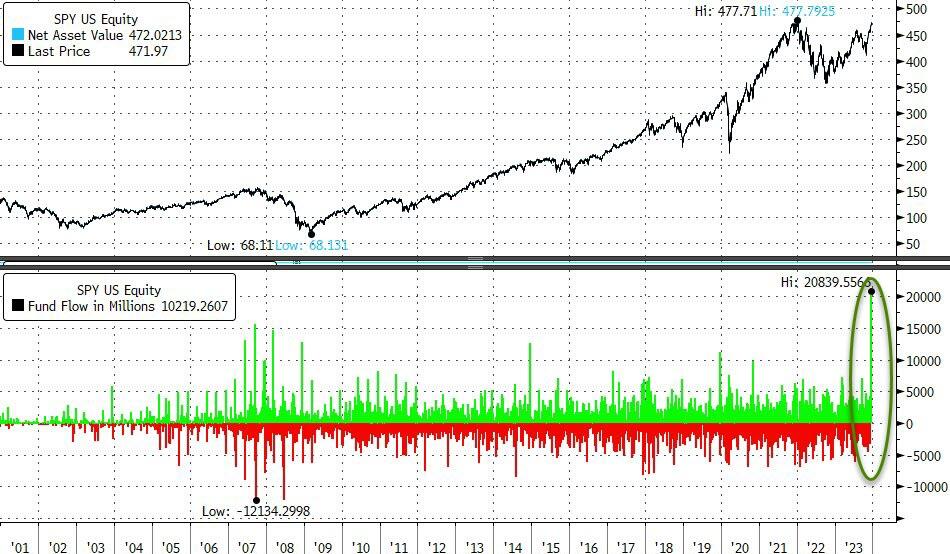
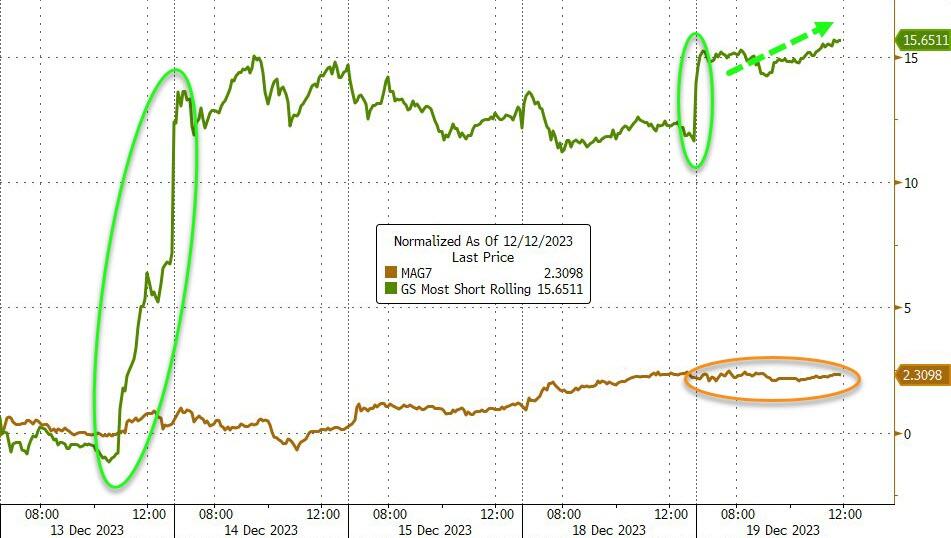
SPY, the biggest S&P 500 ETF, saw record inflows of over $40BN in four days, thanks to Powell’s pivot. The most shorted stocks also surged 16% as the bears got squeezed. Bond yields were stable, while gold rose amid uncertainty.
But lower rates are not always good for the market. Lance Roberts, a market guru, points out that the average market drop after a rate cut was 27.25% since 1970. The last three times were even worse.
So, is this rally a gift from the Fed or a trap for the unwary?