Debt Ceiling Deal in Doubt, Markets Waver

Ulli Market Commentary Contact

[Chart courtesy of MarketWatch.com]

  1. Moving the markets

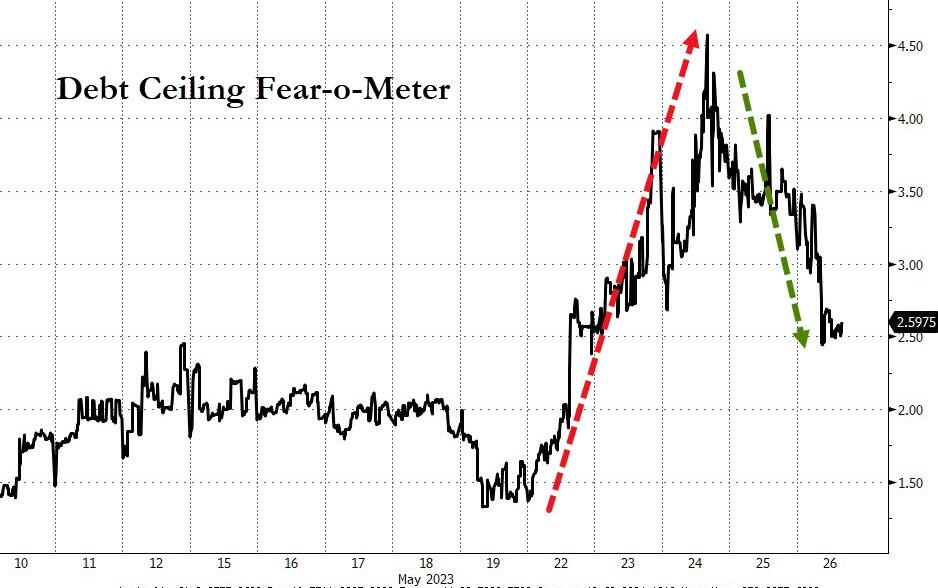
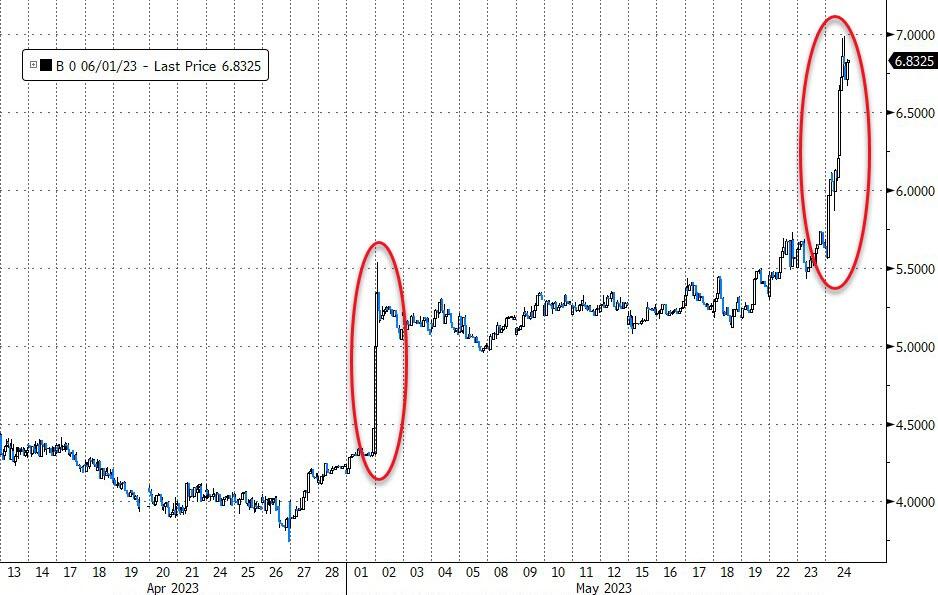
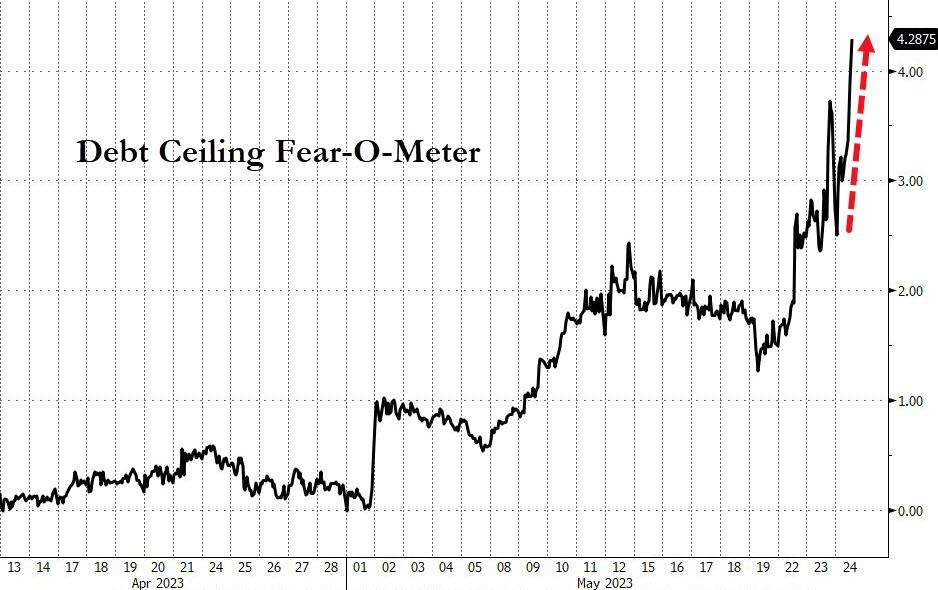
The debt ceiling drama is far from over. Even though the two parties have reached a tentative deal, they still need to pass it in Congress by tomorrow. But many lawmakers are not in town, and some Republicans are not on board. This could spell trouble for the compromise bill.

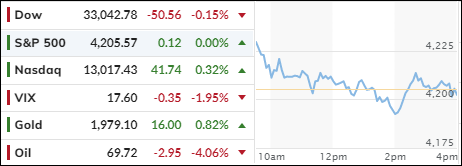
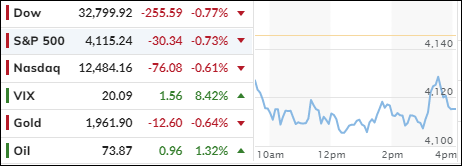
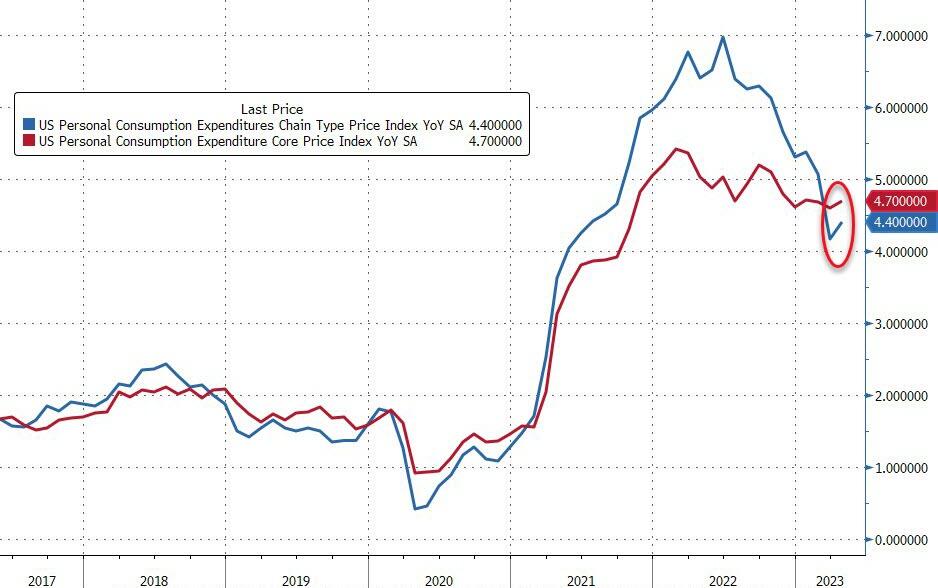
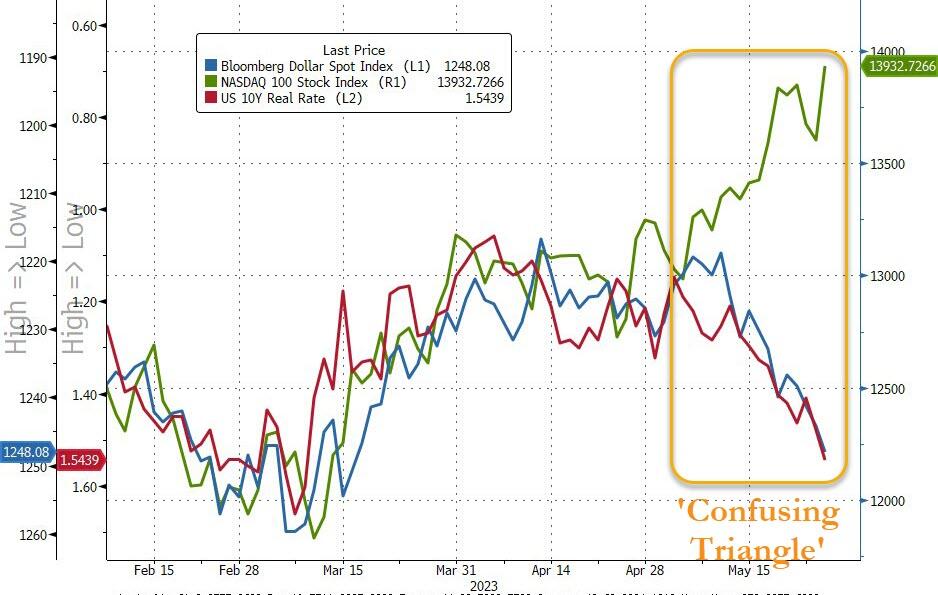
The markets were optimistic at first, but then reality kicked in. Traders realized that the deal is not a done deal, and that the Fed is still looming large. The Fed’s Barkin admitted that inflation is not going away anytime soon, which raised fears of more rate hikes in June.

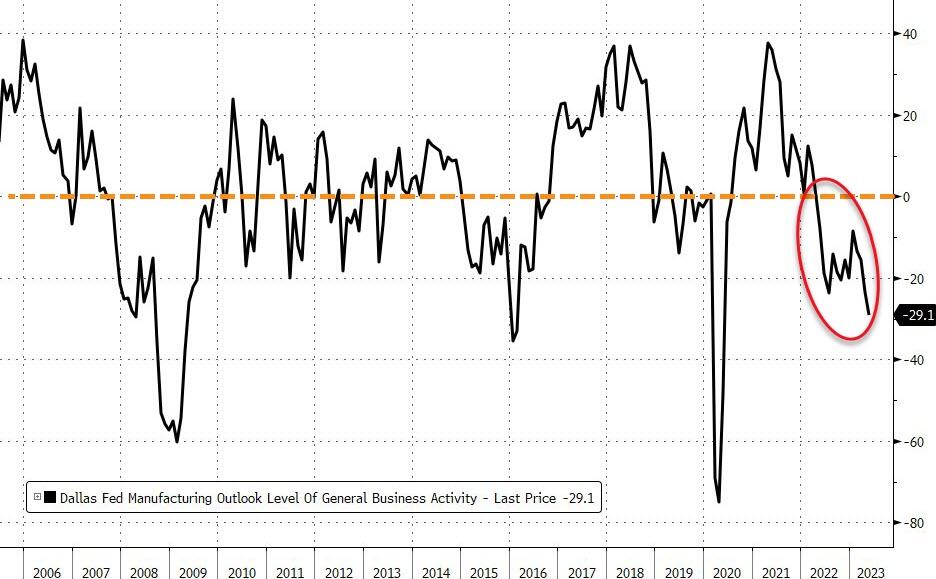
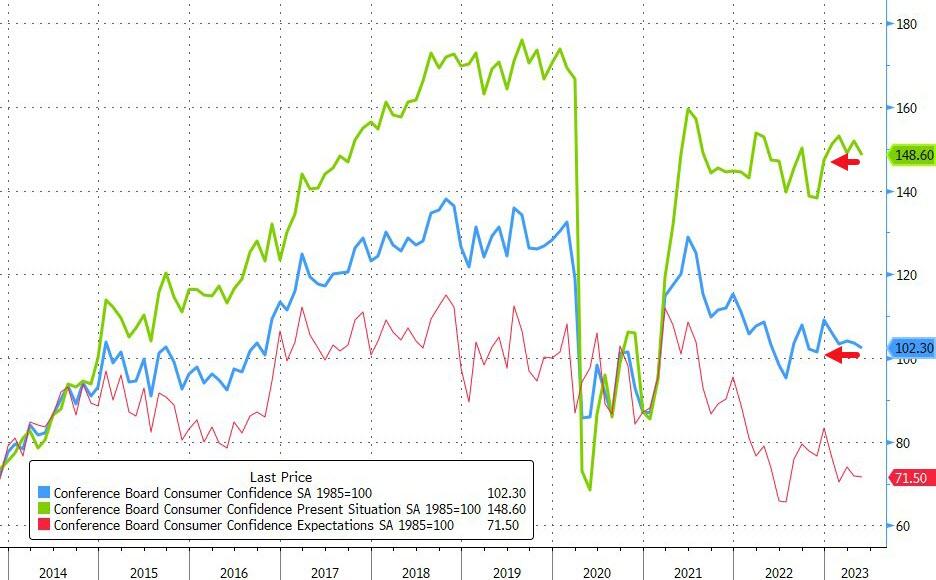
The economic data did not help either. The Dallas Fed Manufacturing Survey shrank for the 13th month in a row, consumer confidence fell to its lowest level since 2022, and home prices dropped for the first time in nine years. These are not signs of a strong economy.

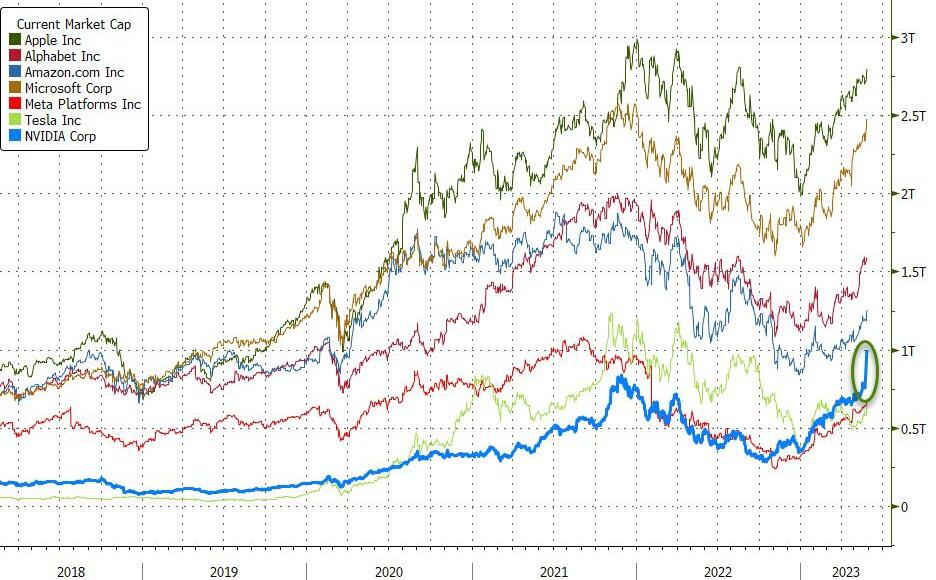
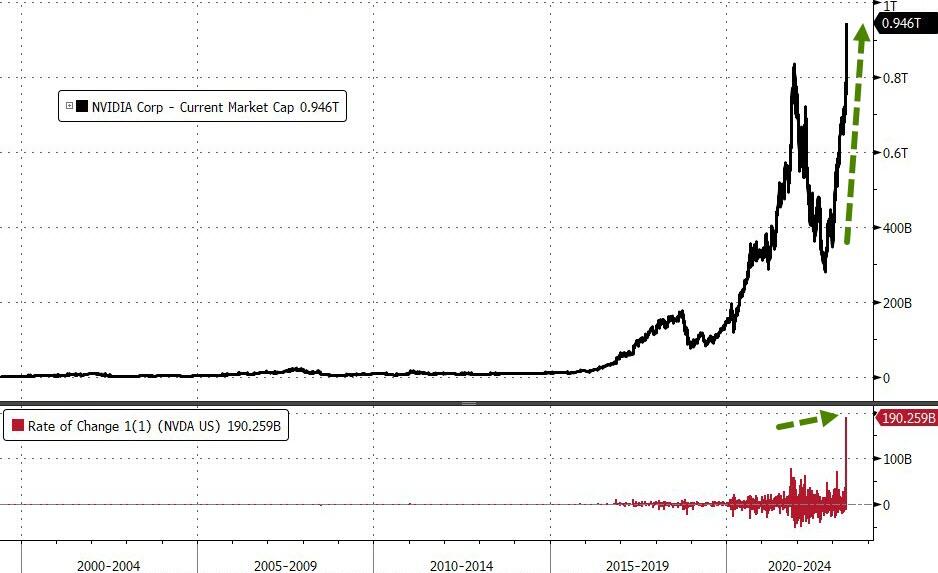
The only bright spot was the tech sector, especially the artificial intelligence (AI) stocks. Nvidia became the seventh company to join the $1 trillion club, thanks to its booming chip business.

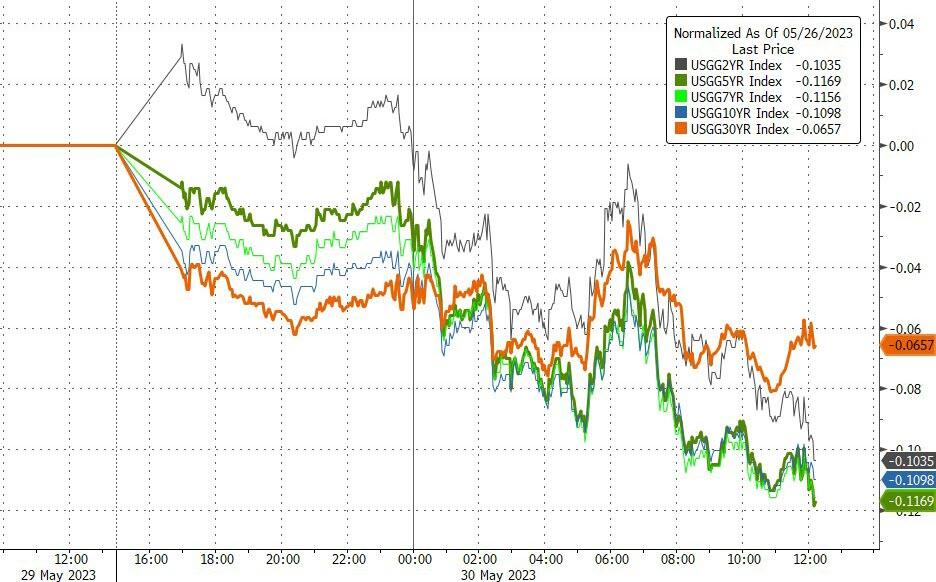
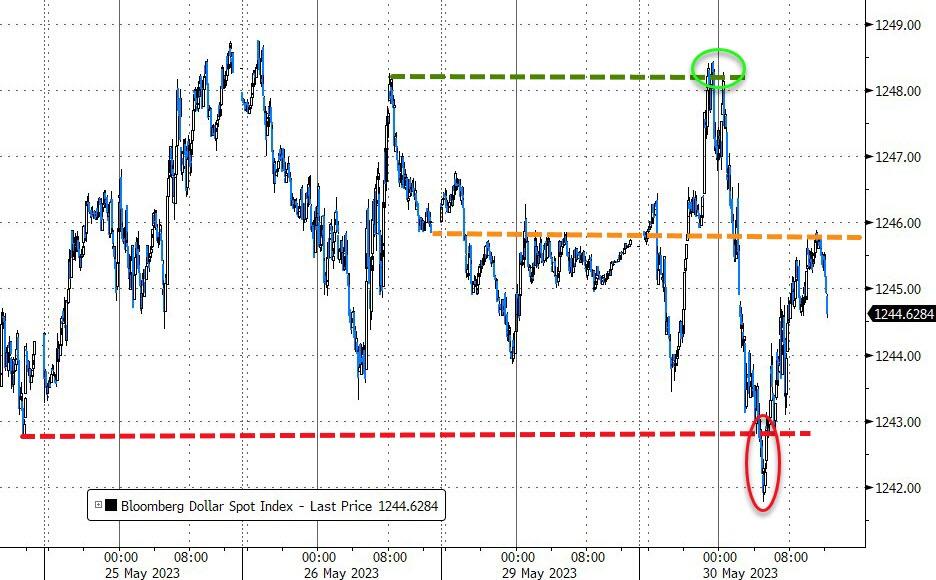
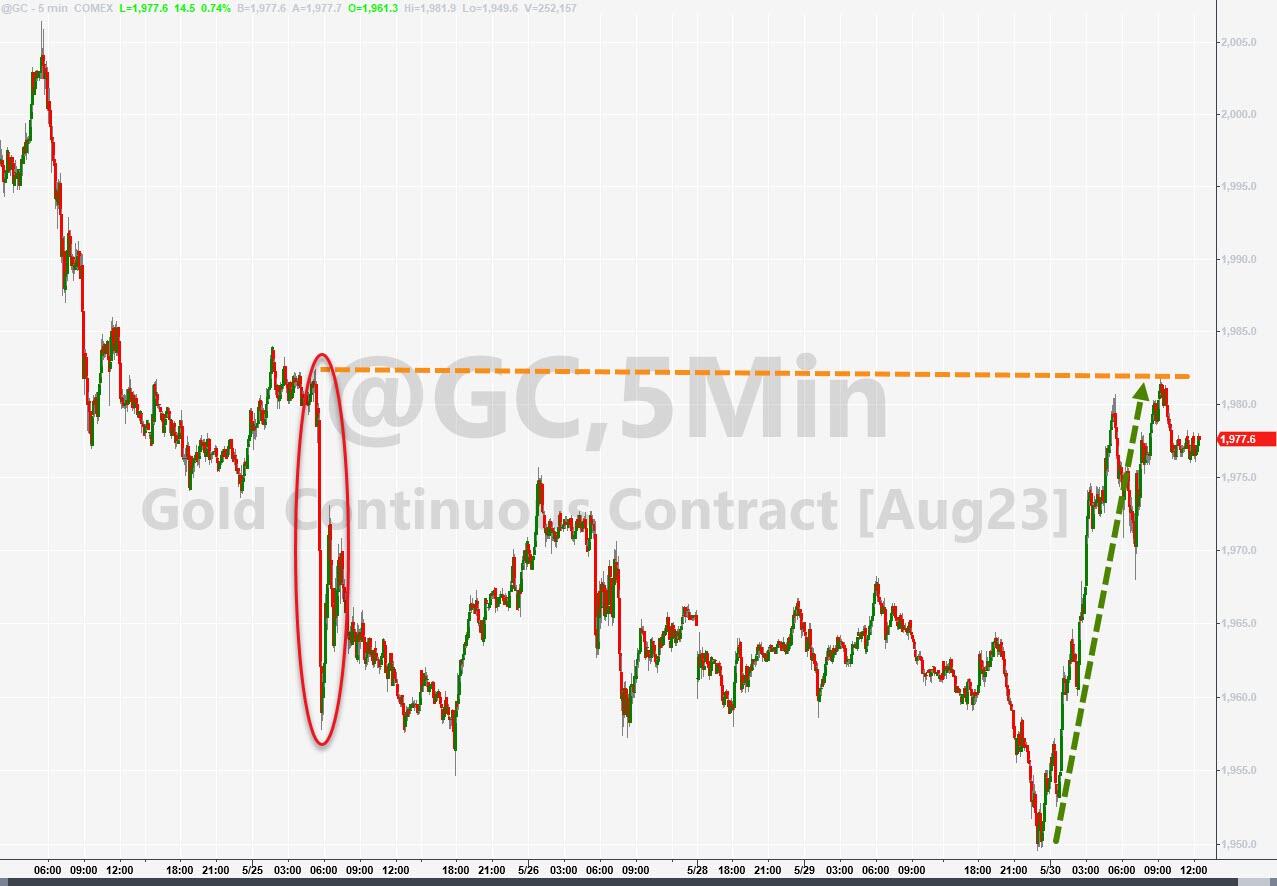
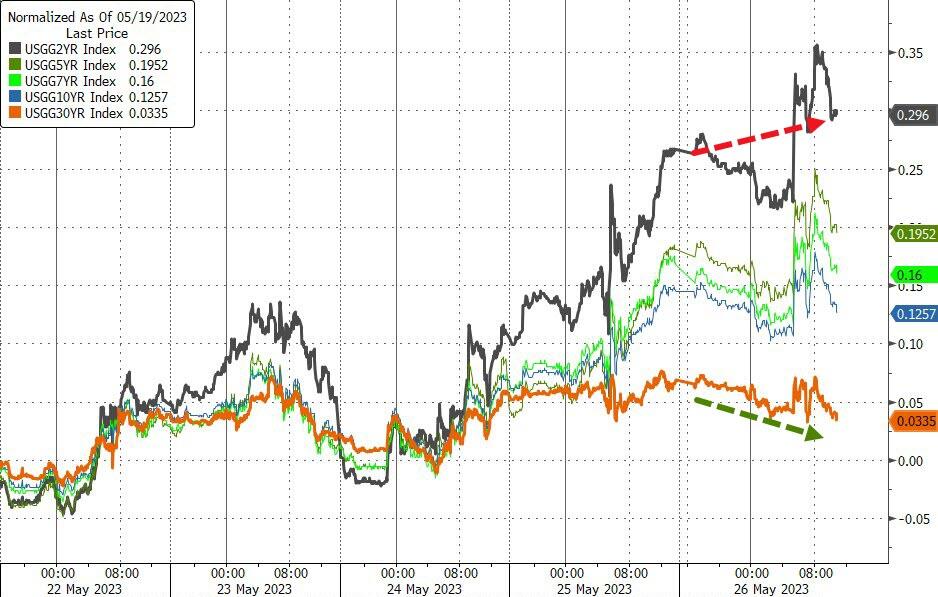
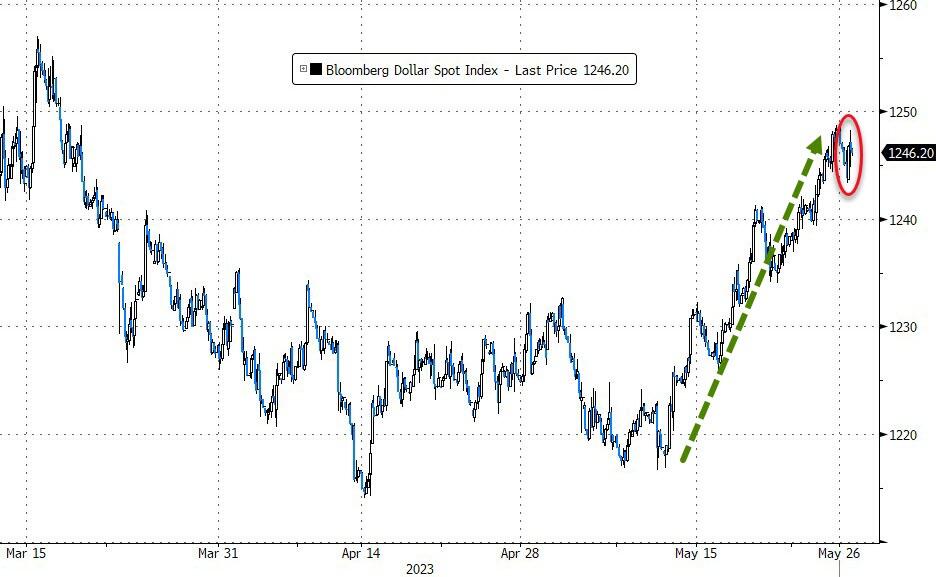
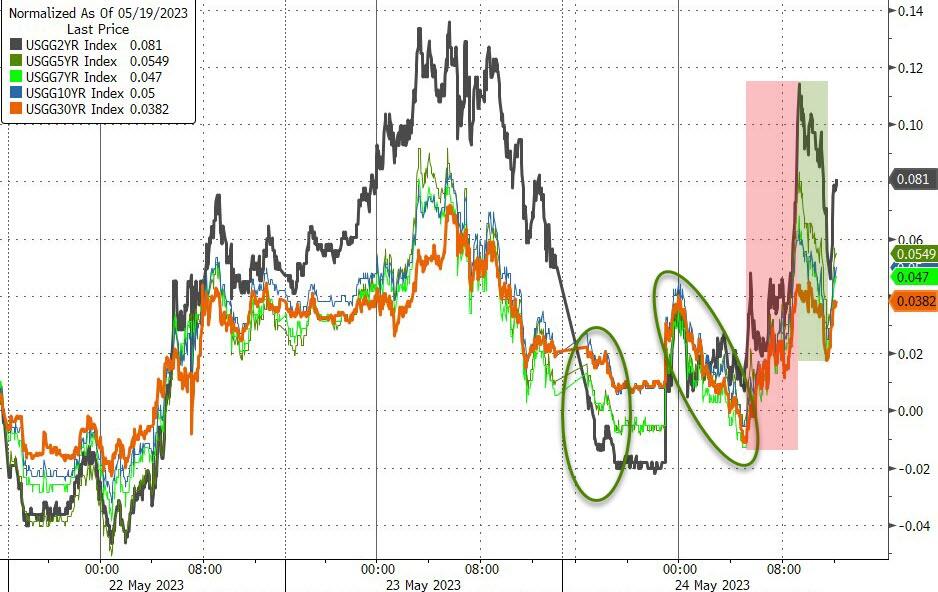
Bond yields fell, while the dollar wobbled. Gold finally got some love.

So, what’s next for the markets? It all depends on whether the debt ceiling deal gets done, and what the Fed does next. All investors should brace for more volatility and uncertainty in the coming days. Stay tuned for more updates.

Read More

ETFs On The Cutline – Updated Through 05/26/2023

Ulli ETFs on the Cutline Contact

Below, you can evaluate the latest High-Volume ETF Cutline report, which shows how far above or below their respective long-term trend lines (39-week SMA) my currently tracked ETFs are positioned.

This report covers the HV ETF Master List from Thursday’s StatSheet and includes 312 High Volume ETFs, defined as those with an average daily volume of more than $5 million, of which currently 138 (last report: 173) are hovering in bullish territory. The yellow line separates those ETFs that are positioned above their trend line (%M/A) from those that have dropped below it.

Take a look:                                                                   

The HV ETF Master Cutline Report

In case you are not familiar with some of the terminology used in the reports, please read the Glossary of Terms. If you missed the original post about the Cutline approach, you can read it here.

ETF Tracker Newsletter For May 26, 2023

Ulli ETF Tracker Contact

ETF Tracker StatSheet          

You can view the latest version here.

MARKETS RALLY ON DEBT DEAL PROGRESS, BUT BEWARE OF FED, INFLATION AND BANKING BUGS

[Chart courtesy of MarketWatch.com]

  1. Moving the markets

The markets were in a cheerful mood for the second day in a row, as hopes rose for a debt ceiling deal that would prevent a default. The S&P 500 recovered from its early-week slump and gained 0.4%.

McCarthy said that negotiators made some headway last night and were close to agreeing on a two-year debt limit increase, but he didn’t spill the beans on the details. The Debt Ceiling Fear-o-Meter dropped a few notches as a result.

However, some analysts warned that the Fed might spoil the party by keeping its foot on the brake until the end of summer and then slamming on the gas next year with bigger rate cuts. Remember when they said inflation was just a passing phase?

The Fed’s favorite inflation gauge, the PCE Deflator, didn’t help their case either. It came in hotter than expected and pushed the annual inflation rate higher. The only silver lining was that real income, adjusted for CPI, edged up slightly in April. But don’t get too excited, it might change later.

US economic data beat expectations this week, as ZeroHedge noted, probably because some inflation indicators showed signs of cooling off.

The Nasdaq enjoyed the tech stock rally, especially Nvidia, and left Small Caps in the dust. It outperformed them by a factor of eight. The last time this happened, it didn’t end well.

Regional banks bounced back earlier in the week but lost steam by the close, ahead of tonight’s crucial deposit data. This could reveal the next banking bug that needs to be squashed.

Bond yields climbed higher today, after falling all week, and broke up with tech stocks. They used to move together, but now they’re going their separate ways. How long can this last?

The US Dollar had a good week and rose for the third time in a row, but it faced some resistance towards the end. Gold had a bad week and dipped lower, but it managed to end on a positive note today.

This reminds me of the summer of 2011, when a debt ceiling deal was hanging by a thread. Let’s hope history doesn’t repeat itself.

Read More

Weekly StatSheet For The ETF Tracker Newsletter – Updated Through 05/25/2023

Ulli ETF StatSheet Contact

ETF Data updated through Thursday, May 25, 2023

Methodology/Use of this StatSheet:

1. From the universe of over 1,800 ETFs, I have selected only those with a trading volume of over $5 million per day (HV ETFs), so that liquidity and a small bid/ask spread are assured.

2. Trend Tracking Indexes (TTIs)

Buy or Sell decisions for Domestic and International ETFs (section 1 and 2), are made based on the respective TTI and its position either above or below its long-term M/A (Moving Average). A crossing of the trend line from below accompanied by some staying power above constitutes a “Buy” signal. Conversely, a clear break below the line constitutes a “Sell” signal. Additionally, I use a 12% trailing stop loss on all positions in these categories to control downside risk.

3. All other investment arenas do not have a TTI and should be traded based on the position of the individual ETF relative to its own respective trend line (%M/A). That’s why those signals are referred to as a “Selective Buy.” In other words, if an ETF crosses its own trendline to the upside, a “Buy” signal is generated. Here too, I recommend trailing sell stop of 12%, or less, depending on your risk tolerance.

If you are unfamiliar with some of the terminology, please see Glossary of Terms and new subscriber information in section 9.     

1. DOMESTIC EQUITY ETFs: BUY — since 12/01/2022

Click on chart to enlarge

Our main directional indicator, the Domestic Trend Tracking Index (TTI-green line in the above chart) has just slipped back below its long-term trend line (red) by -1.28% but remains in “Buy” mode for the time being.

Read More

Nvidia’s Record-Breaking Day Overshadows Debt Ceiling Crisis

Ulli Market Commentary Contact

[Chart courtesy of MarketWatch.com]

  1. Moving the markets

Nvidia stole the show today with its stellar earnings report, which sent its stock soaring 25% and added $200 billion to its market value. That’s the biggest one-day gain for any US company ever. The chipmaker also raised its outlook for the next quarter, thanks to the booming demand for artificial intelligence (AI) solutions.

The news lifted other chip stocks as well, but failed to inspire the rest of the market, which remained bogged down by the debt ceiling drama, the banking woes, the rising rates, and the inflation fears. Only 42% of the S&P 500 stocks are above their 200-day moving averages, indicating a narrow rally.

Speaker McCarthy said there was some “progress” in the debt talks, but also “major headwinds” to overcome. Bond yields spiked higher, pushing the US dollar to a six-week high and gold to a two-month low.

It’s hard to make sense of this market, where tech stocks can defy gravity while everything else is sinking. Something has to give eventually.

Read More

No Deal, No Hope: Markets Sink on Debt Ceiling Impasse

Ulli Market Commentary Contact

[Chart courtesy of MarketWatch.com]

  1. Moving the markets

The markets were in a frenzy as the debt ceiling deadline loomed closer. Speaker McCarthy blamed the other side for delaying the talks and hoped for some progress today. Yeah, right.

The uncertainty drove the investors to dump their stocks and bonds, sending the major indexes lower for the second day in a row. Everything was in the red, and no one wanted to stick around.

The Fed minutes showed some doubt about raising rates in June. It all depended on the data. But who cared about the data when the government was on the verge of defaulting?

Treasury Secretary Yellen warned of market stress and urged Congress to act fast. She said the Administration was not planning for a default, but for a deal. Good luck with that.

The June 1st T-Bill yield skyrocketed above 7%, showing how scared the market was of a default. The debt ceiling Fear-O-Meter also hit a record high, as ZeroHedge put it.

A late rally eased some of the pain, but it was too little, too late. Bond yields ended higher, the dollar edged up, and gold slipped 0.64%.

Read More