
- Moving the markets
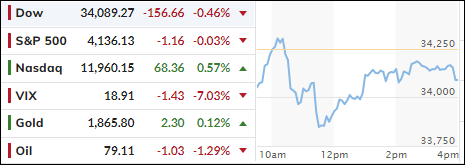
Wild chaotic swings during the early marked the uncertainty connected with the hotter-than-expected January CPI report. Stocks dumped, pumped, and dumped again before managing to recover steep early losses. The reversal pushed only the Nasdaq back above its respective unchanged line by a moderate margin.
The CPI rose 0.5% for the month, which translates to annual growth of 6.4%. Those number were higher than the expected 0.4% and 6.2% forecasts. Casting a further shadow on the report was December’s revision to show a small gain rather than a decline.
Even though the report was better than dreaded, it also caused anxiety due to the Fed likely not being willing to take its foot off the rate hike accelerator, as it now appears that inflation may not have peaked yet, which had been hoped for by the always optimistic Wall Street crowd.
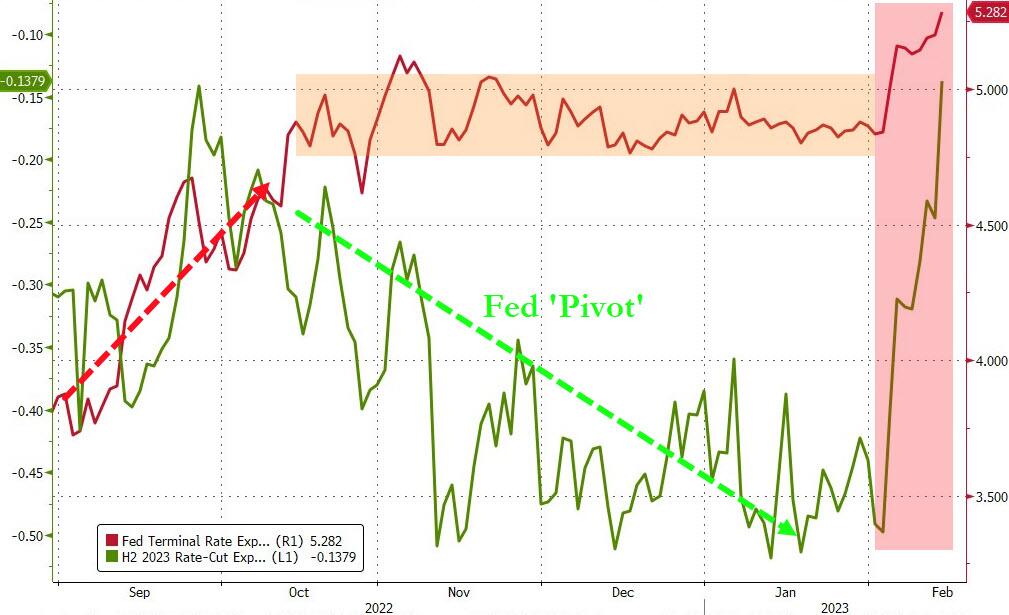
The Fed pivot narrative seems to have died a sudden death, at least for the moment, as rate cut expectations soared, thereby aligning with the Fed’s terminal expectations rate, which now has climbed to 5.3%, as ZeroHedge reported.
Traders did not have to wait long for the usual parade of Fed speakers (Barkin, Logan, Harker, Williams) to appear, to spew the words that Wall Street dislikes with a passion and has fought for months.
Some of the abbreviated highlights contained phrases I have quoted over the past year, things like “leaving Fed rates higher for longer,” “more hikes may be needed than previously seen,” “we are not done yet,” and “our work is not done yet.”
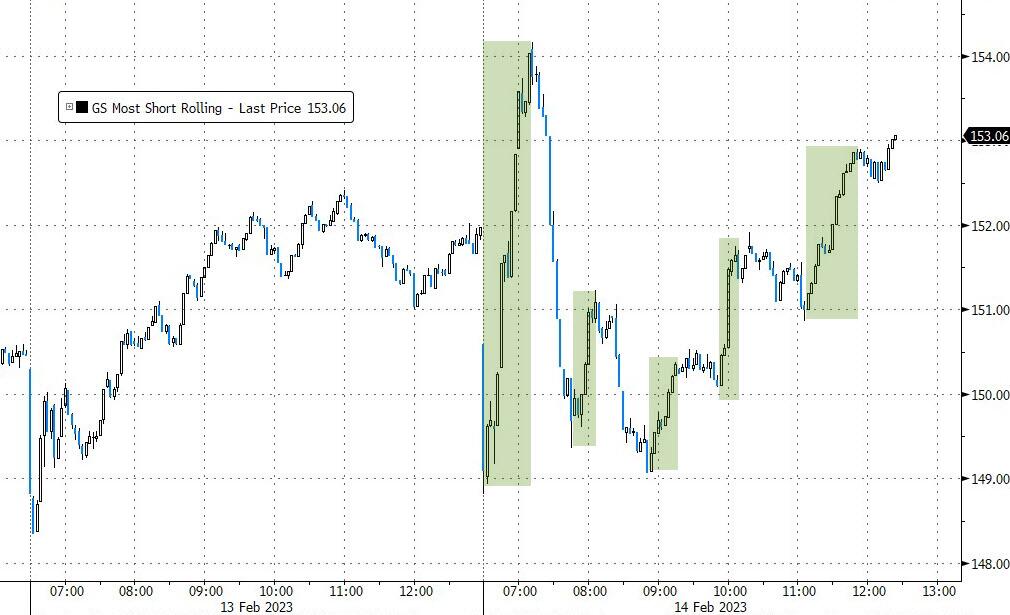
Several efforts to incite a short squeeze worked out in the end and propelled the indexes out of a deep hole.
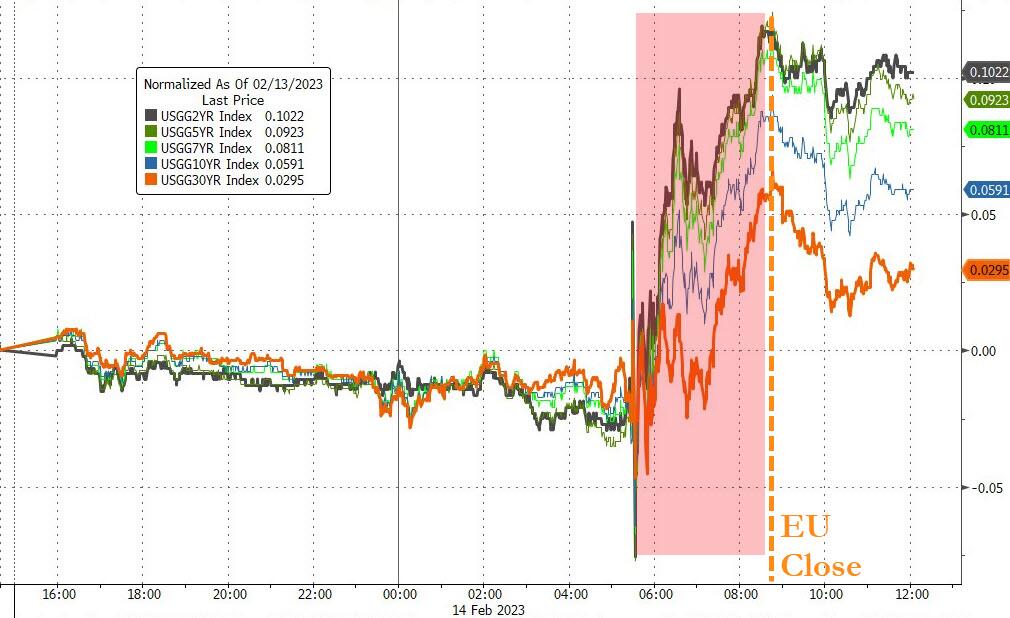
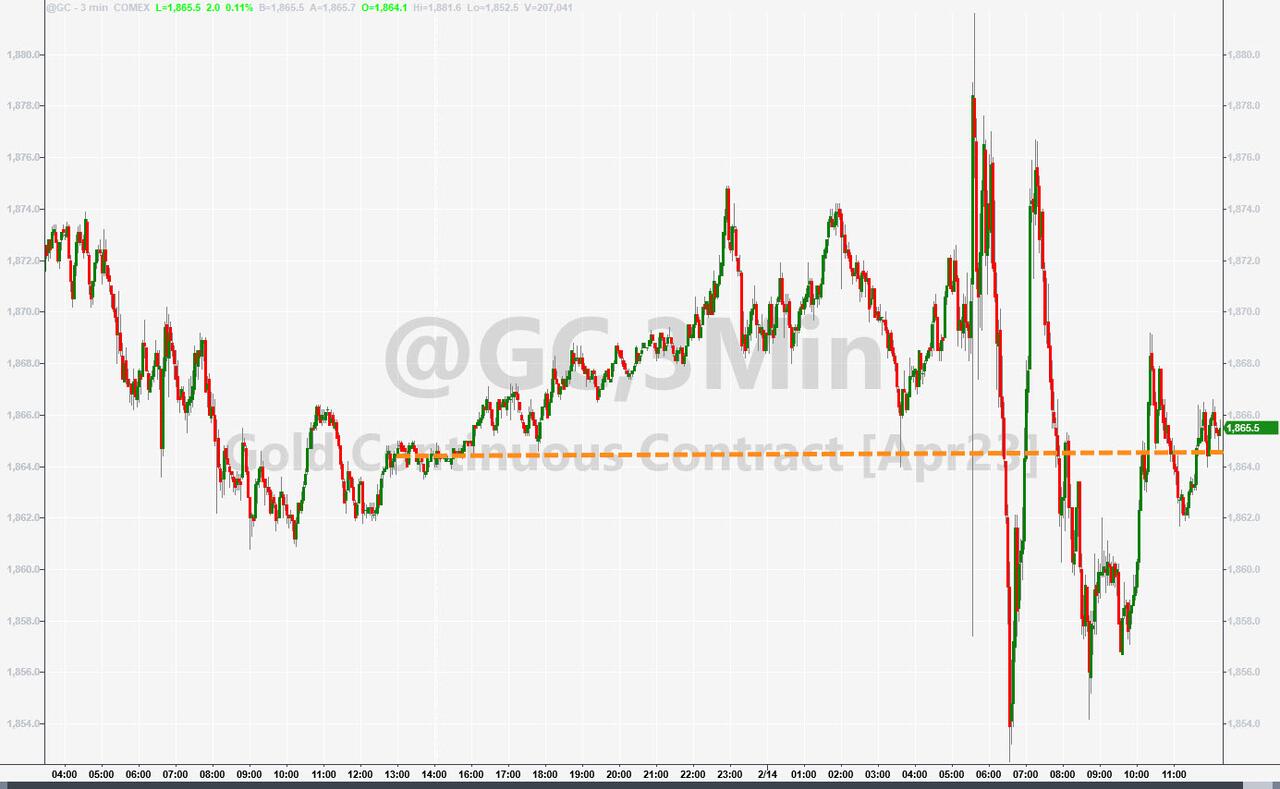
Bond yields soared, but the US Dollar only managed to roundtrip, with nothing gained, while Gold swung wildly and only edged out a tiny gain.
Retails sales are on the main menu tomorrow. A blowout positive number would be bad for equities, because it would confirm the Fed’s hawkishness to be the right cause of action for the time being.
2. “Buy” Cycle Suggestions
For the current Buy cycle, which started on 12/1/2022, I suggested you reference my most for ETFs selections. However, if you came on board later, you may want to look at the most current version, which is published and posted every Thursday at 6:30 pm PST.
I also recommend for you to consider your risk tolerance when making your selections by dropping down more towards the middle of the M-Index rankings, should you tend to be more risk adverse. Likewise, a partial initial exposure to the markets, say 33% to start with, will reduce your risk in case of a sudden directional turnaround.
We are living in times of great uncertainty, with economic fundamentals steadily deteriorating, which will eventually affect earnings negatively and, by association, stock prices. I can see this current Buy signal to be short lived, say to the end of the year, and would not be surprised if it ends at some point in January.
In my advisor practice, we are therefore looking for limited exposure in value, some growth and dividend ETFs. Of course, gold has been a core holding for a long time.
With all investments, I recommend the use of a trailing sell stop in the range of 8-12% to limit your downside risk.
3. Trend Tracking Indexes (TTIs)
Our TTIs were mixed with the Domestic one slipping and the International one gaining.
This is how we closed 02/14/2023:
Domestic TTI: +7.93% above its M/A (prior close +8.14%)—Buy signal effective 12/1/2022.
International TTI: +10.00% above its M/A (prior close +9.84%)—Buy signal effective 12/1/2022.
All linked charts above are courtesy of Bloomberg via ZeroHedge.
Contact Ulli