
- Moving the markets
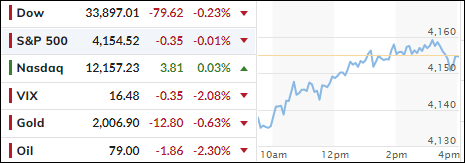
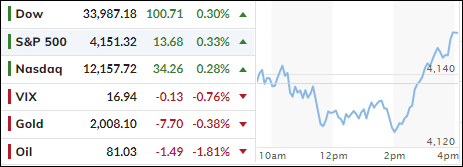
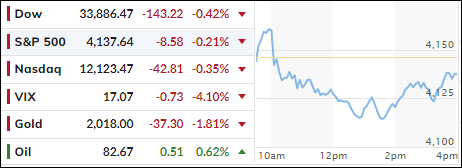
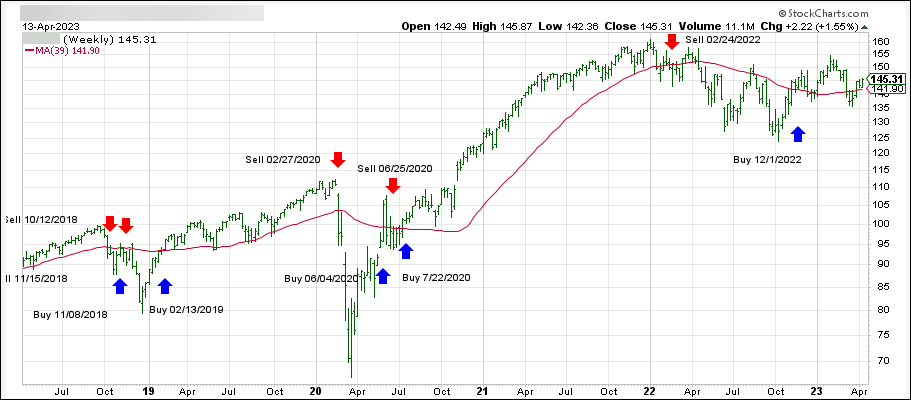
Today’s session had all the excitement that I usually experience when I watch grass grow or paint dry, as the major indexes meandered without conviction and ended up around their respective unchanged lines—again.
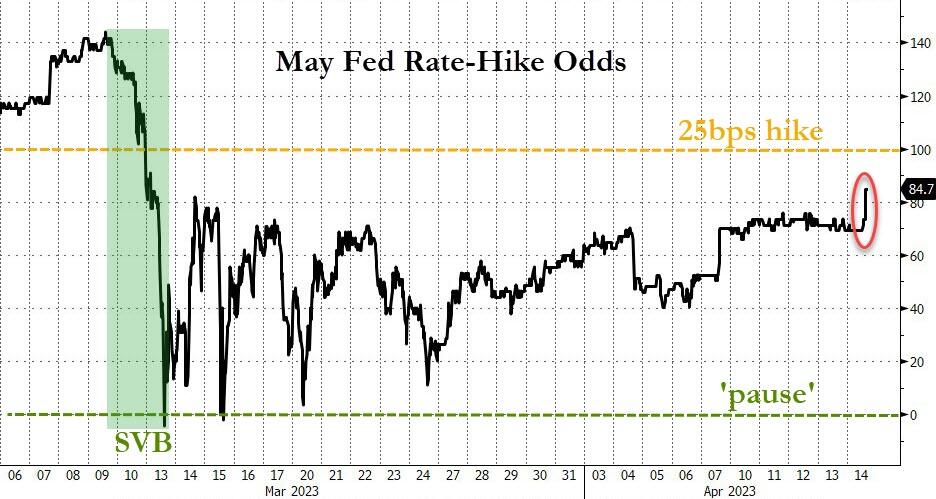
Despite another loaded earnings day kicking into full swing, as MarketWatch called it, traders simply found something wrong with the results. The lack of forecasts from major companies kept Wall Street mired in uncertainty, while the outlook for the Fed executing another 0.25% rate hike at the beginning of May did nothing to inspire bullish sentiment.
Considering that the S&P 500 has only moved 4 points higher this week clearly demonstrates that a new driver is needed to pull the markets out of their current ho-hum environment.
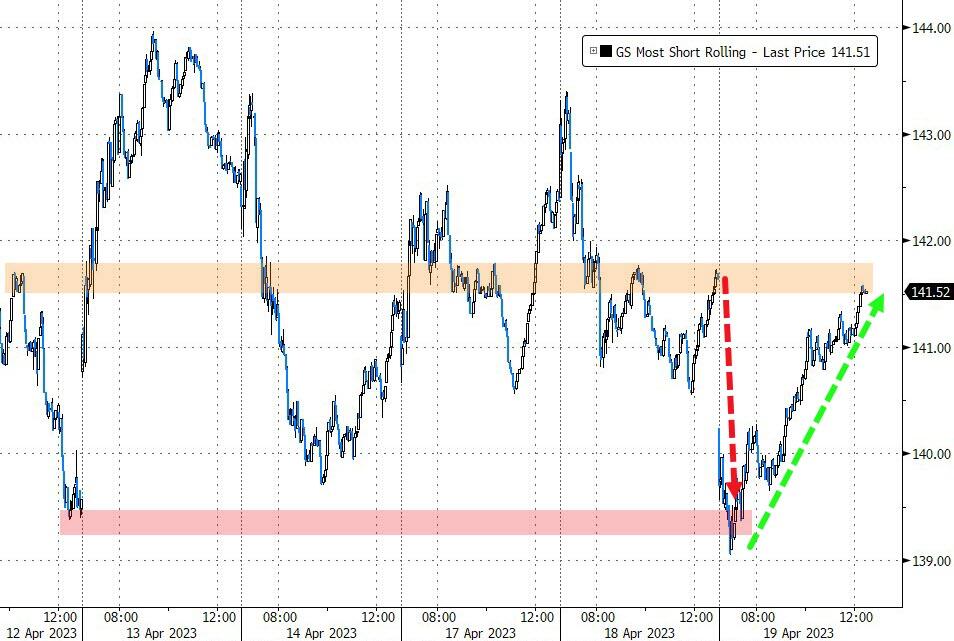
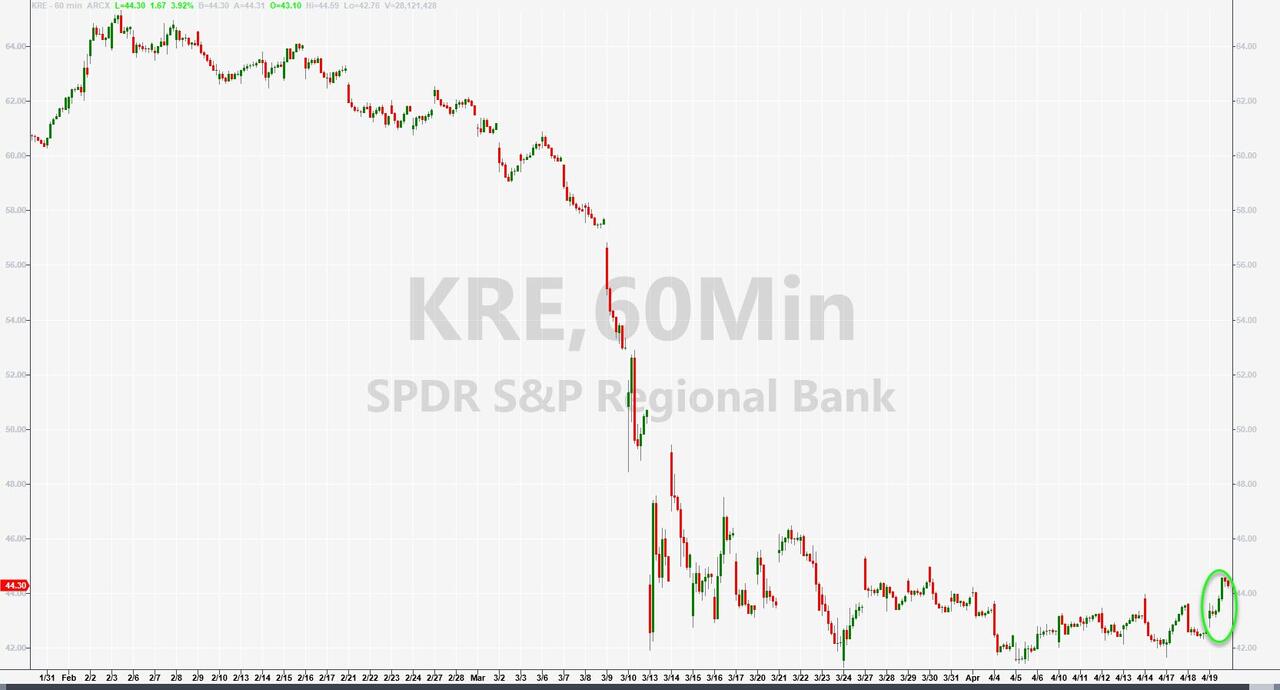
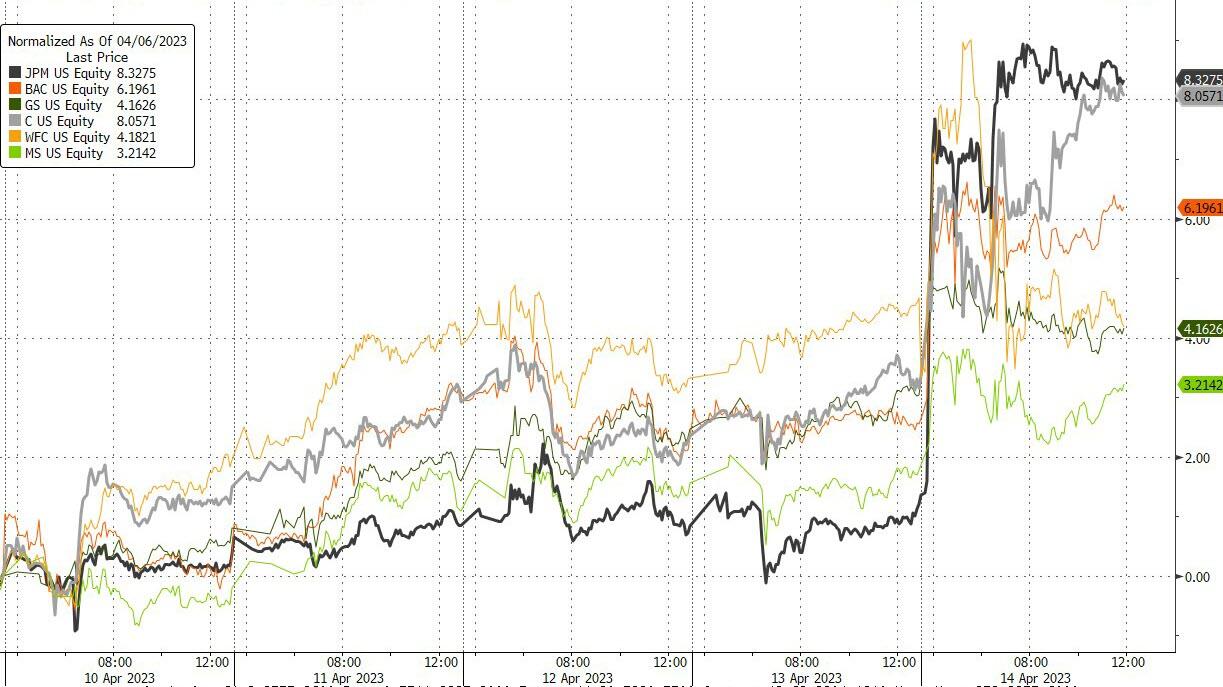
Even the most shorted stocks did nothing but roundtrip, but the KRE banking index showed signs of life by bouncing to two-week highs, but it has a long way to go to make up recent losses.
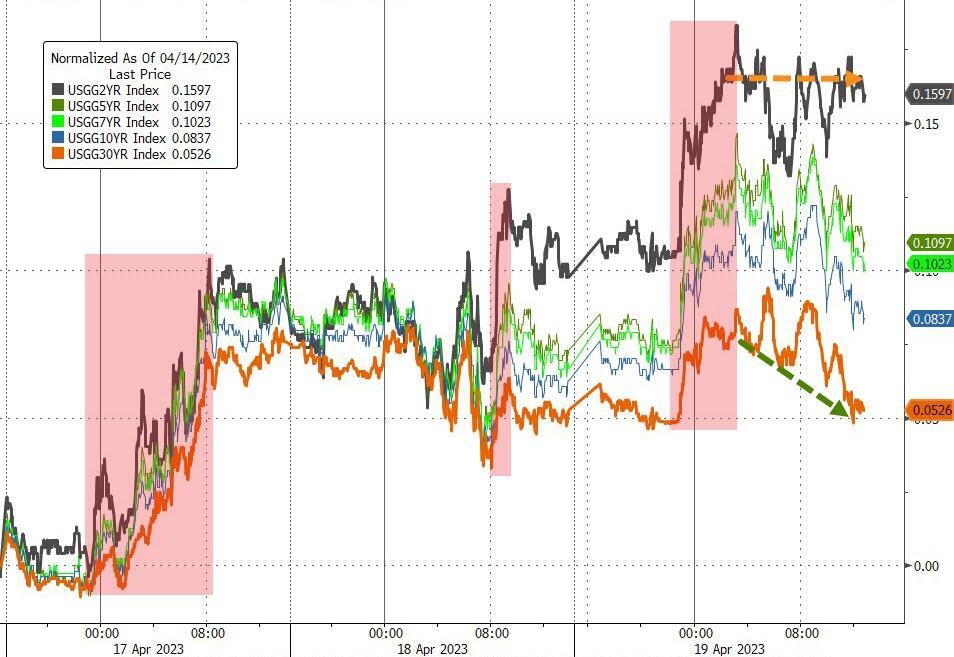
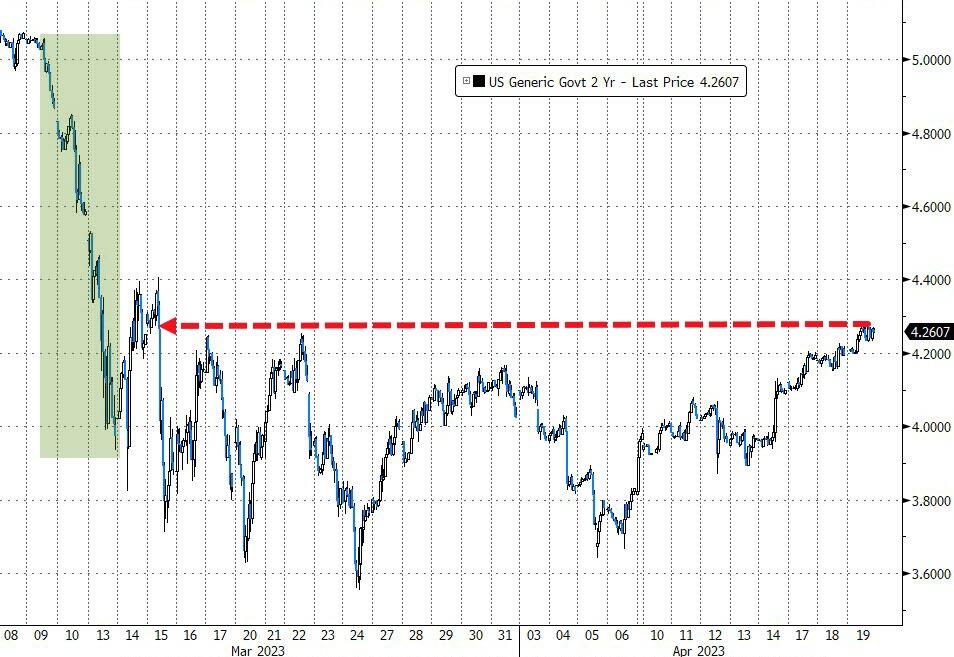
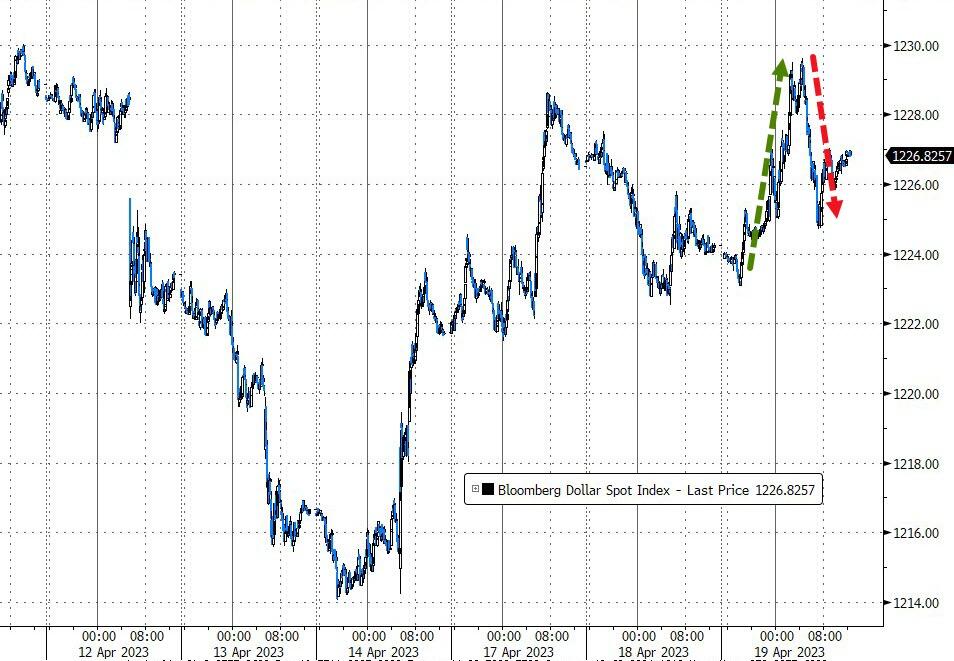
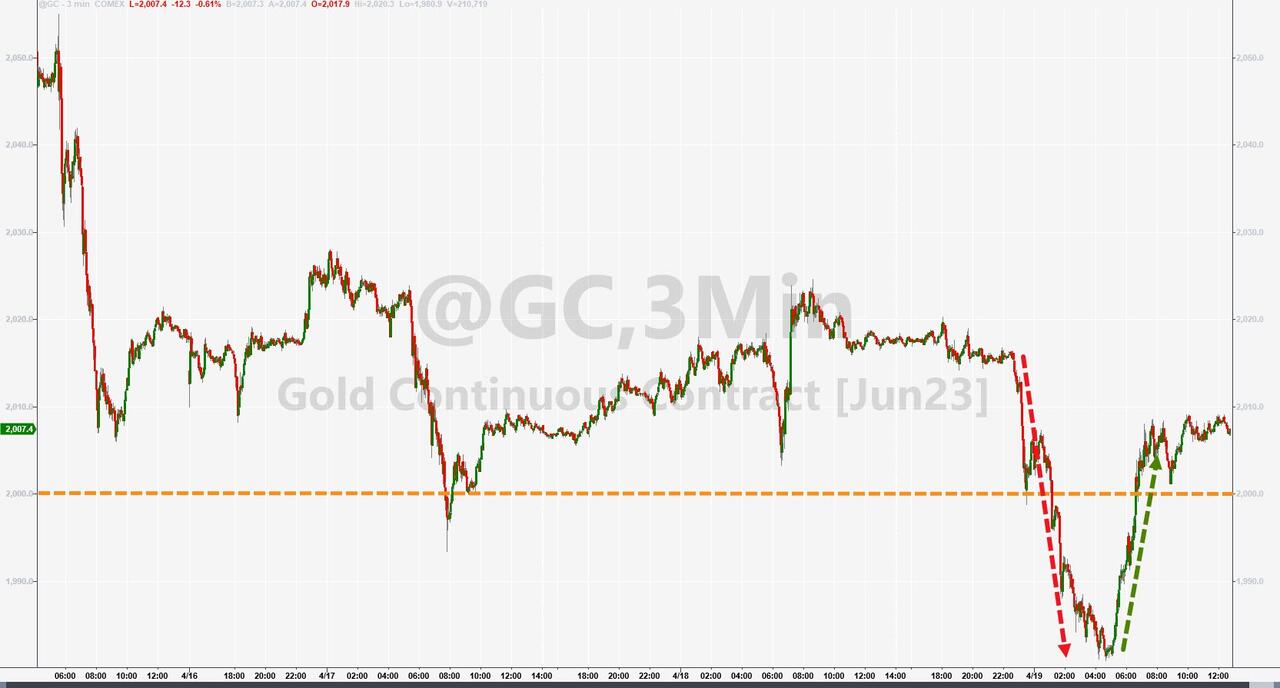
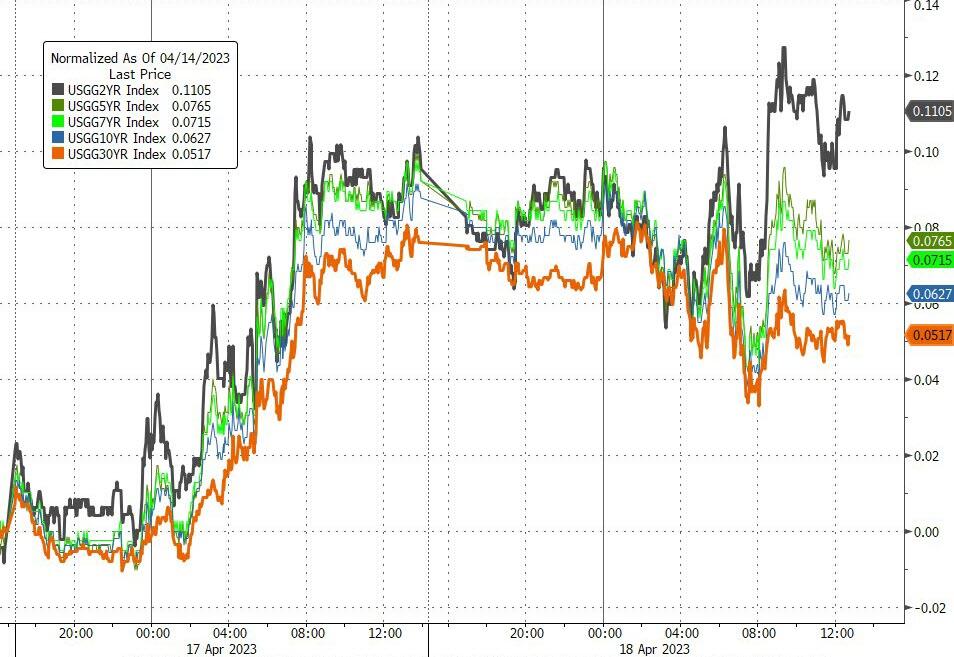
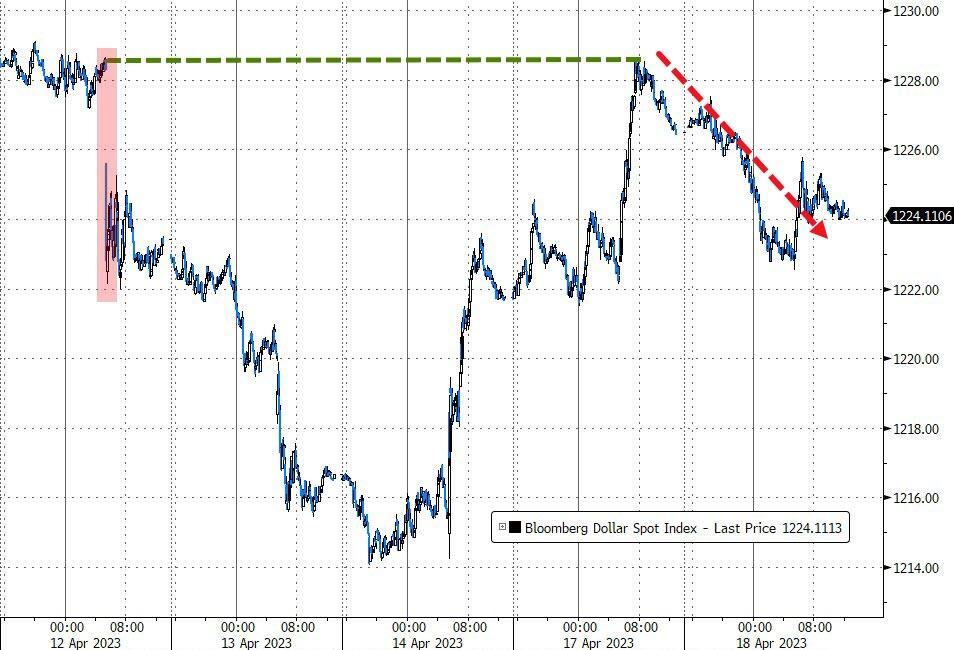
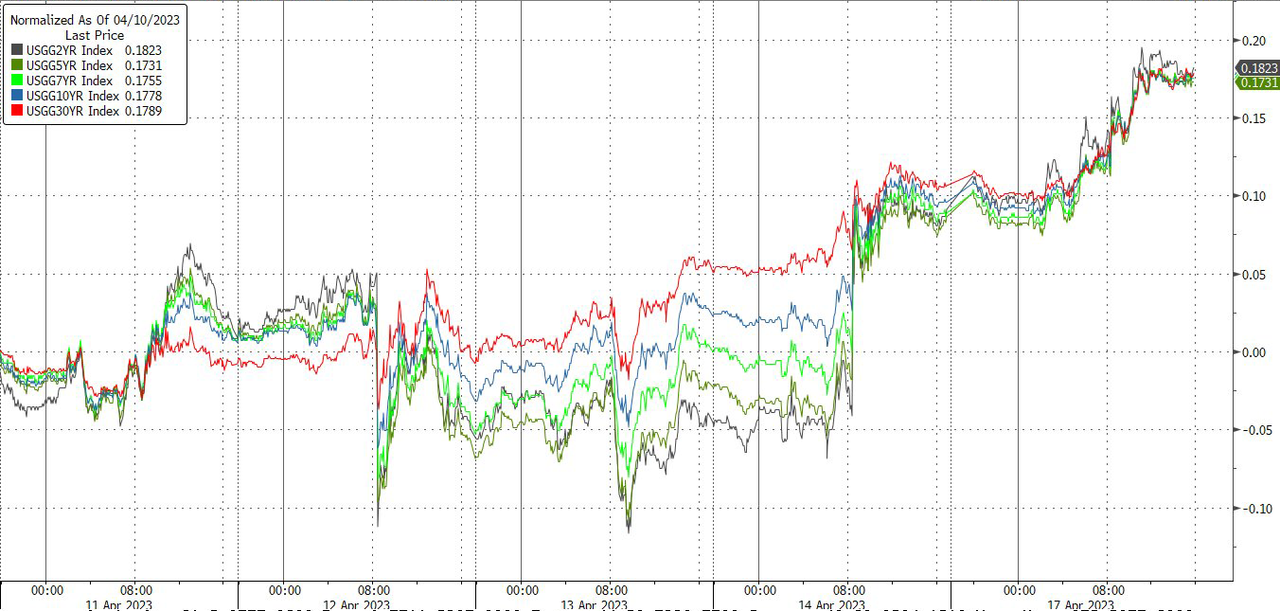
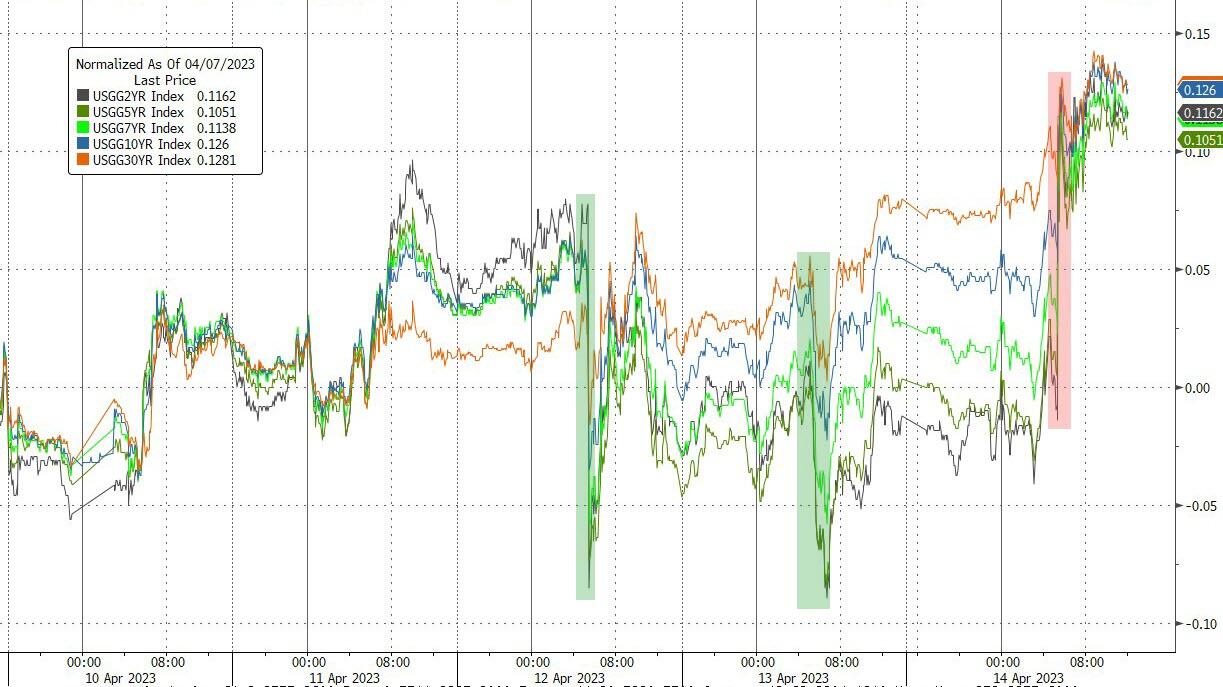
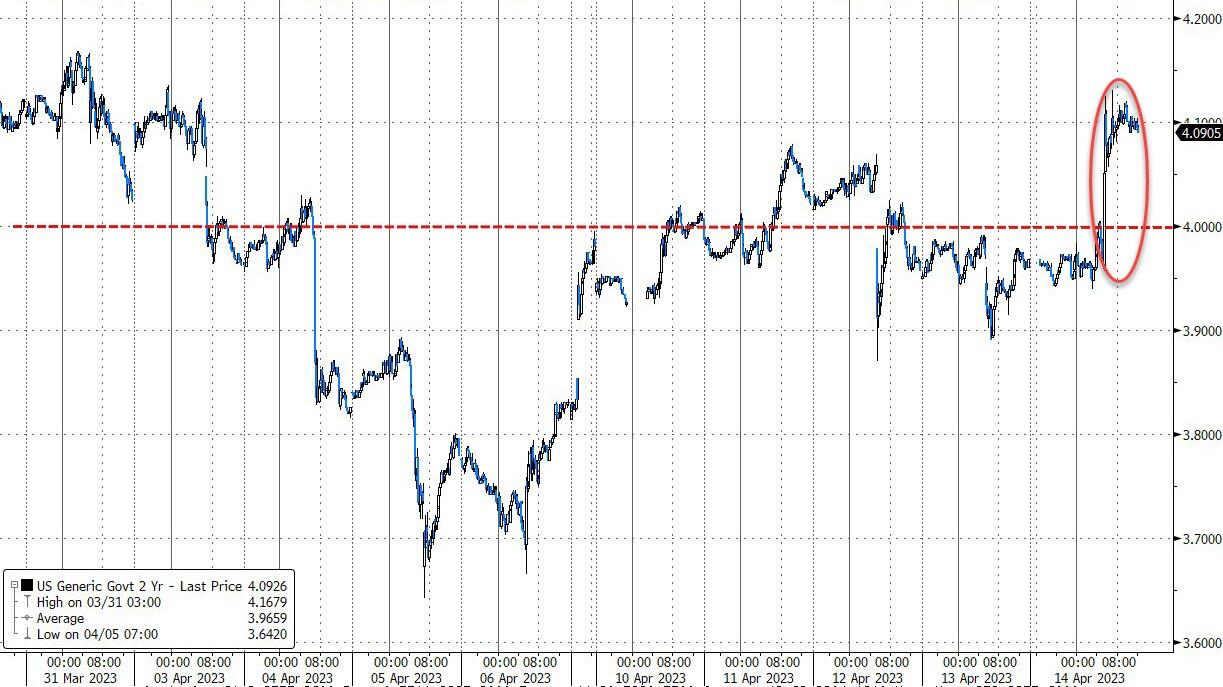
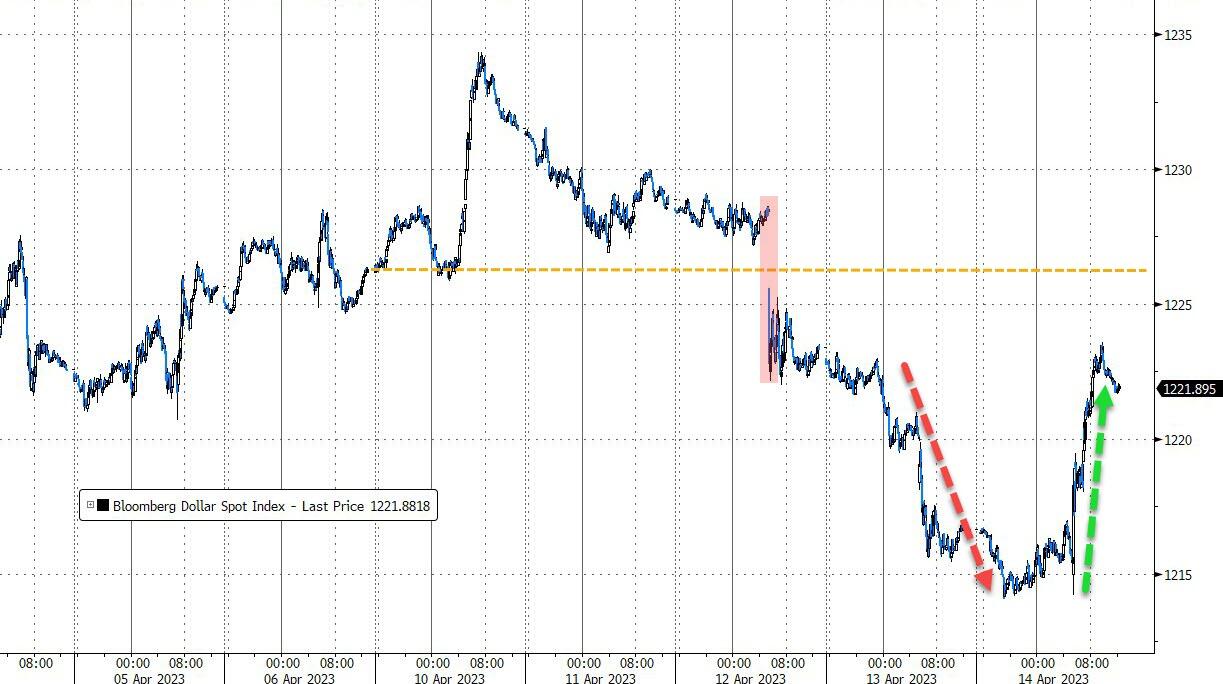
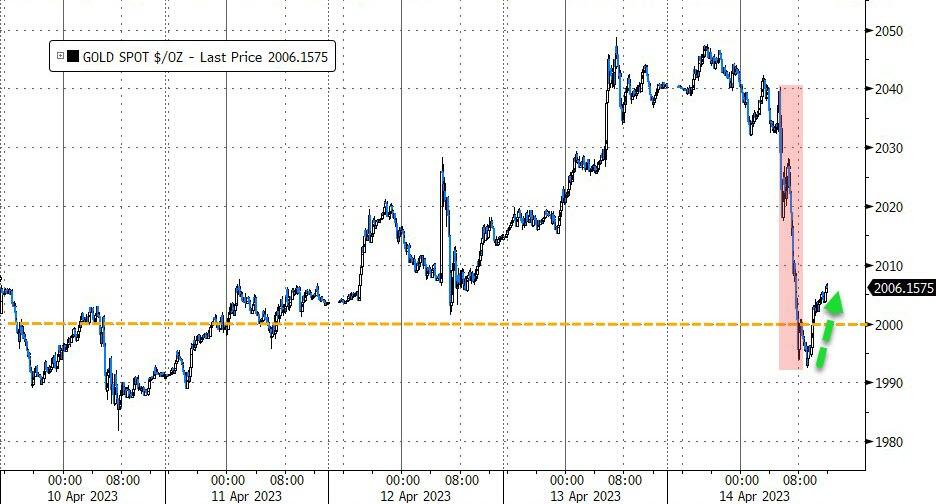
Bond yields were mixed, but the 2-year recaptured the 4% level, the US Dollar roundtripped yet gained for the session, while gold slipped but stayed above its $2k level.
I expect this choppiness to continue until a sudden possibly unforeseen event wakes up bulls and bears, and the race will be on, but in which direction?
Read More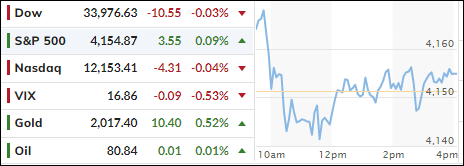
