CPI Tamer Than Expected, But…

Ulli Market Commentary Contact

[Chart courtesy of MarketWatch.com]

  1. Moving the markets

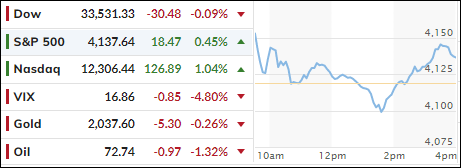
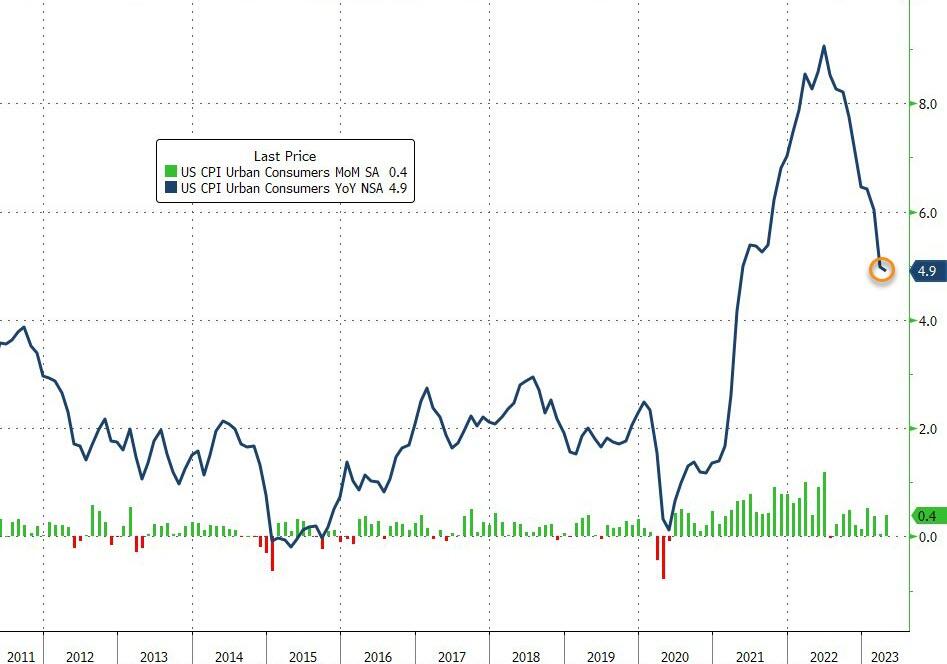
Year-over-year, consumer prices increased by 4.9%, down a tad from the expected 5%, while the month-over-month inflation rate of 0.4% was also in line with projections. While traders interpreted that as good news, market reaction was mixed, with the major indexes advancing only moderately.

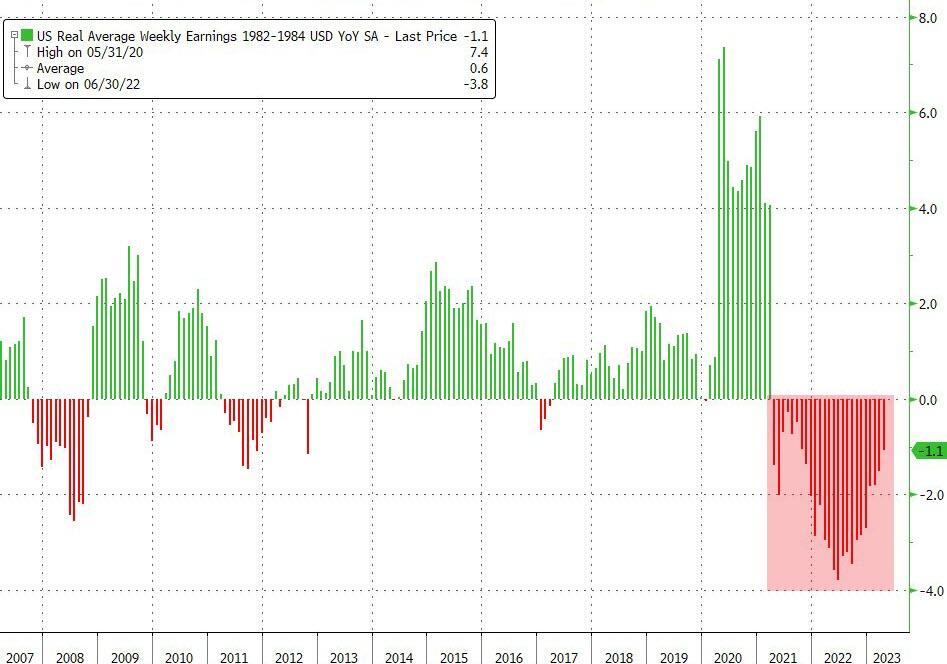
When looking under the hood, however, we saw that there is more to this story than just a headline number, namely the fact that inflation continues to outpace Americans’ rising wages—for the 25th straight month, according to ZeroHedge. Ouch!

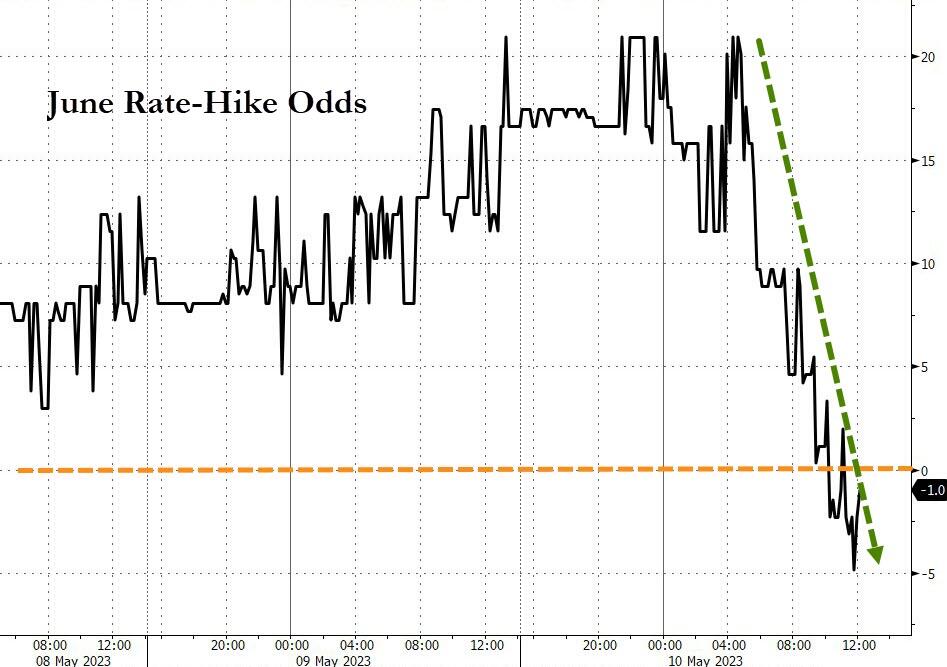
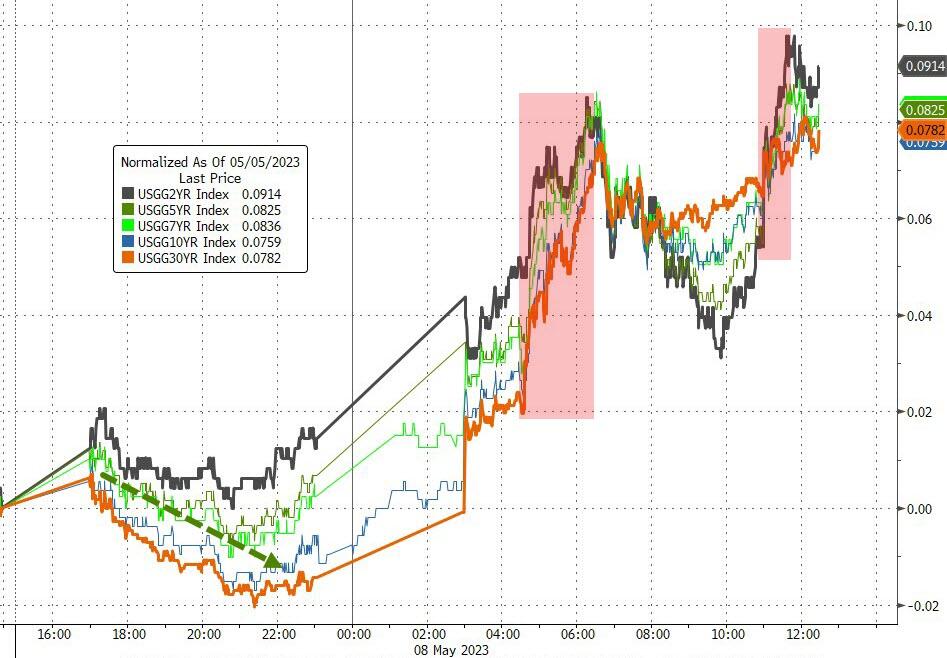
Still, the softening of the CPI pulled June rate-hike odds down from 20% to less than zero. The markets spiked initially, then dumped into the red but managed to recover into the close. It was a chaotic session with no clear direction and a marginal outcome.

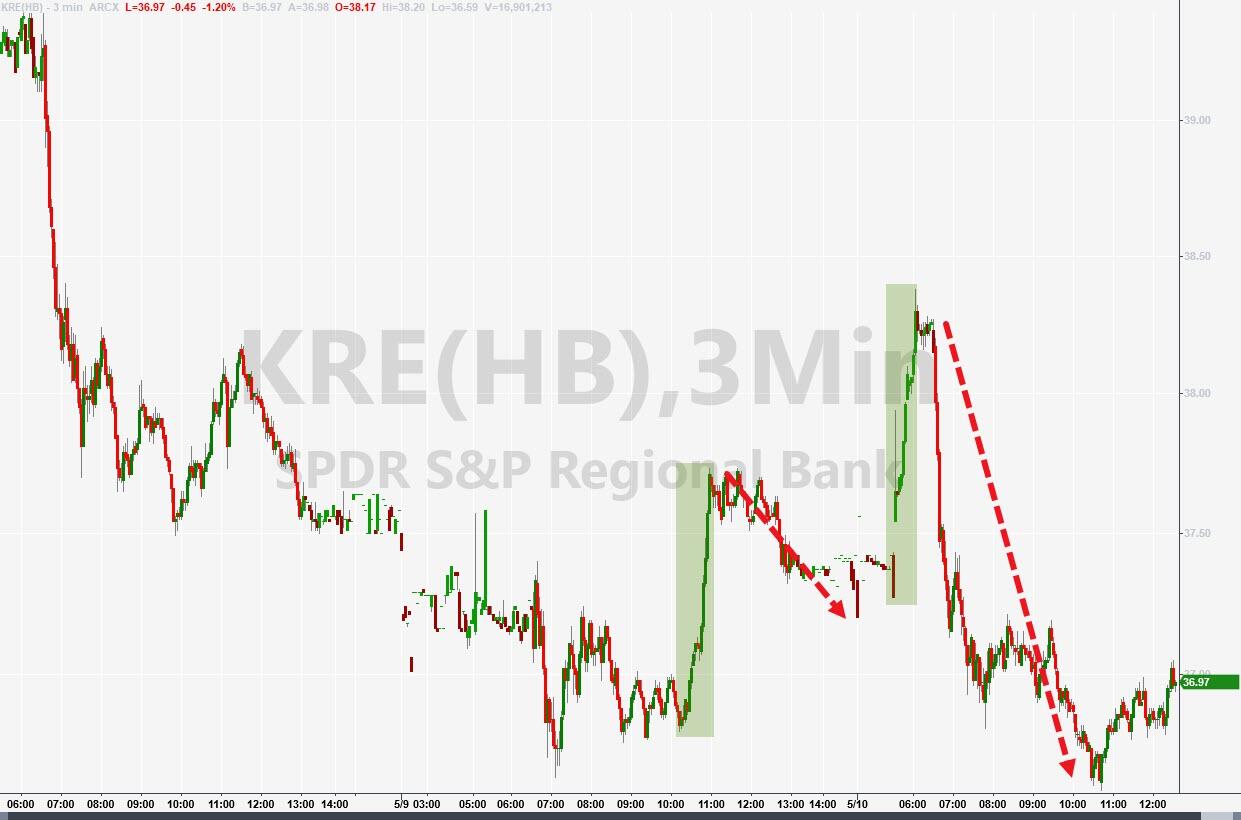
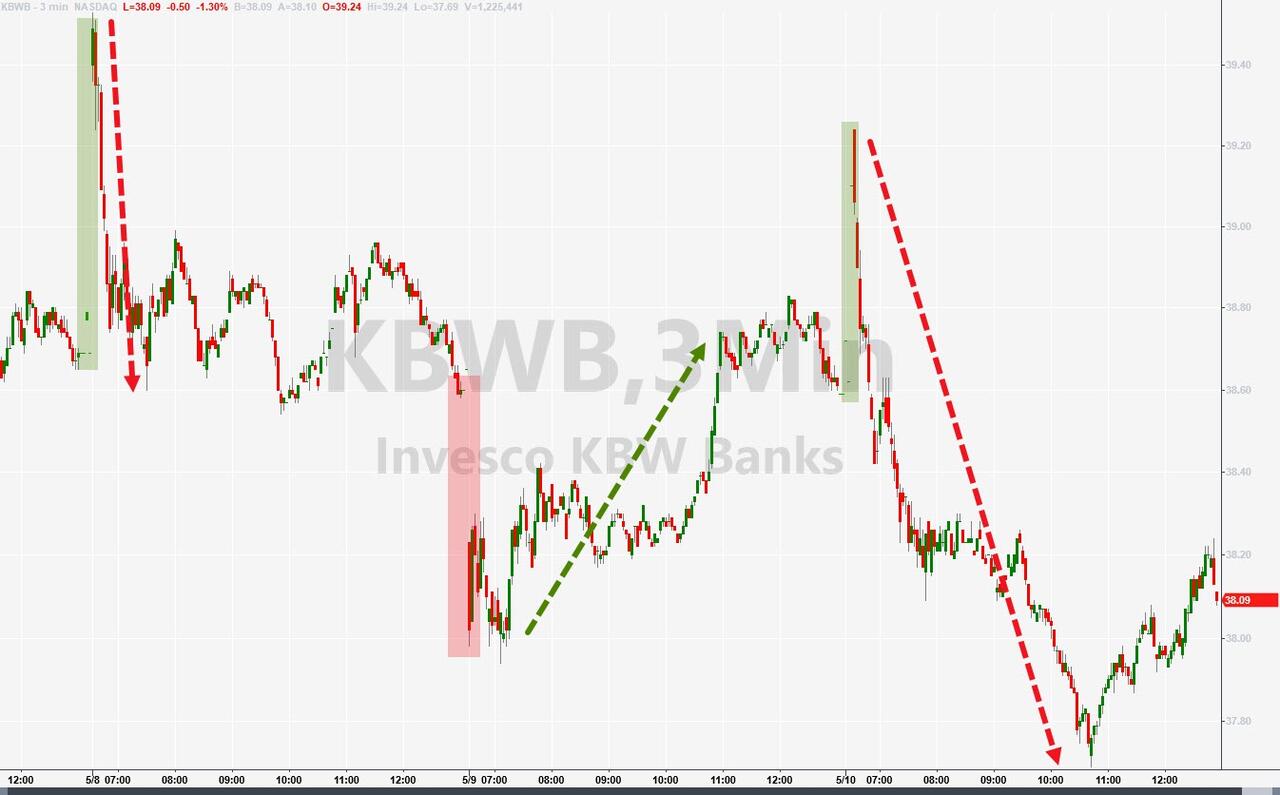
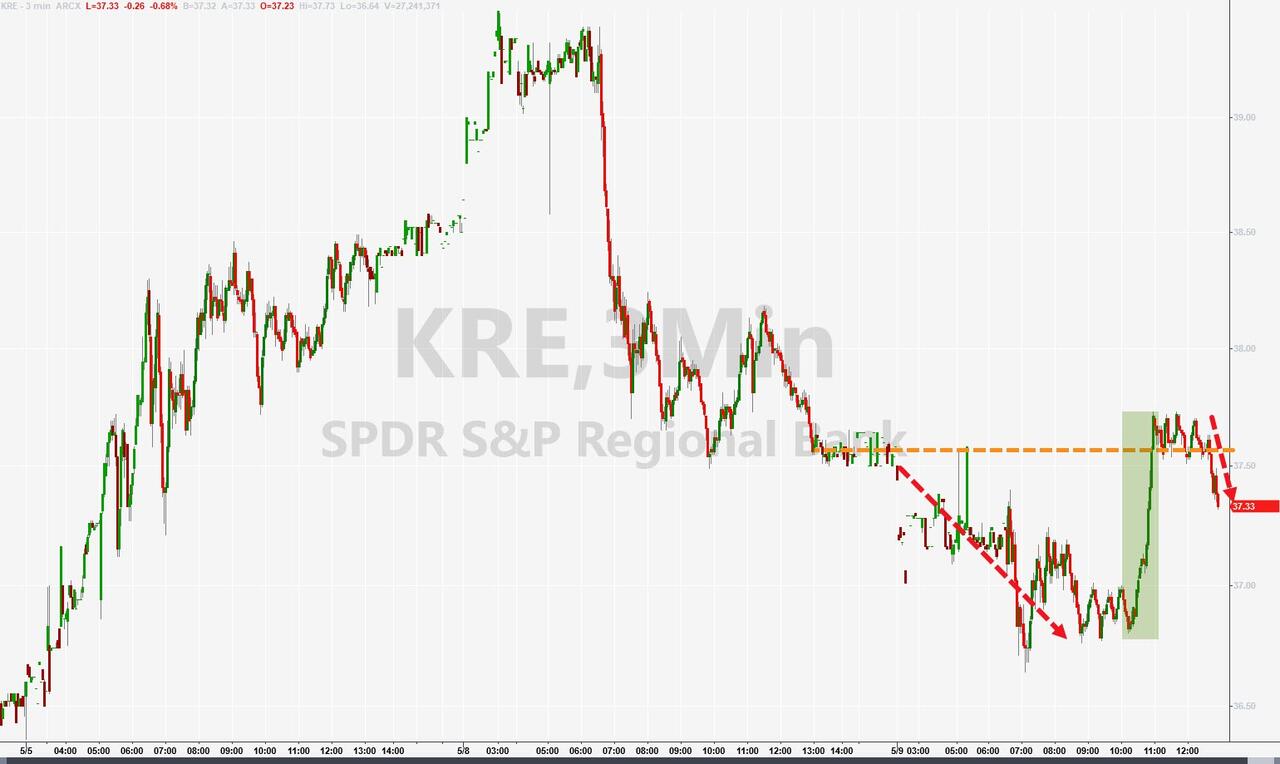
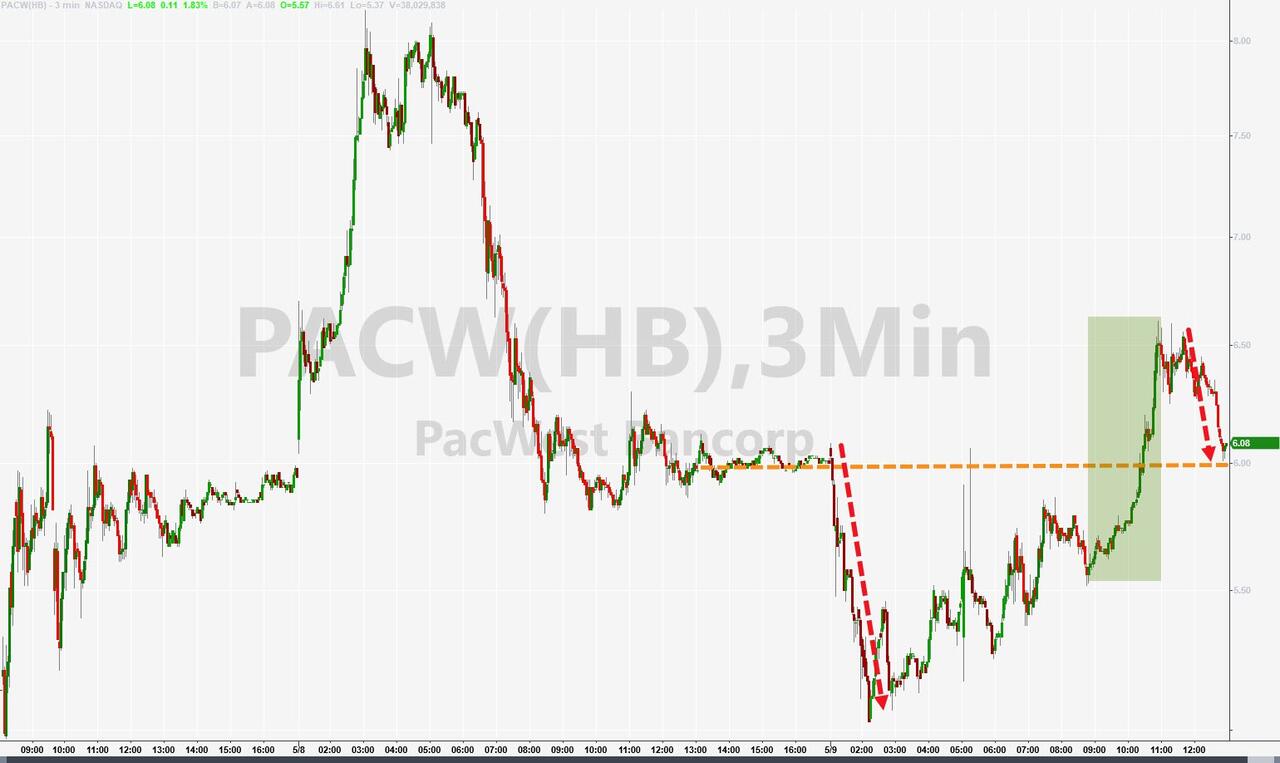
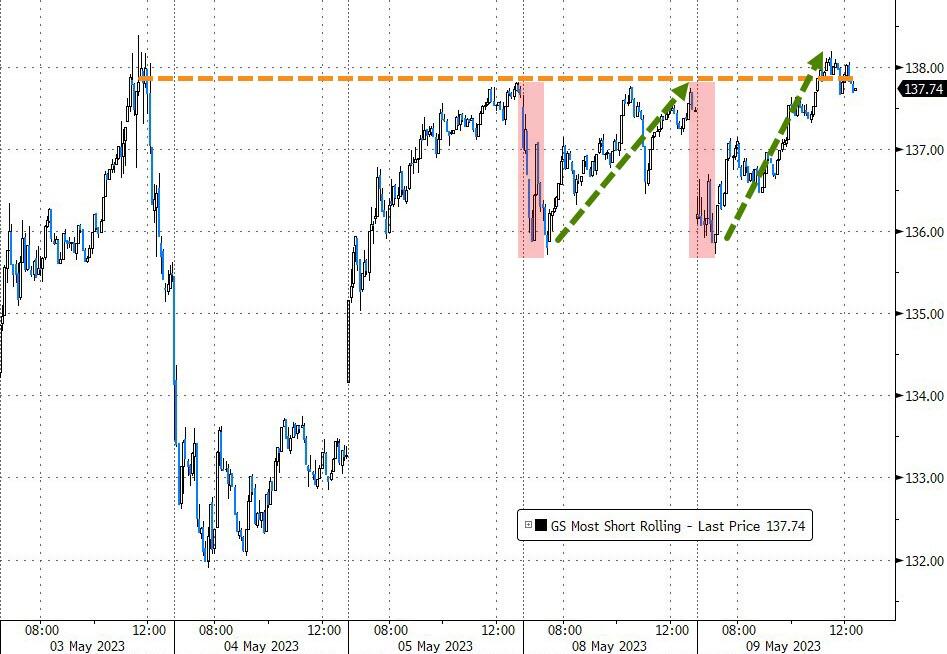
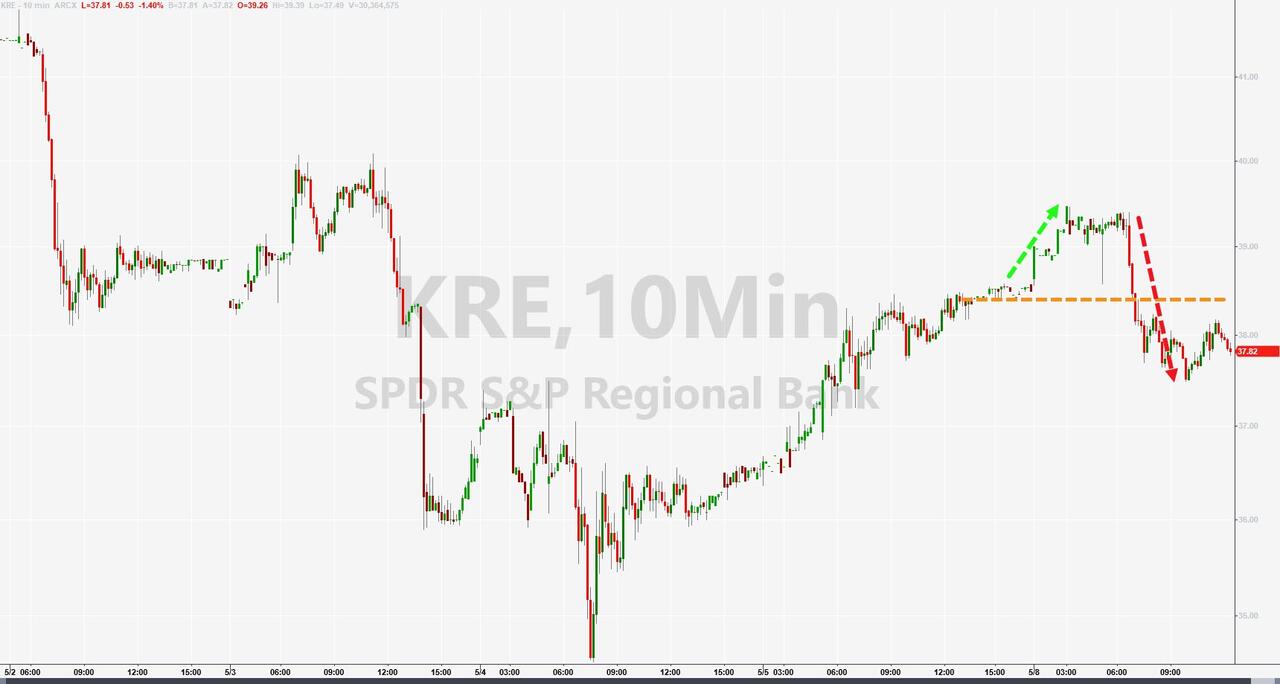
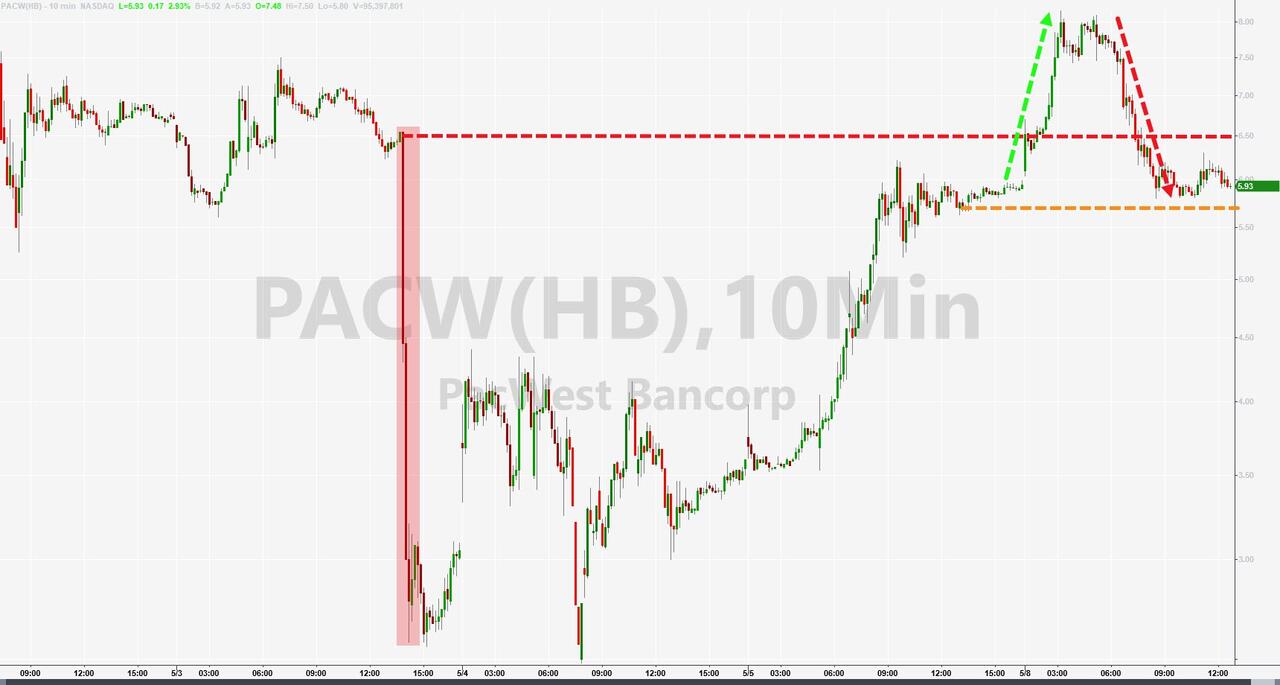
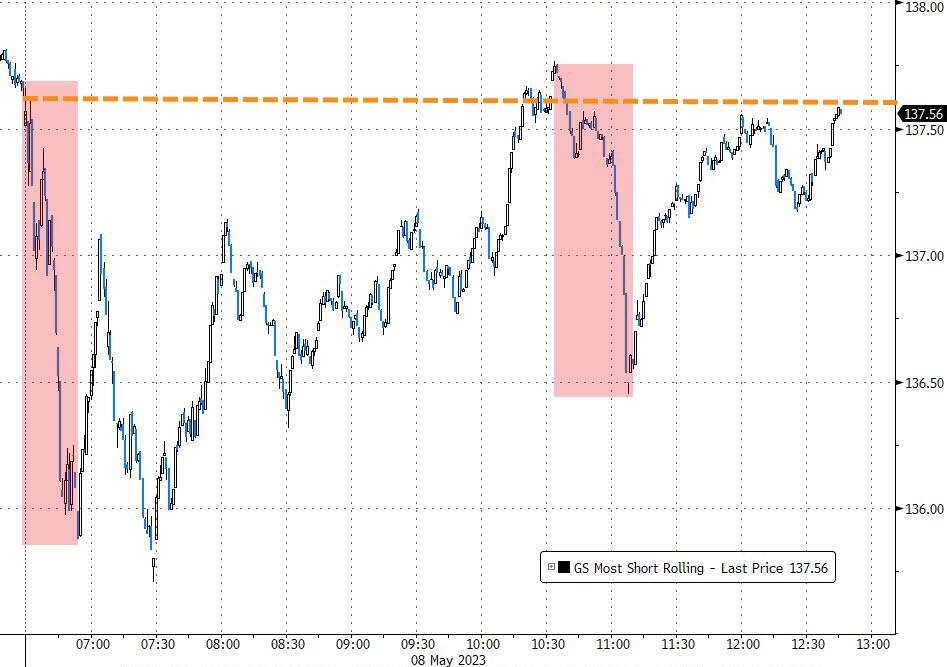
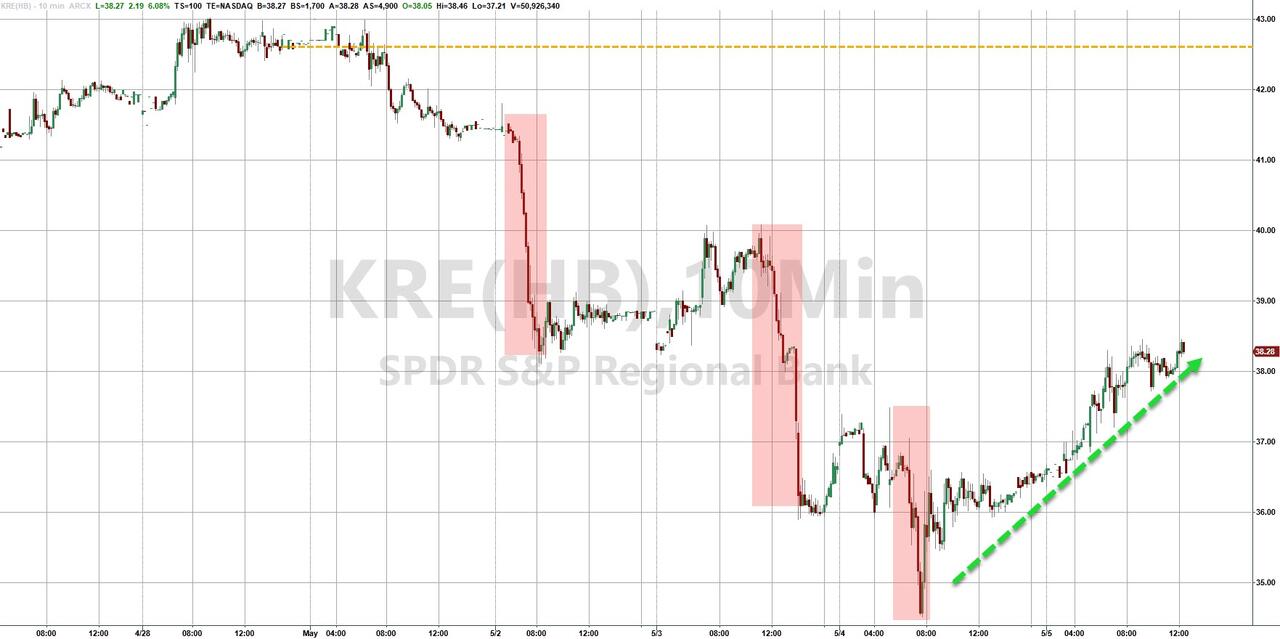
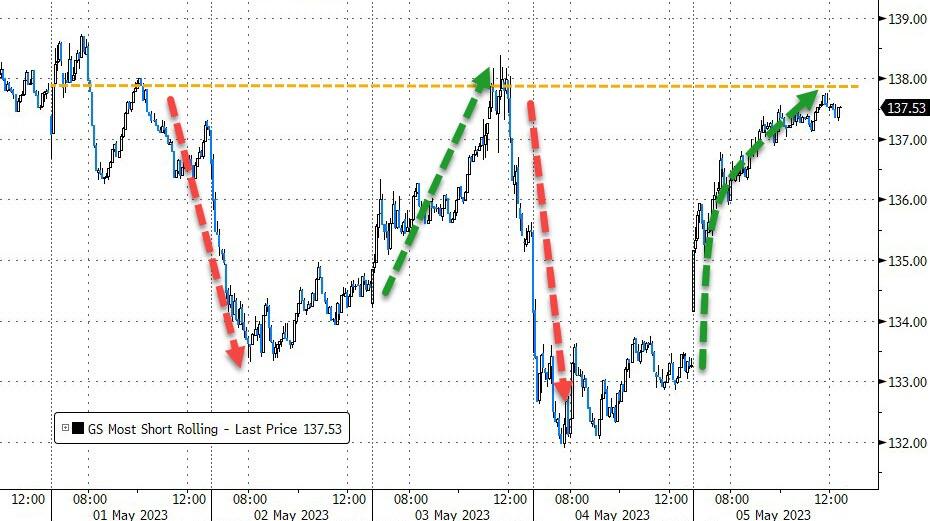
Helping the bulls was a double short squeeze attempt, which in the end did not do much to ignite bullish spirits. The same uncertainty emerged in the Regional Banking circus, where the index (KRE) was pumped and then dumped, which was duplicated in all bank stocks.

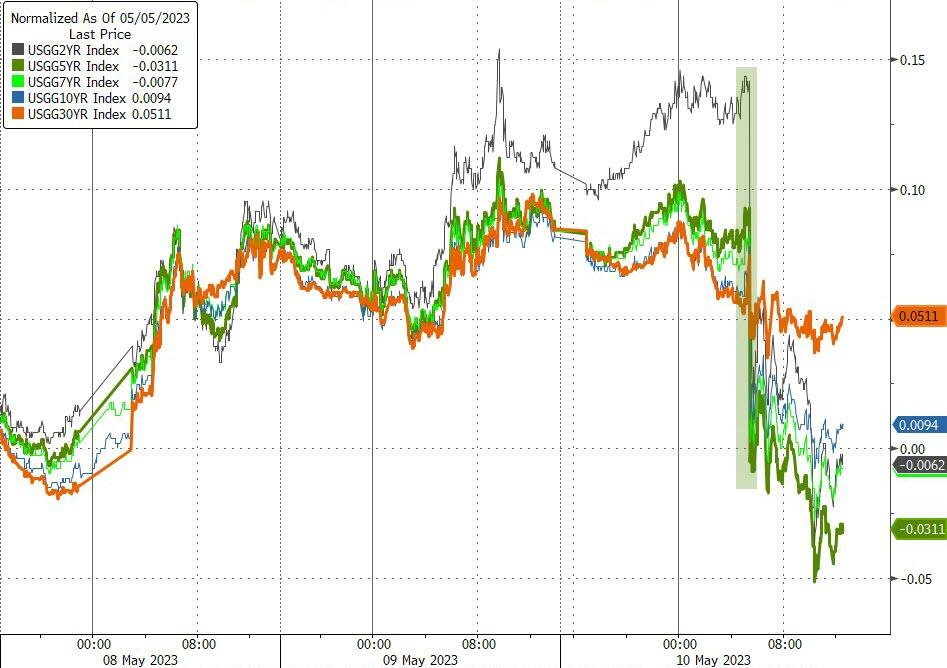
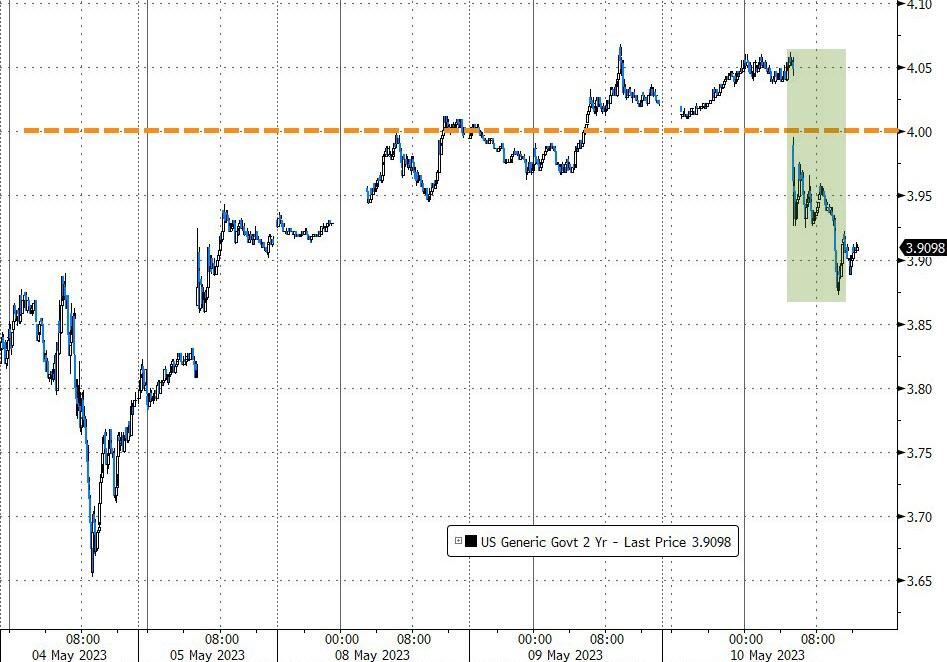
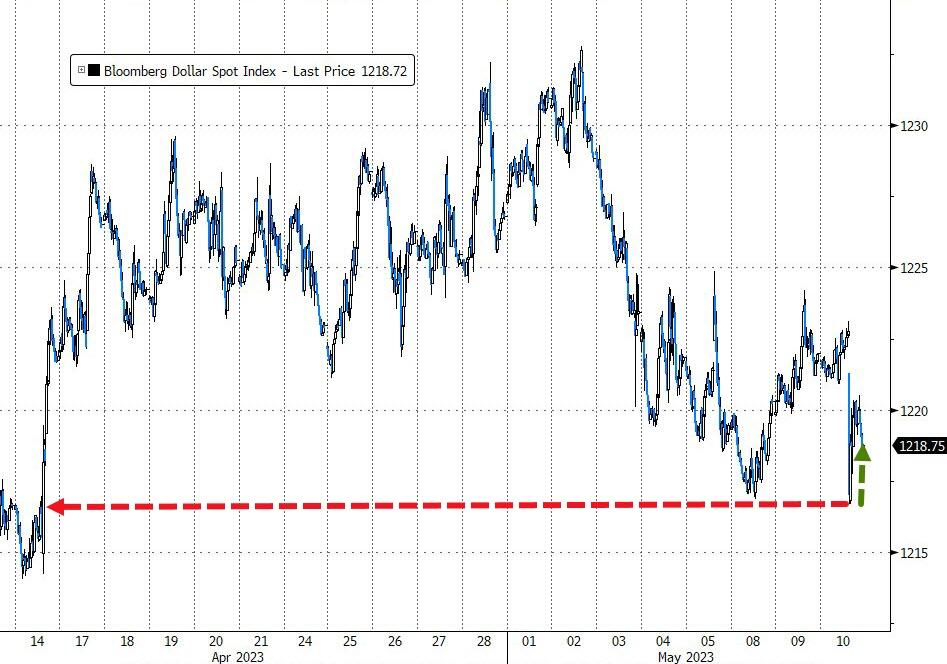
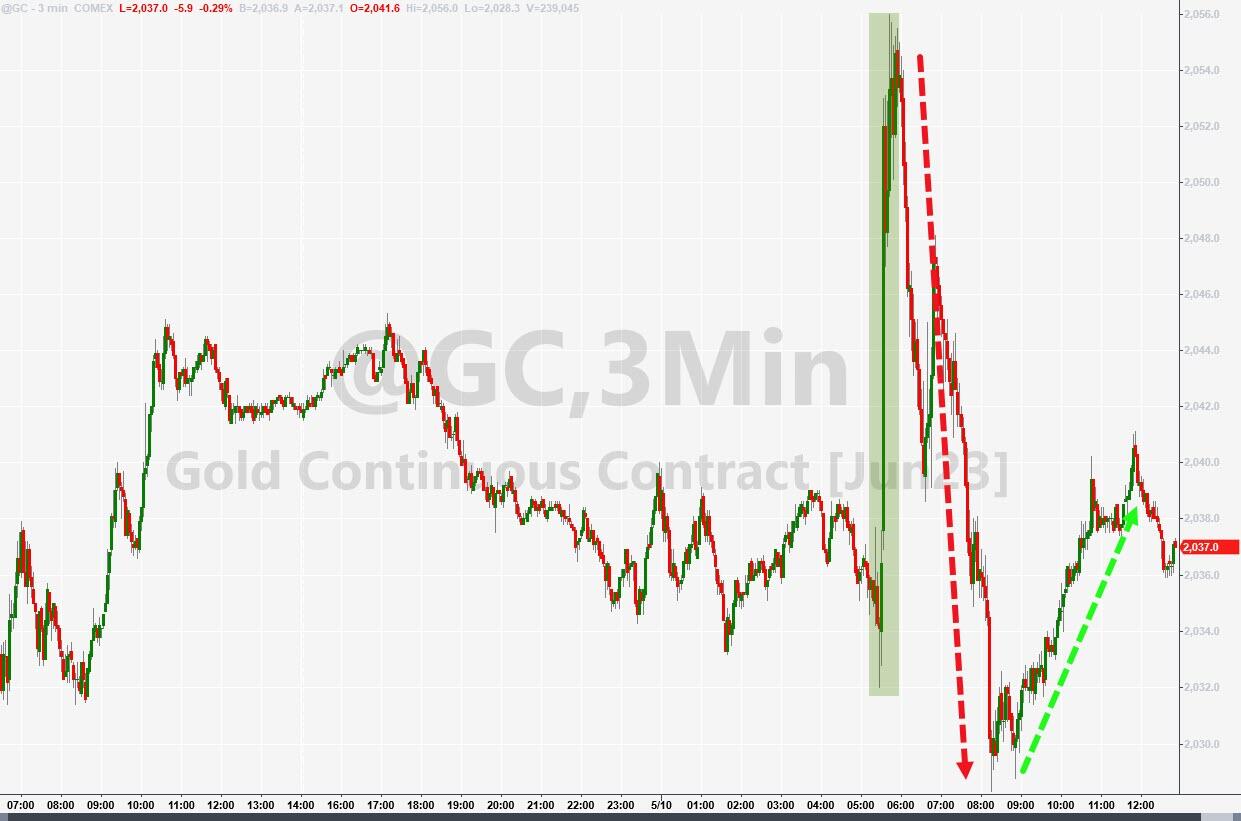
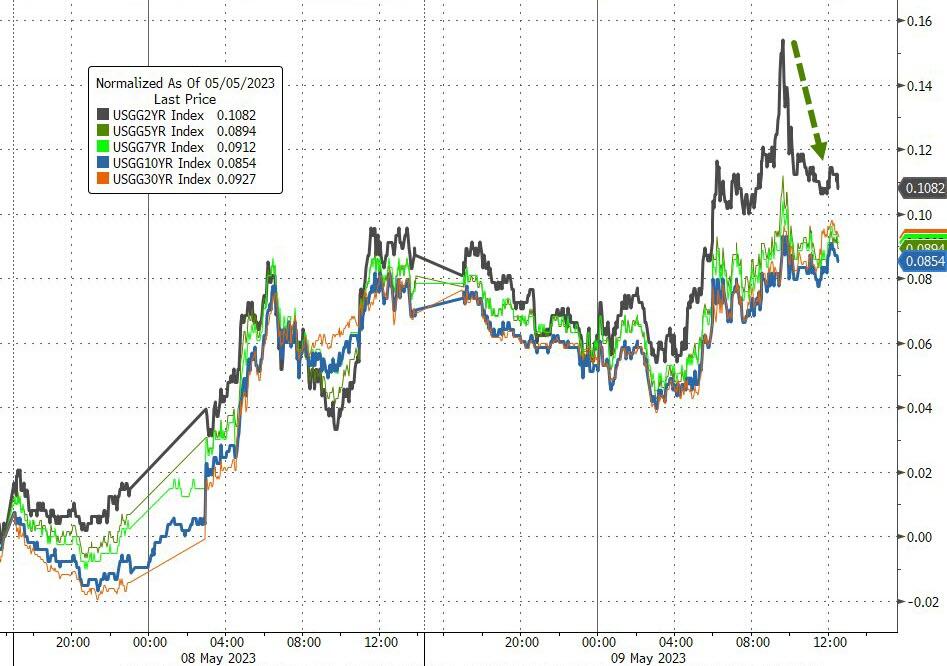
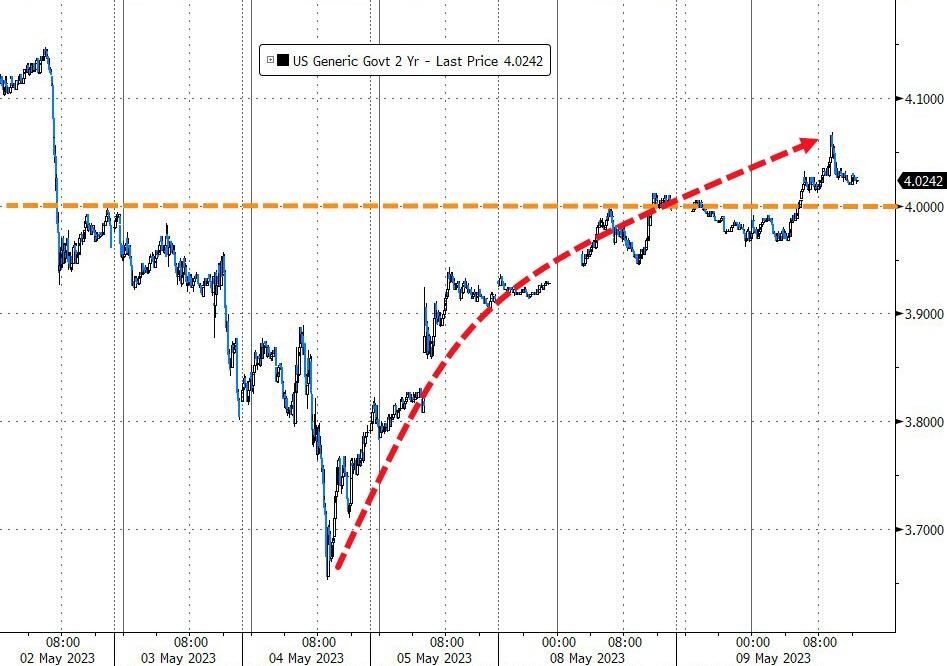
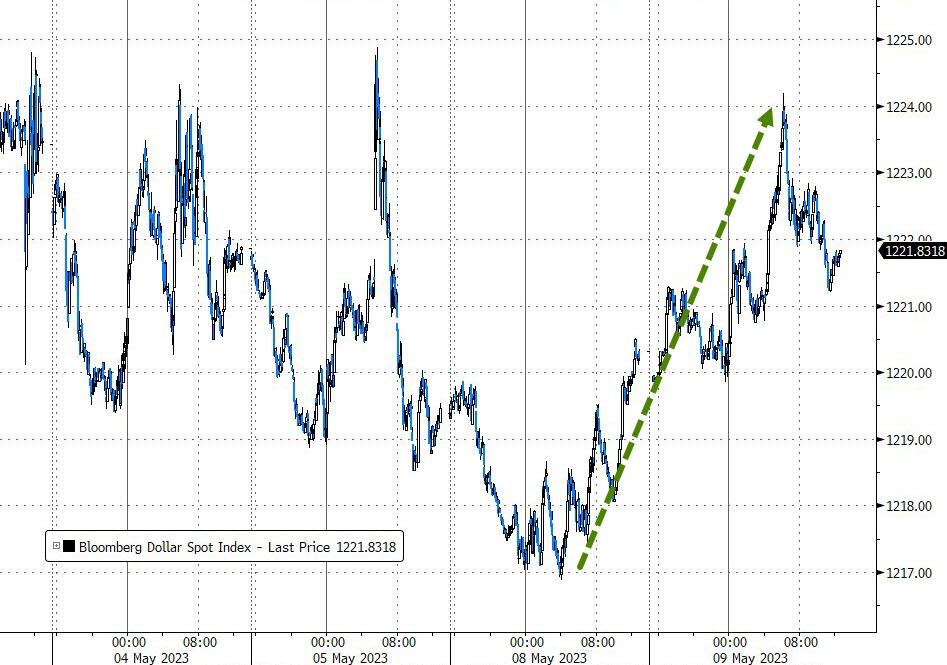
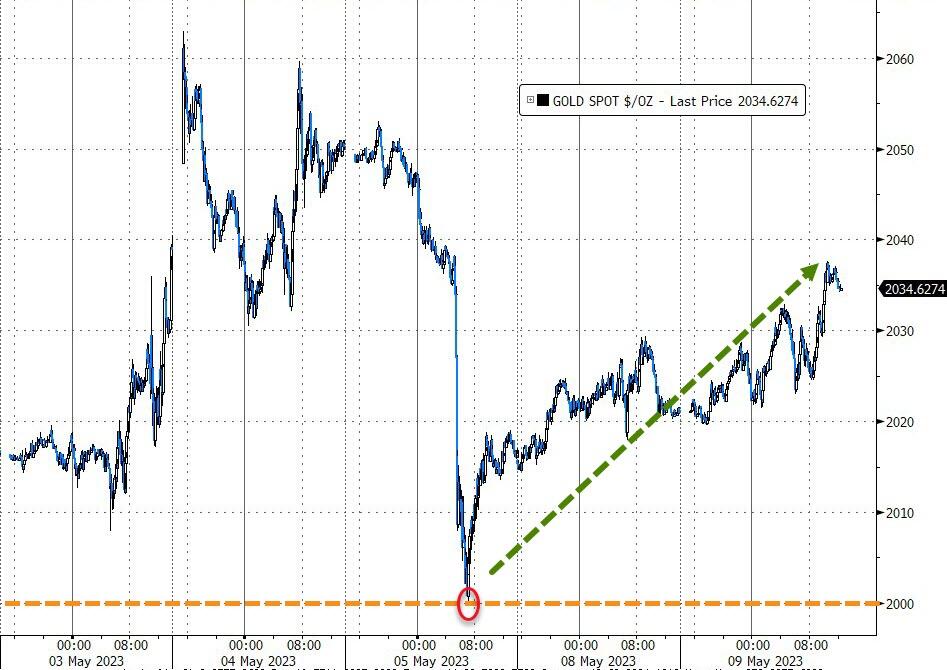
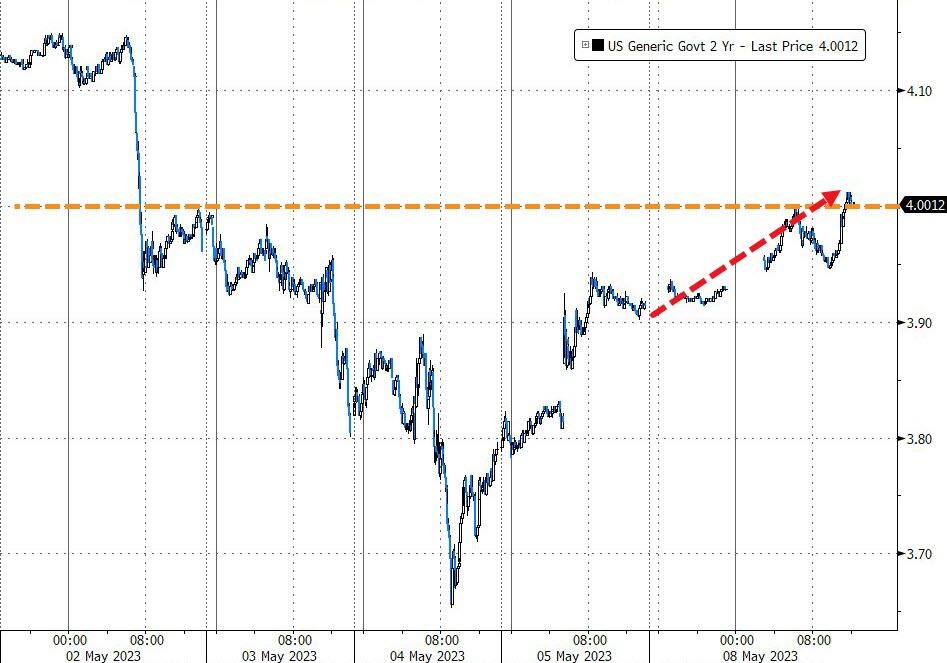
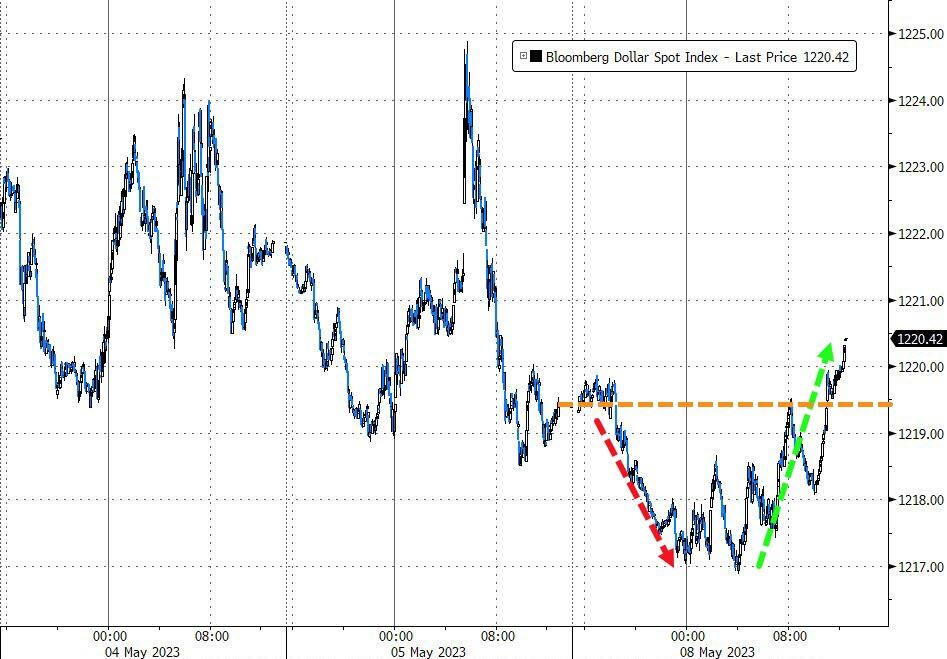
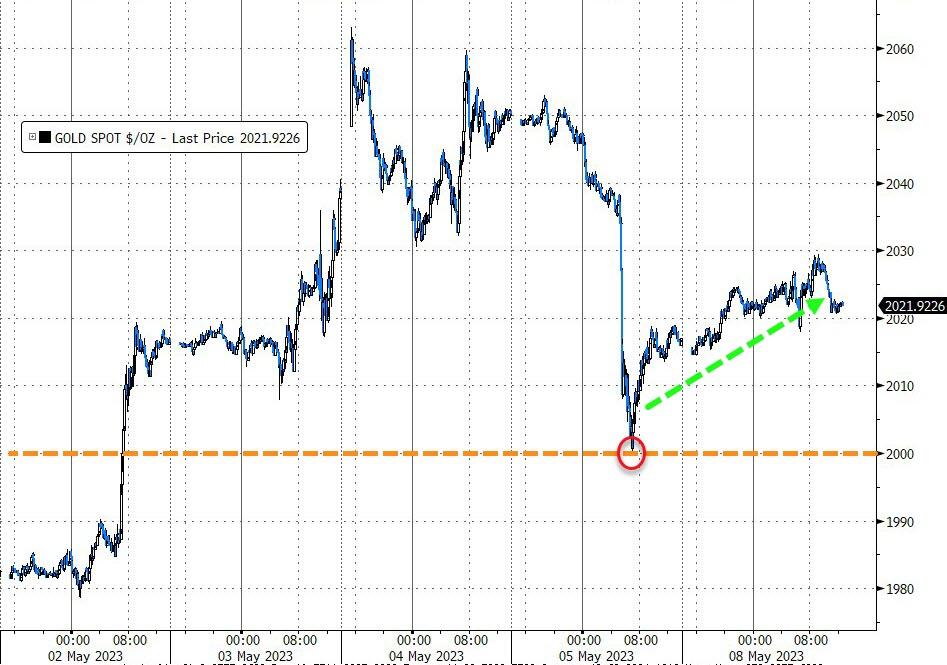
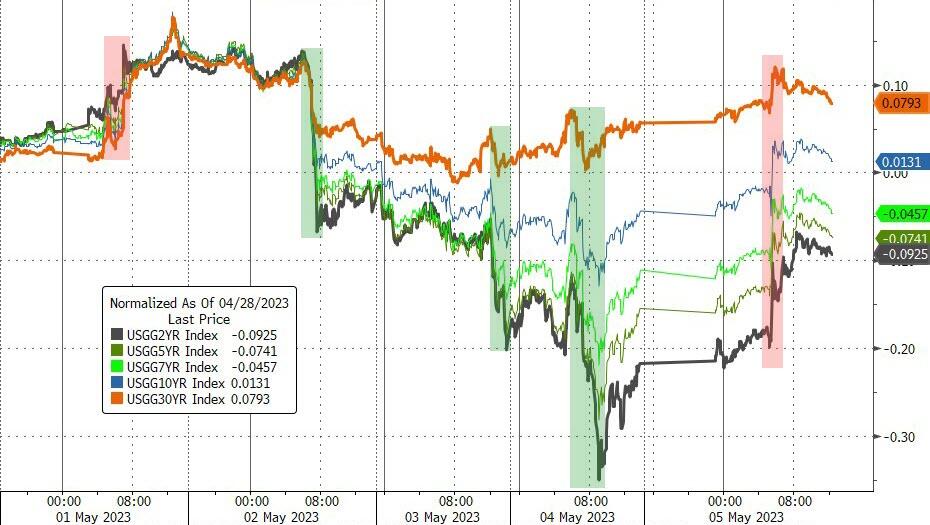
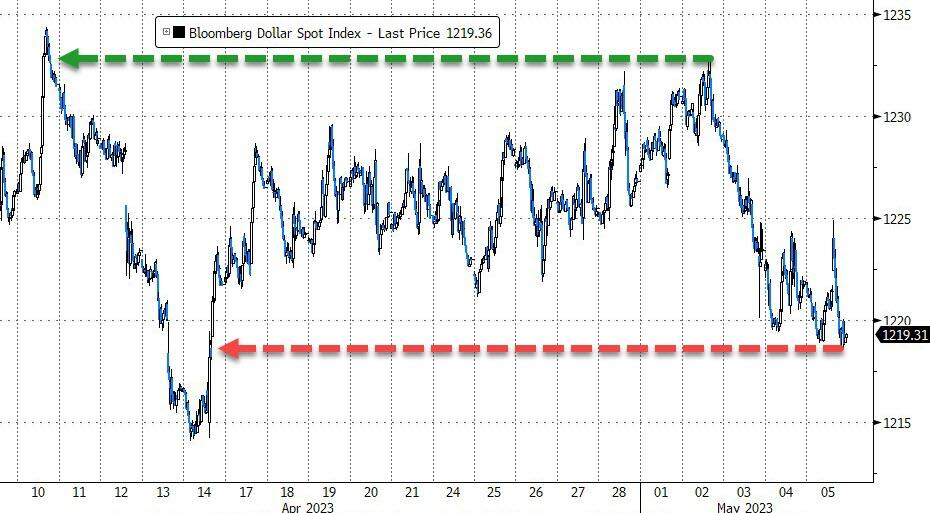
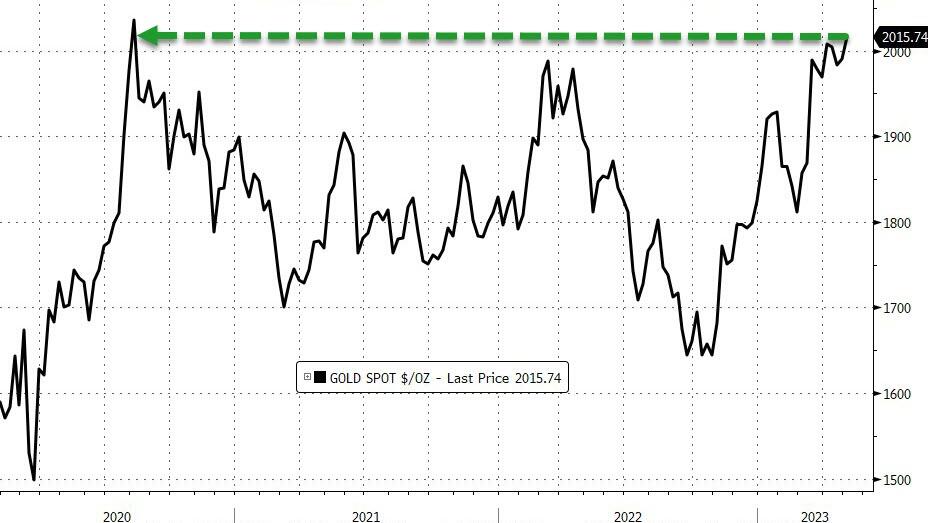
Bond yields took a hit, with the 2-year losing its recent gains along with its 4% level. The US Dollar rode its own roller coaster, while Gold followed the overall theme, namely cranking, then tanking but bouncing to a green close. Let’s see what the release of the PPI can do for the markets tomorrow…

Read More

Another Lukewarm Session

Ulli Market Commentary Contact

[Chart courtesy of MarketWatch.com]

  1. Moving the markets

As I suspected yesterday, today’s session might not be much different, and that’s how it turned out. While inflation data, to be released tomorrow and Thursday, loom large, Treasury Secretary Yellen decided to increase the “fear meter” by announcing that failing to raise the debt ceiling would be an economic catastrophe, referring to this afternoon’s “conversation” between Biden and McCarthy.

As a result, traders and algos alike stayed away from making any key commitments, causing the major indexes to chop below their respective unchanged lines. Whether the inflation numbers are interpreted as being “sticky” or not will determine future market direction. As will acceptance of the fact that banking stresses will not just disappear, lending conditions may tighten, and increased reserve requirements will lead to fewer loans and a struggling economy.

Adding to these general uncertainties were hawkish comments from the Fed’s Williams, as ZeroHedge alluded to:

“What we’re signaling is we’re going to make sure that we achieve our goals and going to assess what’s happening in the economy and make the decision based on that data,” he said. “And if additional policy firming is appropriate, then we’ll do that.”

“I do not see in my baseline forecast any reason to cut interest rates this year,” he said, adding that the economy began the year on a solid footing, and he saw two-sided risks to the outlook. “In my forecast we need to keep restrictive stance of policy in place for quite some time.”

We have heard these kinds of words for almost a year, but the markets have not caught on and stubbornly cling to the belief that the Fed will cave and pause or pivot. Only time will tell.

The regional banking sector ETF KRE slipped, as the latest cockroach (PACW) pumped and dumped. The markets followed in similar fashion, but a worse outcome was avoided, as a short squeeze sort of saved the day.  

Bond yields climbed, with the 2-year finally conquering its 4% level again. The US Dollar continued yesterday’s rally but sold off into the close. Gold ramped higher and captured the $2,040 level.

All eyes are now on tomorrow’s CPI report. Stay tuned.

Read More

Clinging To The Unchanged Line

Ulli Market Commentary Contact

[Chart courtesy of MarketWatch.com]

  1. Moving the markets

Traders found no motivation to drive the market in either direction, as the release of key inflation data cast a broad shadow on activity. On deck first will be April’s Consumer Price Index (PPI) on Wednesday, which is followed by the Producer Price Index (PPI) on Thursday.

Volatility was the name of the game last week, with the Dow and S&P notching their worst weekly advances since March, despite a strong rebound on Friday. Continuing discussions about whether the banking crisis has finally run its course—it hasn’t—kept traders somewhat agitated.

However, some encouragement pulled the Regional Banking Index (KRE) out of the doldrums early on, but that turned into a head fake, with the index tanking late in the session. Even the most recent banking cockroach, namely PACW, followed suit by rallying some 30%, but in the end, it surrendered all its early gains.

More whispering about short-selling on banks hit a brick wall, when none other than the Fed elaborated on the effectiveness of such a move:

The 2008 ban on short sales failed to slow the decline in the price of financial stocks;

…in fact, prices fell markedly over the two weeks in which the ban was in effect and stabilized once it was lifted.

A tip of the hat to ZeroHedge for this “finding.”

The most shorted stocks went into an early tailspin and only managed to squeeze back to the unchanged line, meaning a zero effect on market direction.

Bond yields rose with the 2-year kissing its 4% level but closing below it. The US Dollar dumped and pumped and managed to eke out a moderate gain. Surprisingly Gold followed suit and pushed towards its $2,030 marker.

I expect more of the same tomorrow in anticipation of the mid-week inflation data.

Read More

ETFs On The Cutline – Updated Through 05/05/2023

Ulli ETFs on the Cutline Contact

Below, you can evaluate the latest High-Volume ETF Cutline report, which shows how far above or below their respective long-term trend lines (39-week SMA) my currently tracked ETFs are positioned.

This report covers the HV ETF Master List from Thursday’s StatSheet and includes 312 High Volume ETFs, defined as those with an average daily volume of more than $5 million, of which currently 202 (last report: 221) are hovering in bullish territory. The yellow line separates those ETFs that are positioned above their trend line (%M/A) from those that have dropped below it.

Take a look:                                                                   

The HV ETF Master Cutline Report

In case you are not familiar with some of the terminology used in the reports, please read the Glossary of Terms. If you missed the original post about the Cutline approach, you can read it here.      

ETF Tracker Newsletter For May 5, 2023

Ulli ETF Tracker Contact

ETF Tracker StatSheet          

You can view the latest version here.

REBOUNDING ON THE LAST DAY OF THE WEEK

[Chart courtesy of MarketWatch.com]

  1. Moving the markets

After four straight days of losses, stocks finally managed to find some bullish momentum, which pulled the major indexes out of a deep hole. They still ended the week with a loss, but Wall Street’s darling Apple came to the rescue with better-than-expected quarterly earnings.

Even hotter than anticipated jobs numbers, the economy added 253k vs. a hoped for 180k, did not dent bullish sentiment. The much beaten down regional banking index KRE showed signs of life and advanced some 4.7%, with member banks PacWest and Western Alliance also popping.

All that was helped by a note from JP Morgan upgrading these two stocks. Hmm, what changed from yesterday’s thrashing? Ah yes, a giant short squeeze bailed out Wall Street and the banks, the latter of which are still down hard for the week.

The rebound was happening with full force, despite Bullard’s hawkish comments:

The aggressive policy we pursued in the last 15 months has stemmed the rise in inflation, but it is not so clear we are on a path to 2%.

I am willing to assess the economic data as it comes in but would need to see “meaningful declines in inflation” to be convinced higher rates aren’t necessary.

Again, I think the fallout in the regional banking sector is far from being over, despite today’s comeback, because the liquidity issues that plague all banks, have not been resolved.  

For the week, bond yields were mixed, the US Dollar was down for the 7th of the past 9 weeks, while gold and silver both were up with the latter outperforming and the former just ending a tad short of a record weekly closing high, as ZH elaborated.   

Leave it up to ZeroHedge to sum up the Fed’s predicament:

For The Fed to fold, the market will have to crash, but the market won’t crash, because everyone knows The Fed will fold and juice stocks back to un-reality…

Read More

Weekly StatSheet For The ETF Tracker Newsletter – Updated Through 05/04/2023

Ulli ETF StatSheet Contact

ETF Data updated through Thursday, May 4, 2023

Methodology/Use of this StatSheet:

1. From the universe of over 1,800 ETFs, I have selected only those with a trading volume of over $5 million per day (HV ETFs), so that liquidity and a small bid/ask spread are assured.

2. Trend Tracking Indexes (TTIs)

Buy or Sell decisions for Domestic and International ETFs (section 1 and 2), are made based on the respective TTI and its position either above or below its long-term M/A (Moving Average). A crossing of the trend line from below accompanied by some staying power above constitutes a “Buy” signal. Conversely, a clear break below the line constitutes a “Sell” signal. Additionally, I use a 12% trailing stop loss on all positions in these categories to control downside risk.

3. All other investment arenas do not have a TTI and should be traded based on the position of the individual ETF relative to its own respective trend line (%M/A). That’s why those signals are referred to as a “Selective Buy.” In other words, if an ETF crosses its own trendline to the upside, a “Buy” signal is generated. Here too, I recommend trailing sell stop of 12%, or less, depending on your risk tolerance.

If you are unfamiliar with some of the terminology, please see Glossary of Terms and new subscriber information in section 9.     

1. DOMESTIC EQUITY ETFs: BUY — since 12/01/2022

Click on chart to enlarge

Our main directional indicator, the Domestic Trend Tracking Index (TTI-green line in the above chart) has just slipped below its long-term trend line (red) by -1.00% but remains in “Buy” mode for the time being, until I get more downside confirmation.

Read More