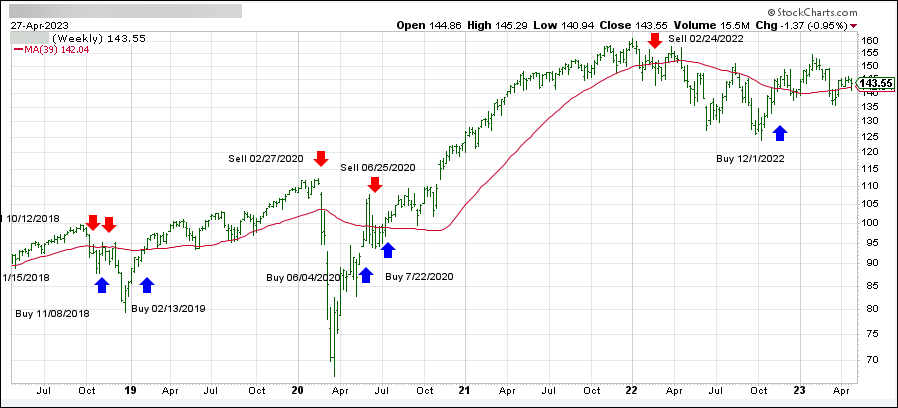
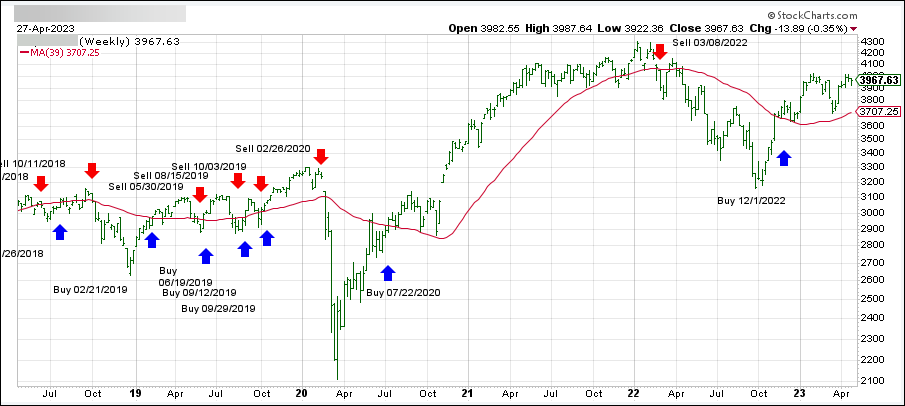
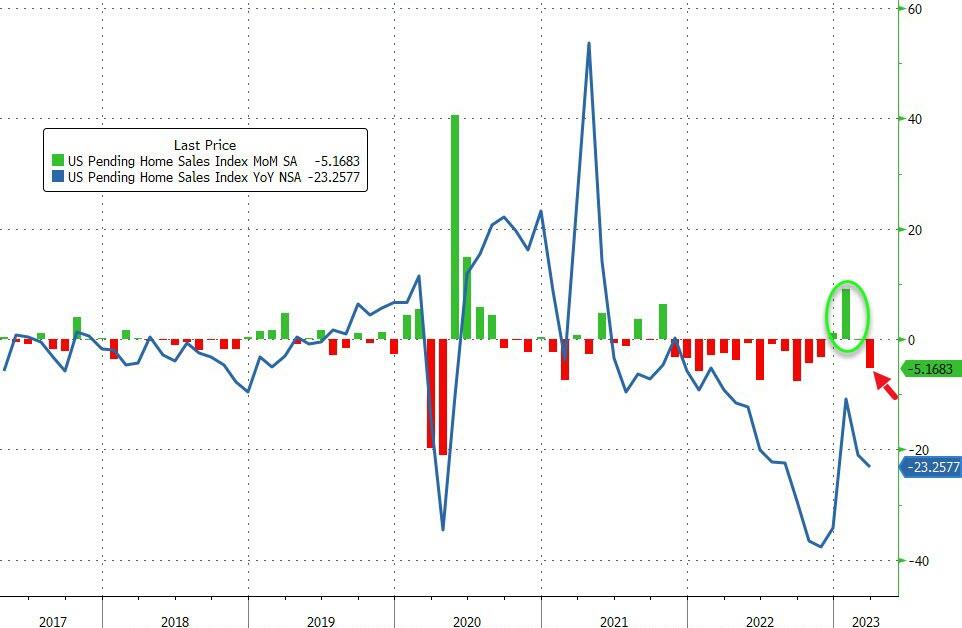
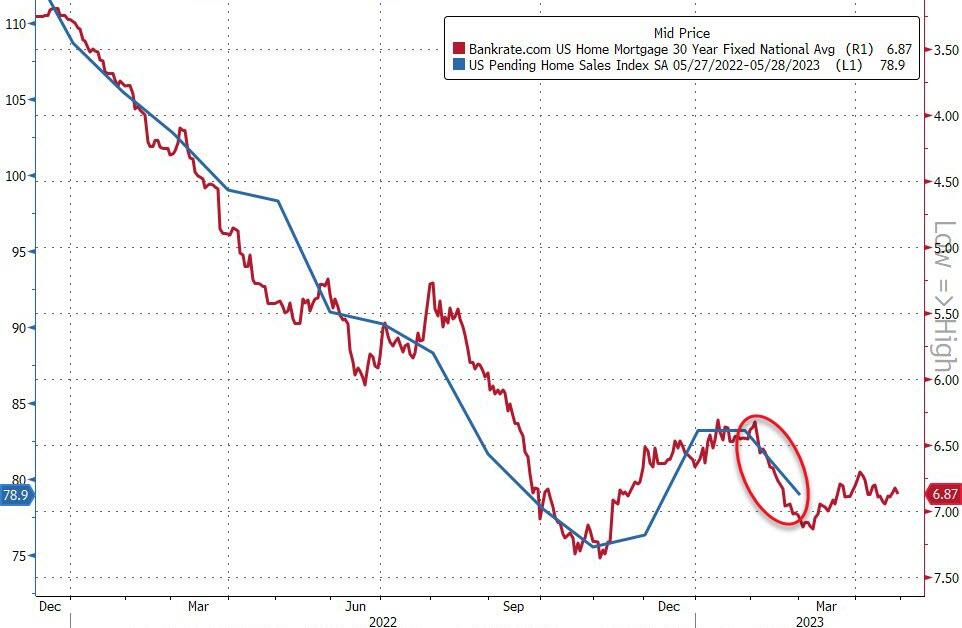
Here We Go Again: The Next Cockroach Has Surfaced

Ulli Market Commentary Contact

[Chart courtesy of MarketWatch.com]

  1. Moving the markets

Observing the markets daily, sometimes I have to laugh out loud, and at other times I simply have to shake my head in disbelief. The latter occurred yesterday, after Fed head Powell had announced that the banking system was “sound and resilient.”

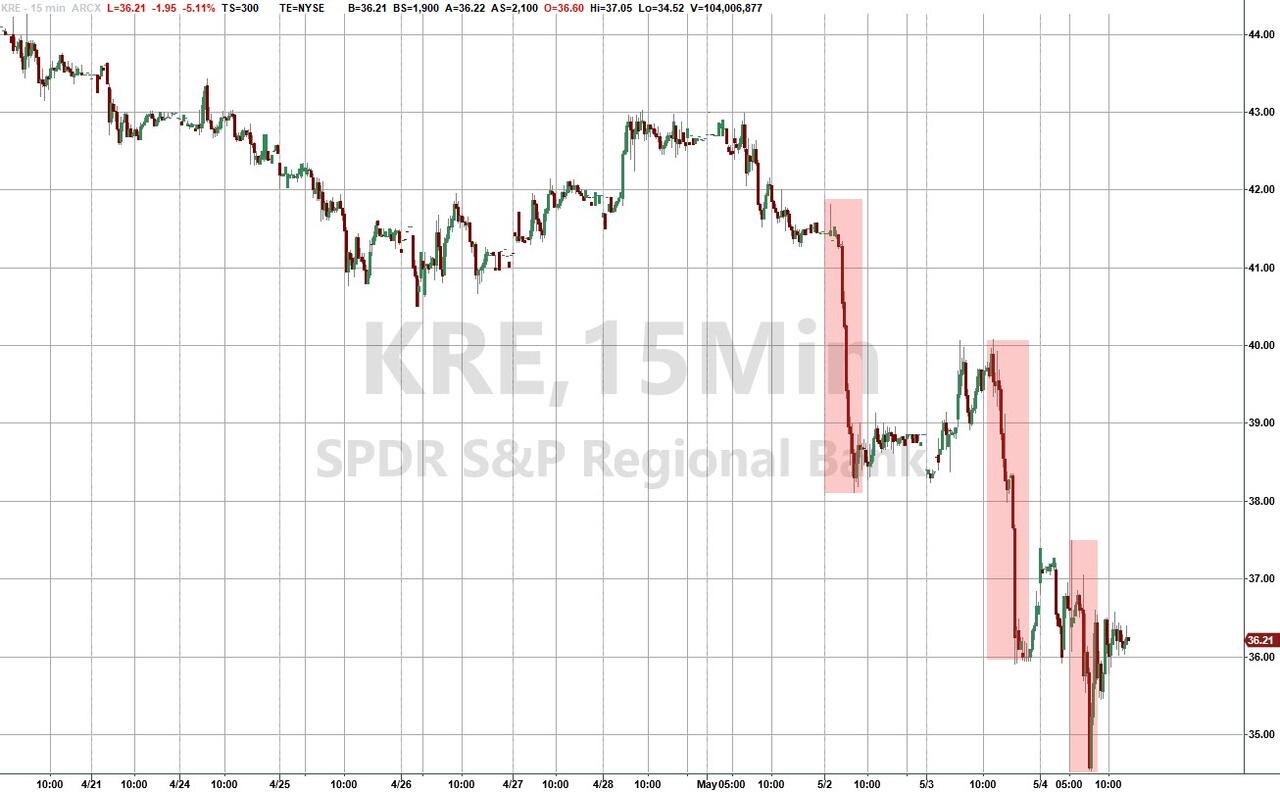
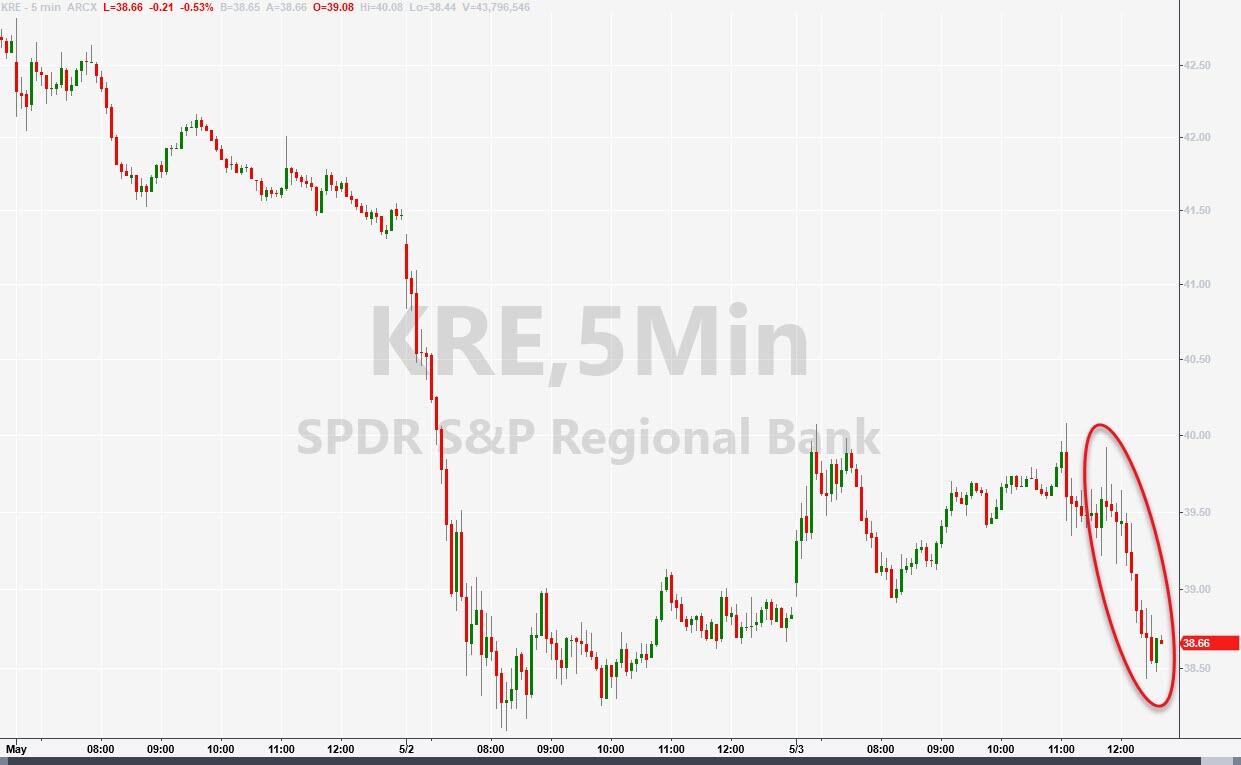
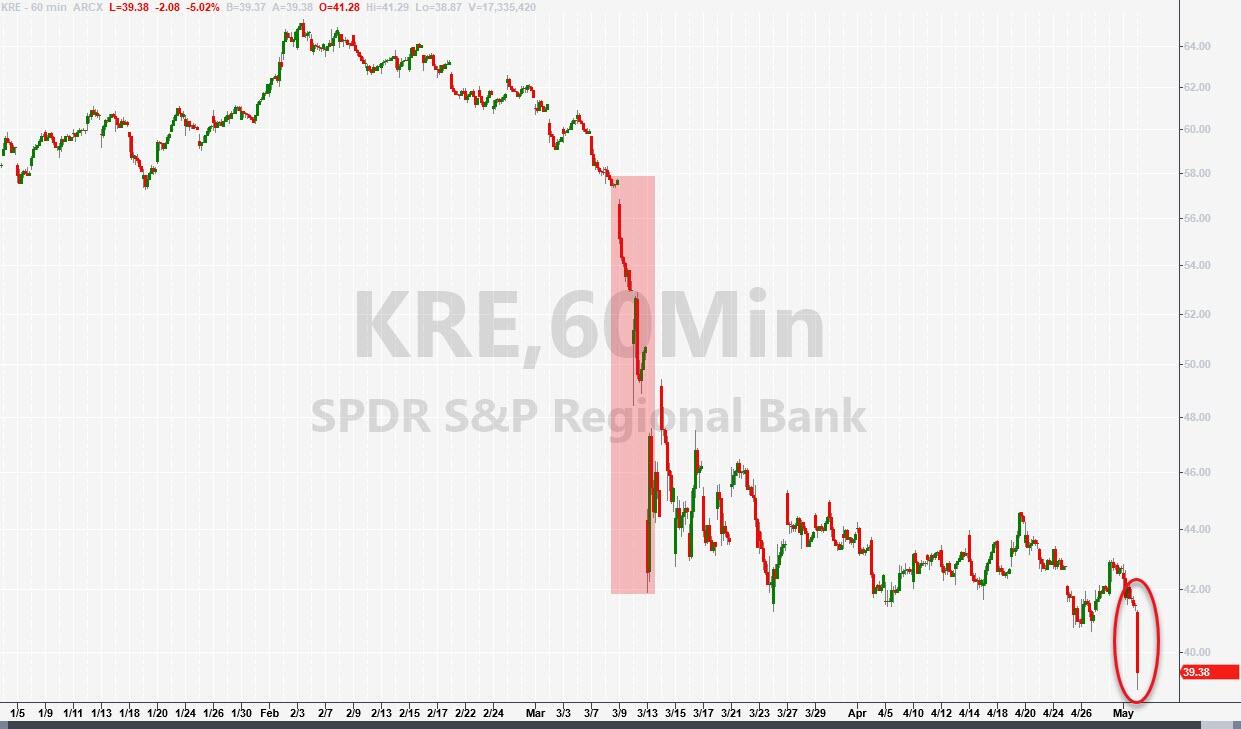
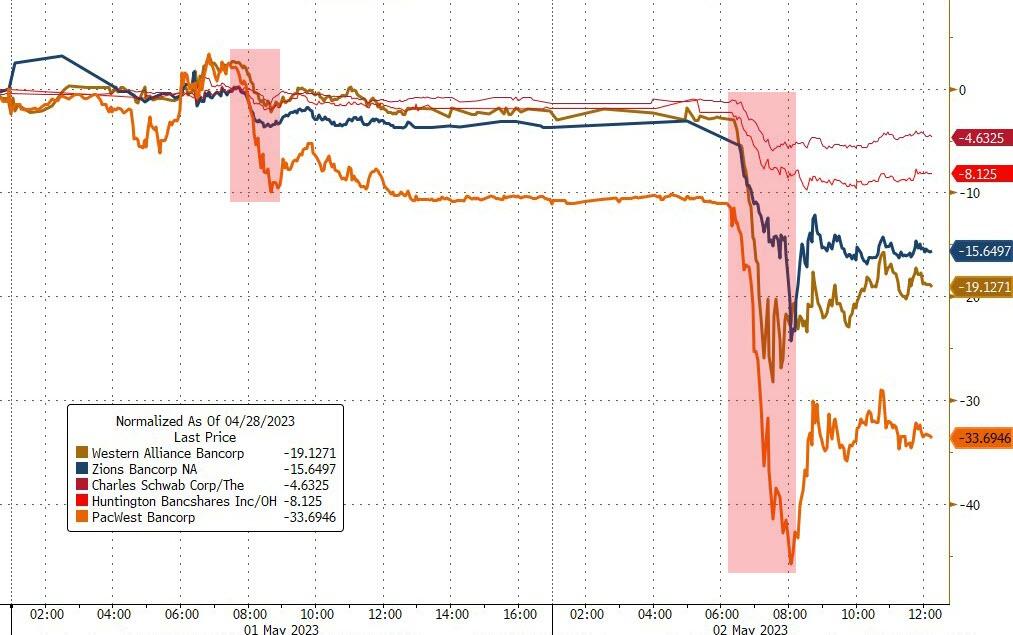
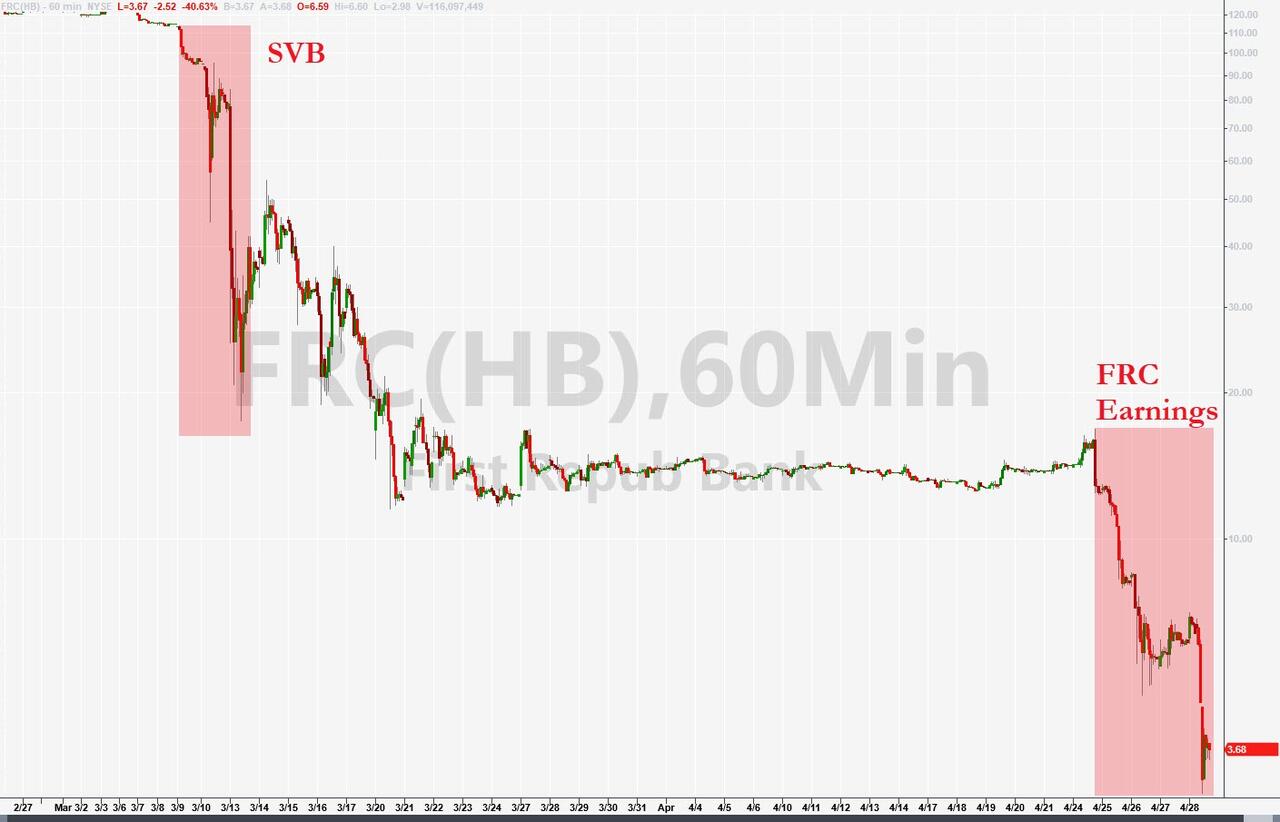
It was only a few hours later when the next cockroach surfaced, namely PacWest bank, which has been assessing “strategic options,” including a sale. To me, that means that the “sound and resilient” nonsense is simply another failed Fed assessment like “inflation is transitory.

On that topic, Powell uttered the following:

“We on the committee have a view that inflation is going to come down not so quickly. It will take some time, and in that world, if that forecast is broadly right, it would not be appropriate to cut rates and we won’t cut rates.”

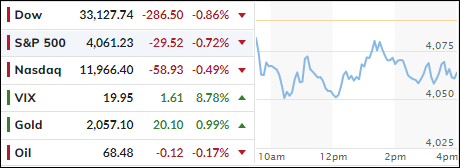
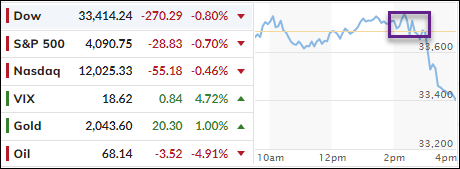
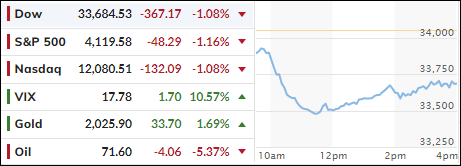
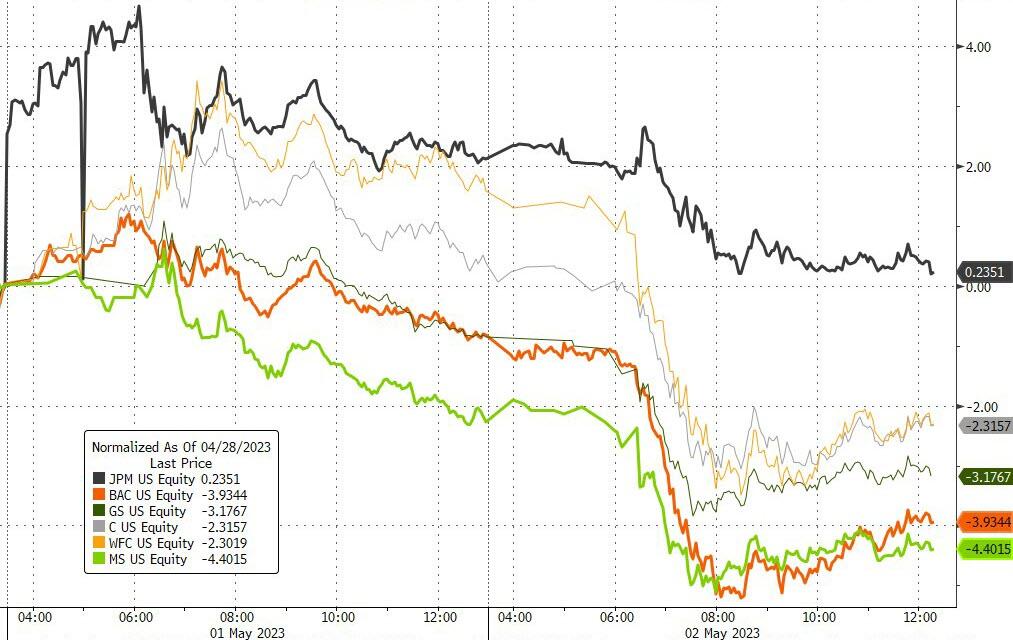
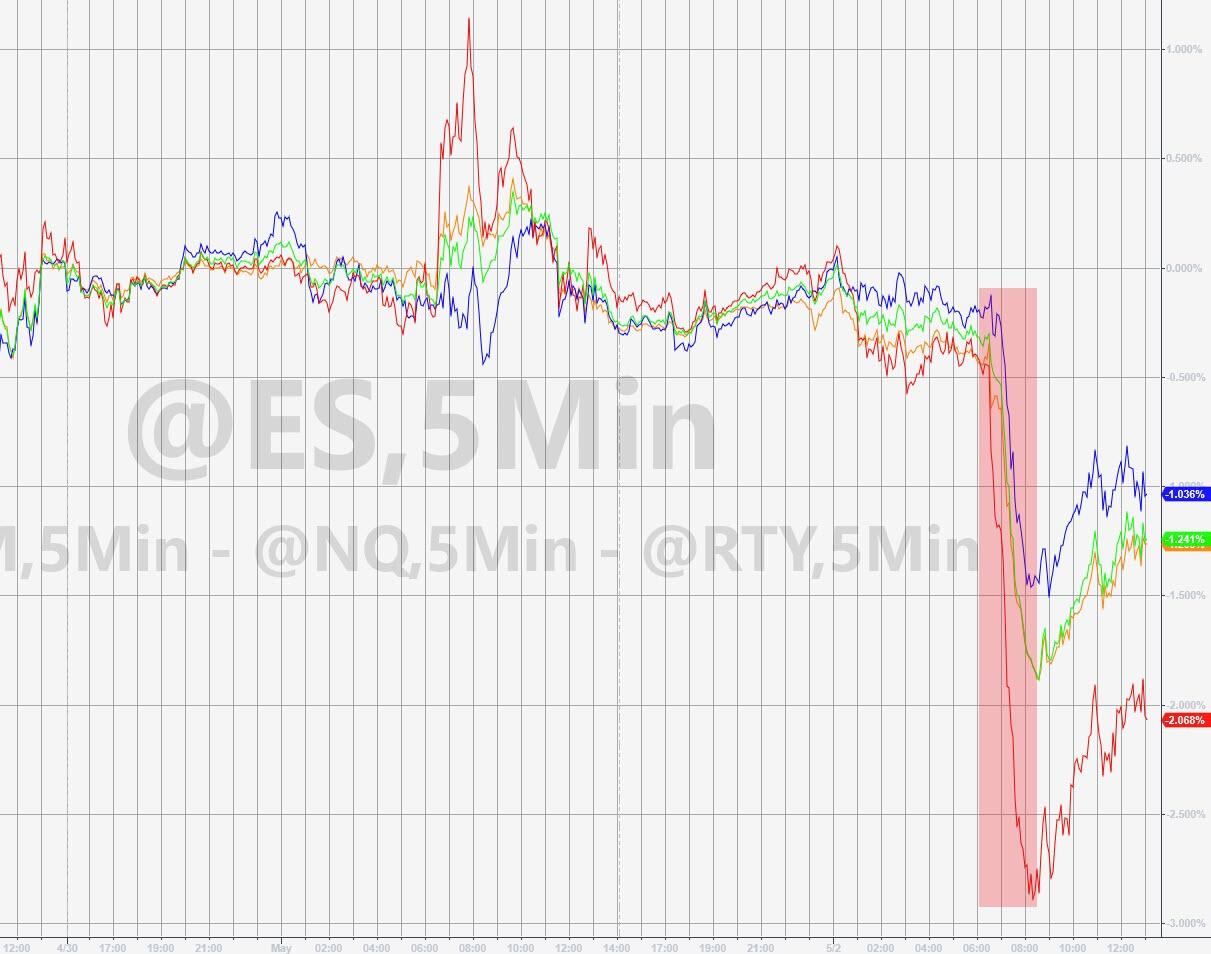
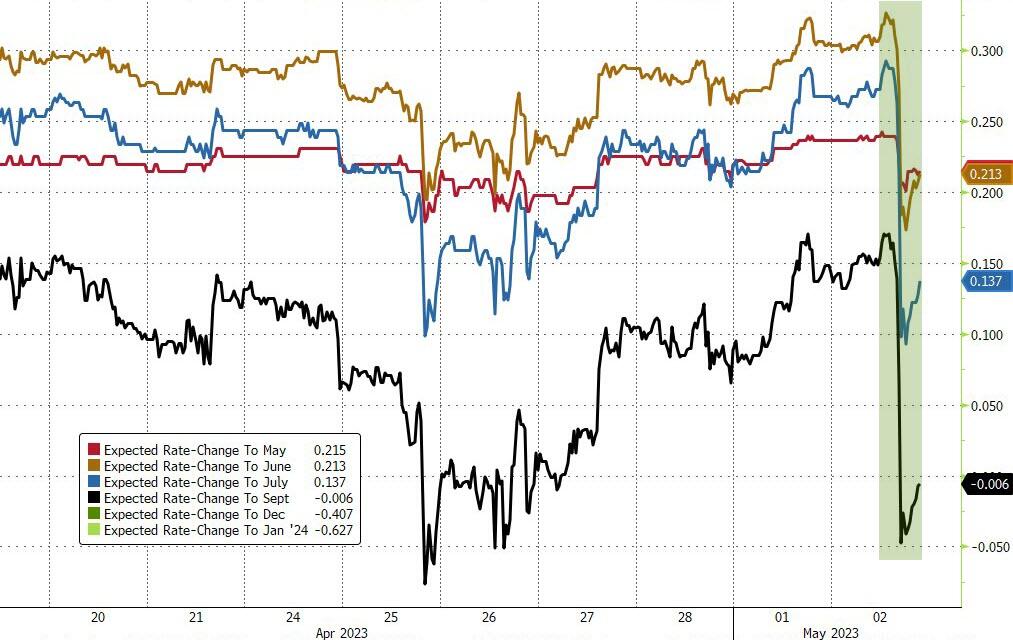
Mixing his hawkish outlook with the constantly worsening banking crisis, you now have the perfect combination of what might give equities a knock-out punch. Today’s sell-off added another notch to the bearish bedpost, as the markets again were unable to stage any meaningful rebound, with the regional banking index KRE taking another hit, as some of its members, like WAL and PACW, were severely clubbed.  

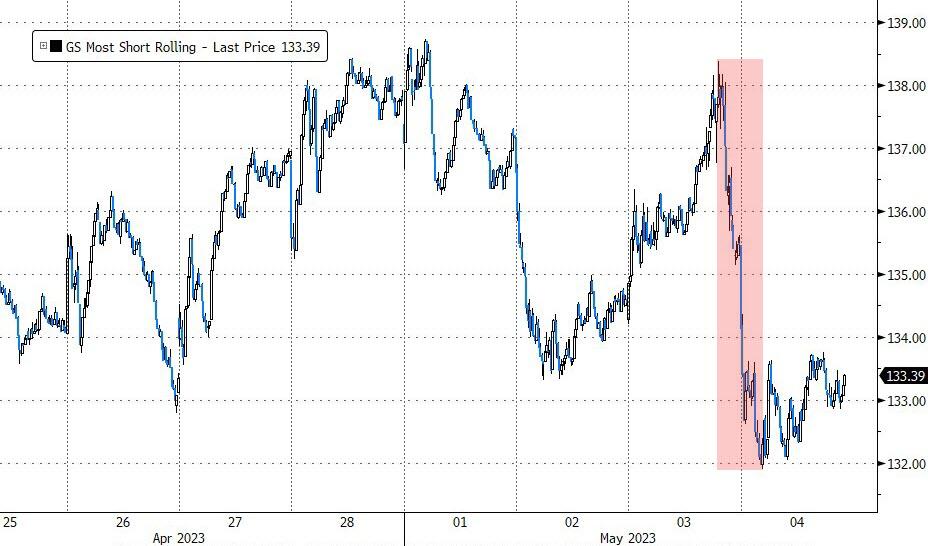
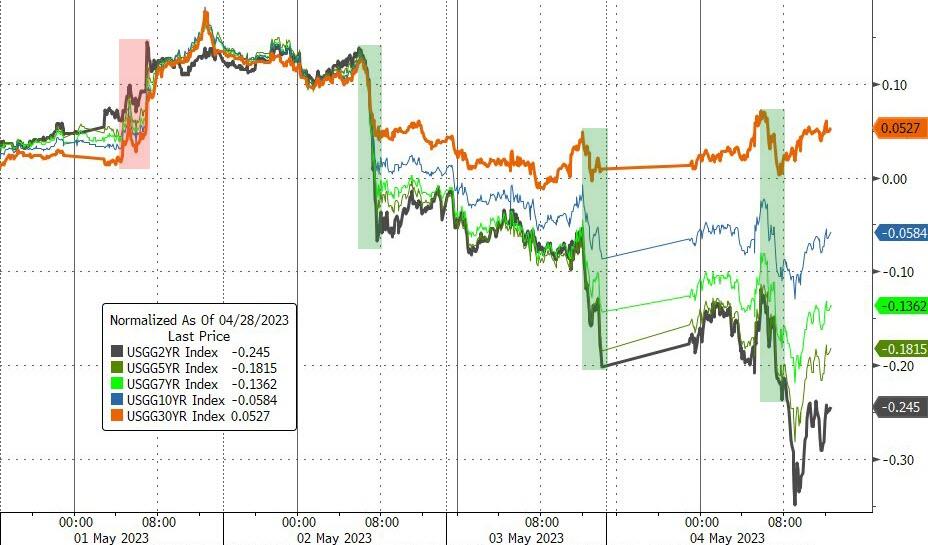
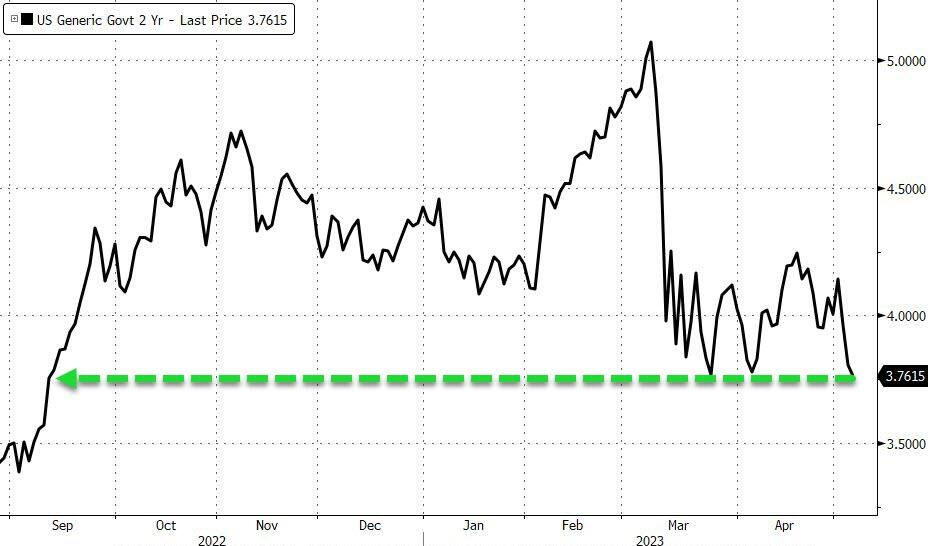
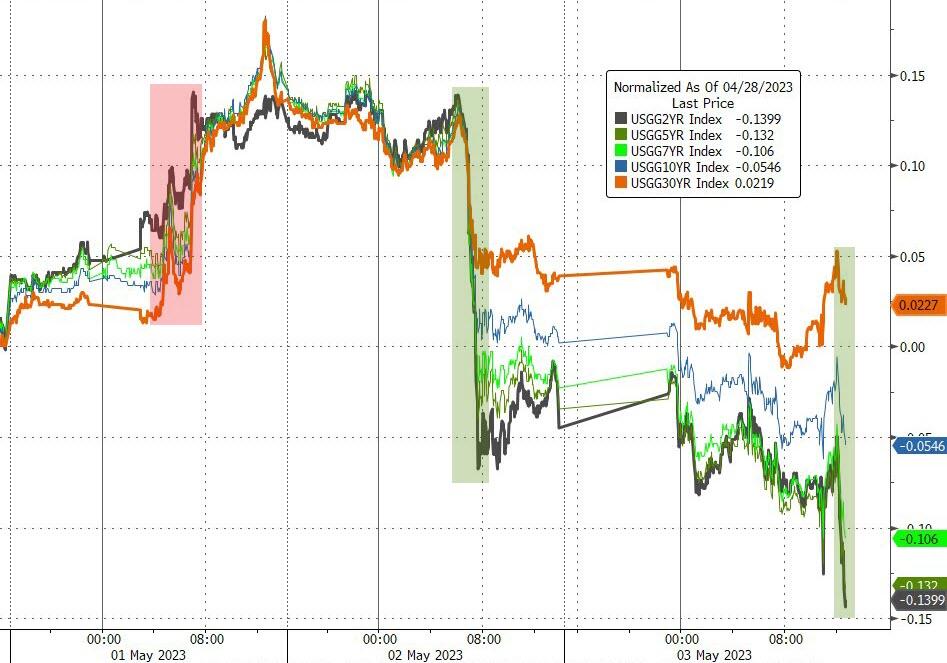
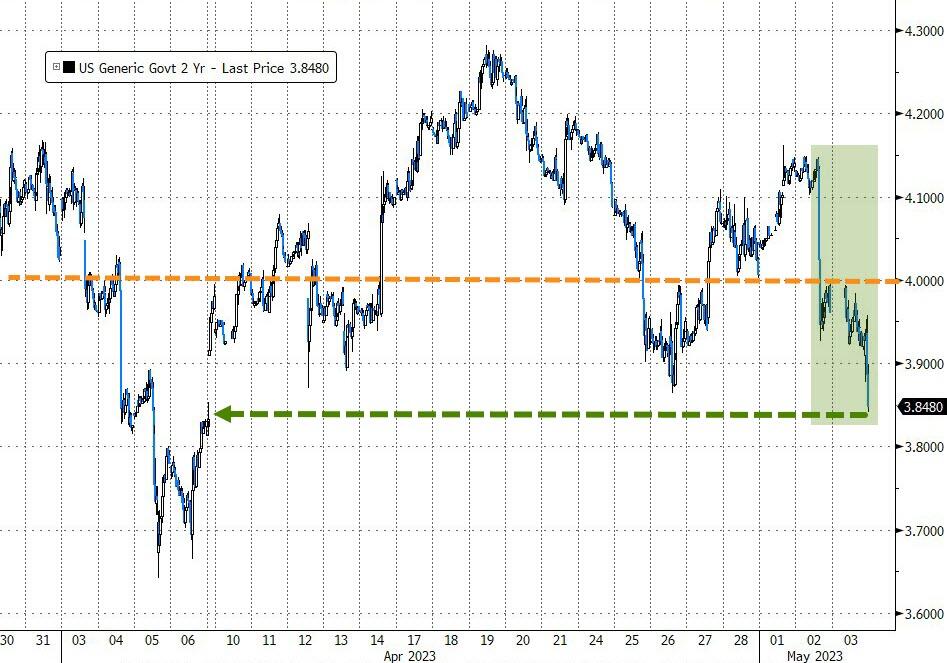
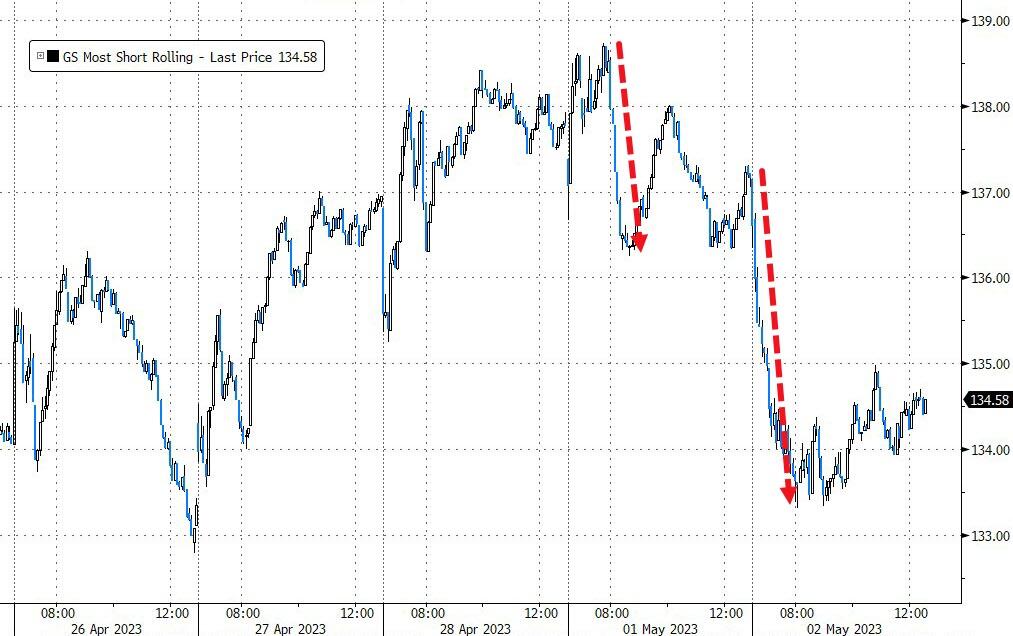
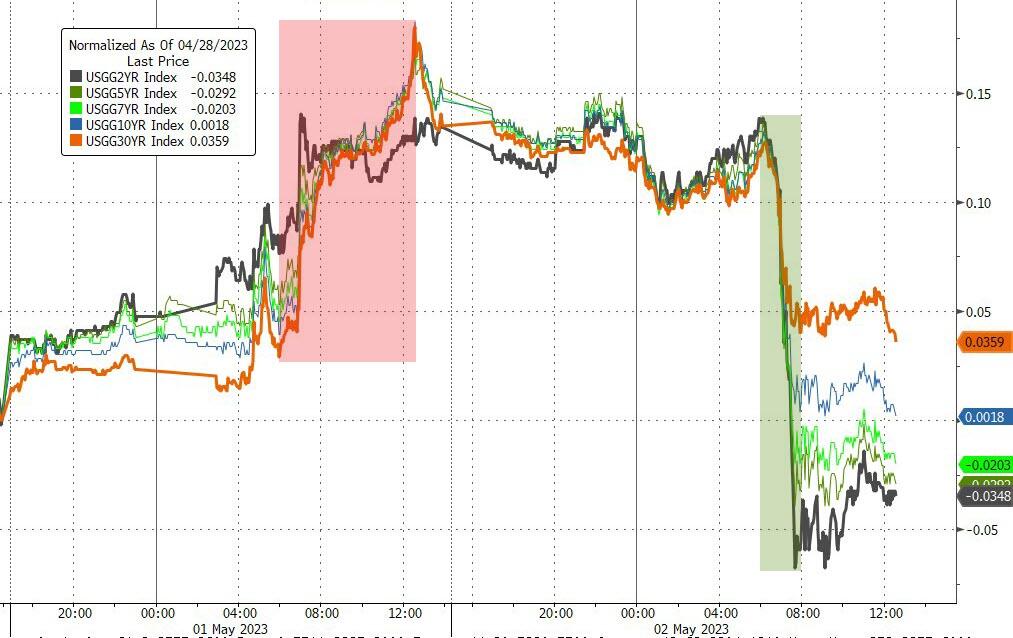
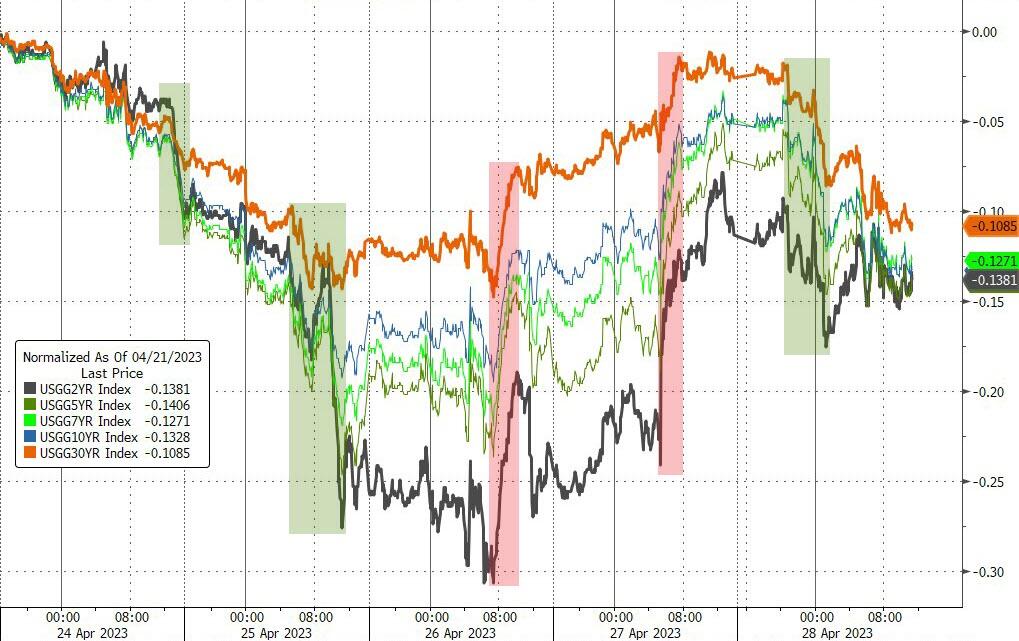
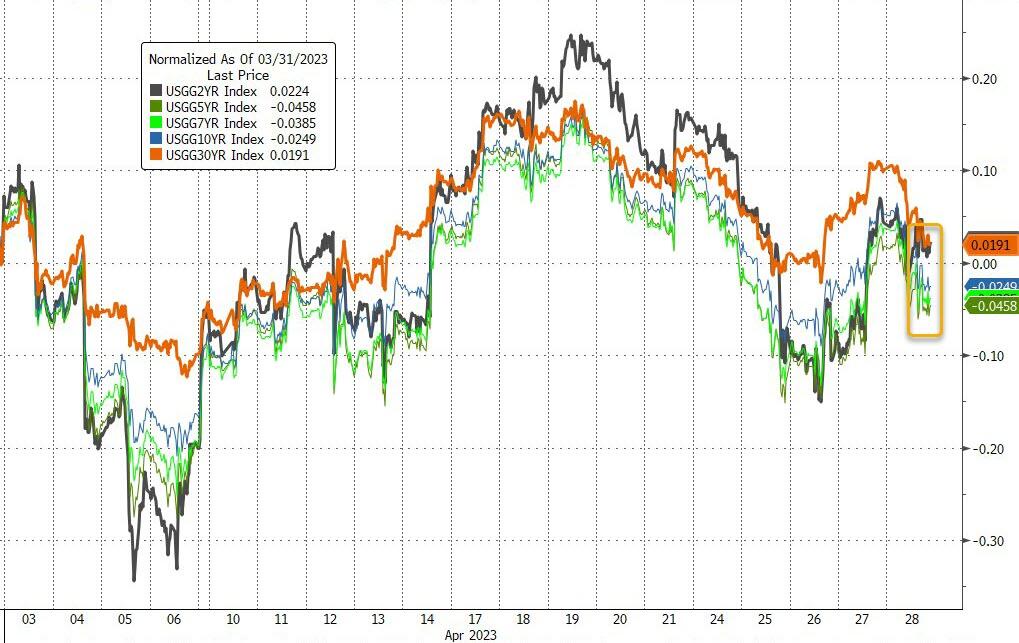
The usual short squeeze was conspicuously absent, Bond yields went sideways, with the 2-year closing at its lowest since September 2022, as ZeroHedge elaborated.

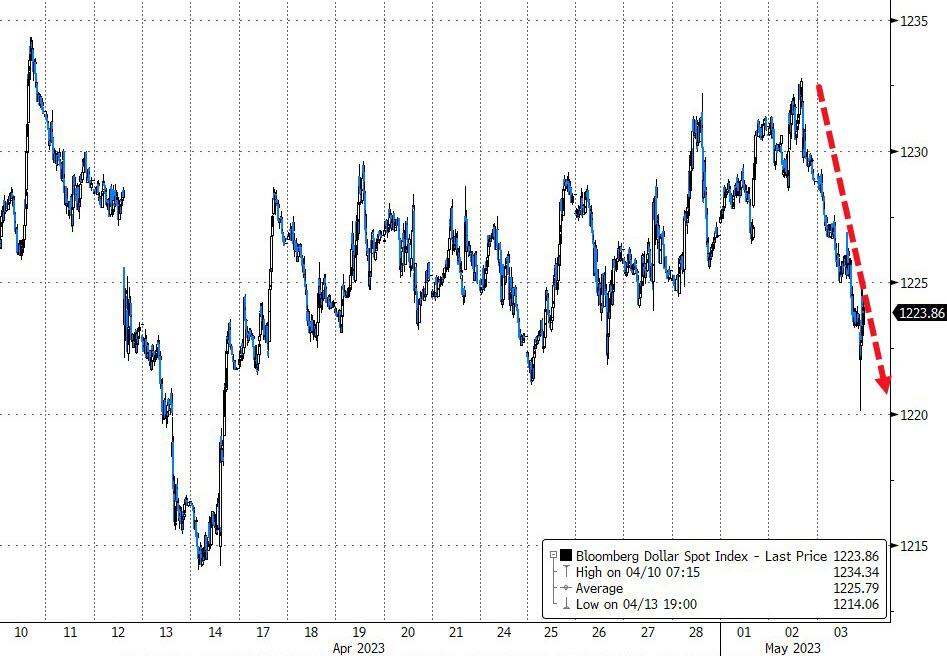
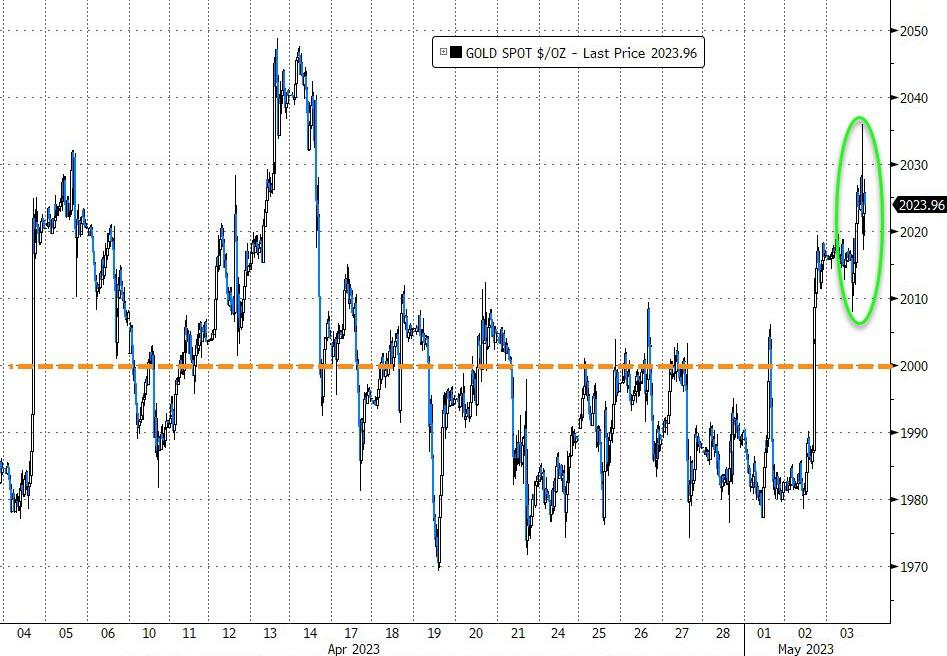
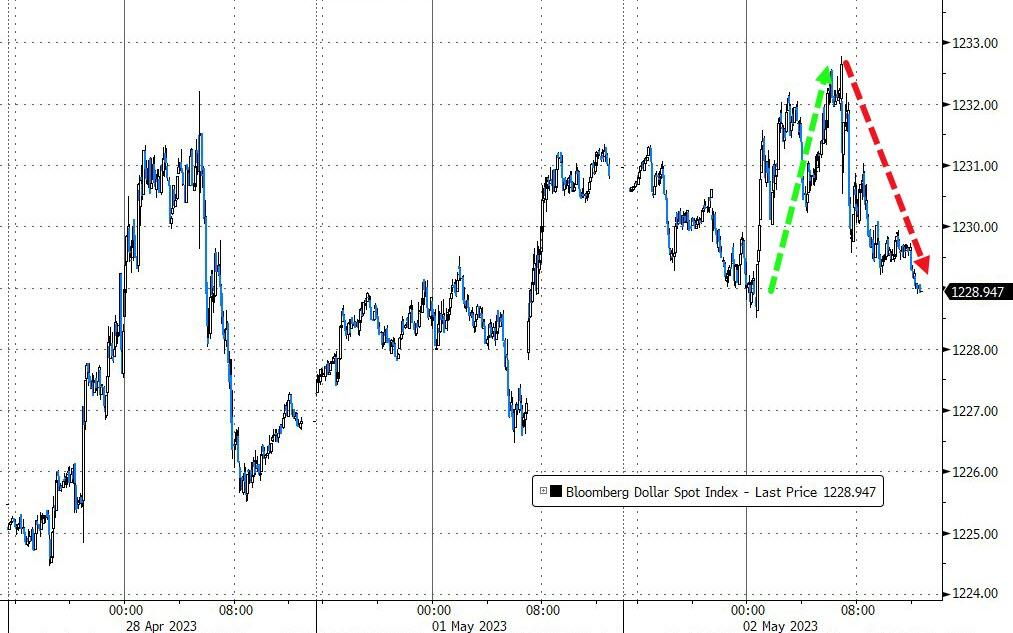
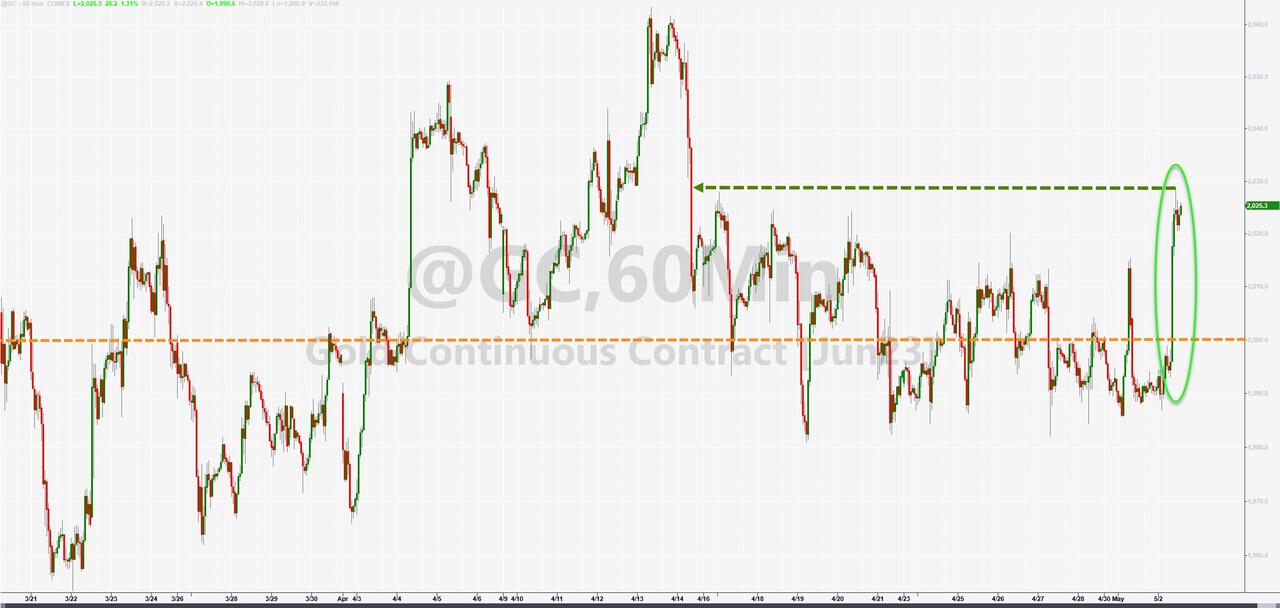
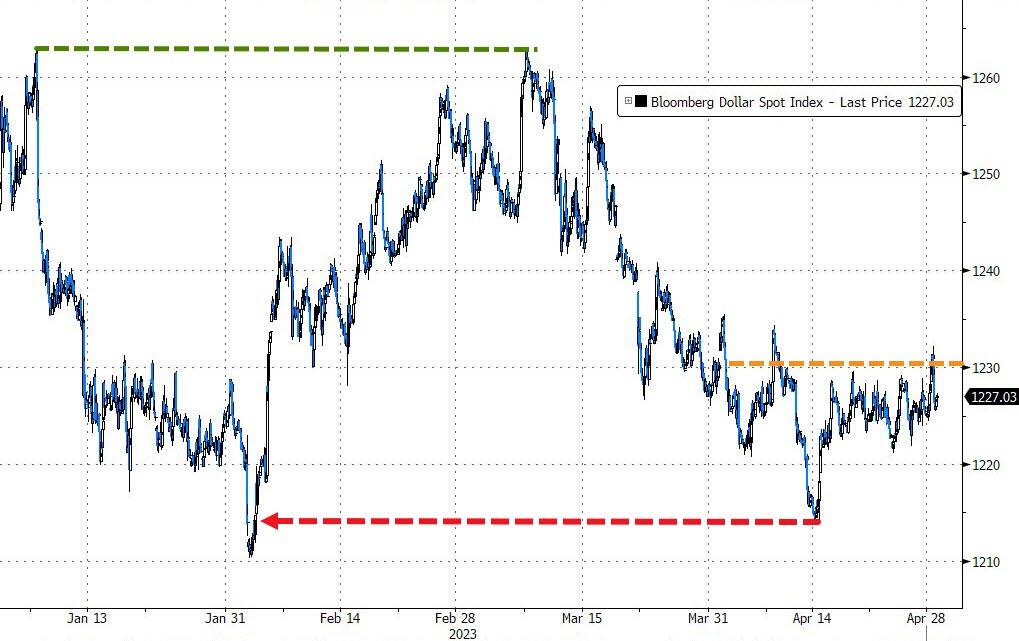
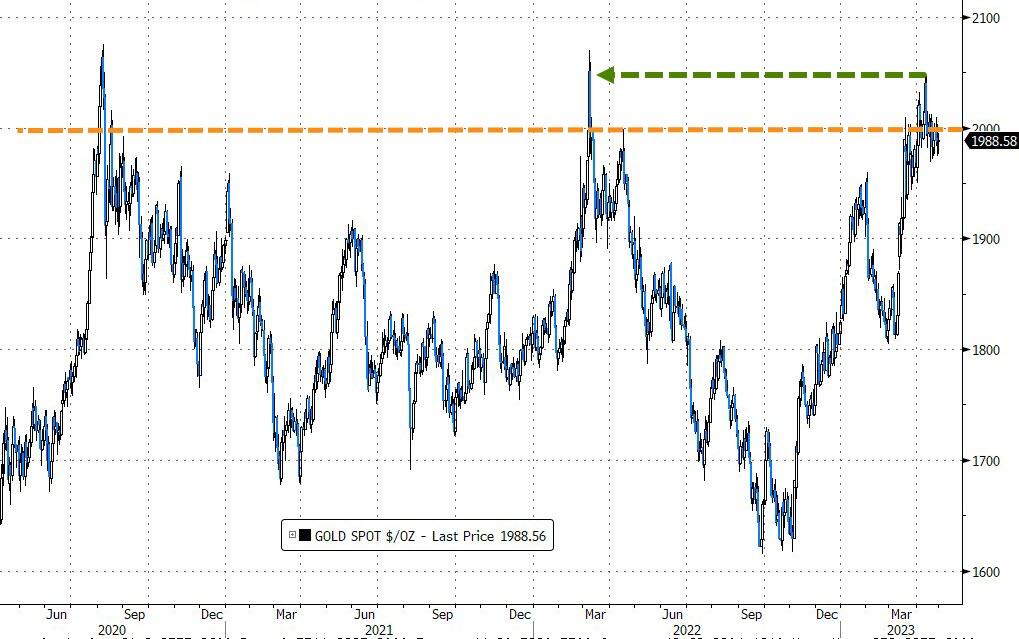
The US Dollar went nowhere, but Gold saved the day again by being the “go to” asset class for safe haven seekers.

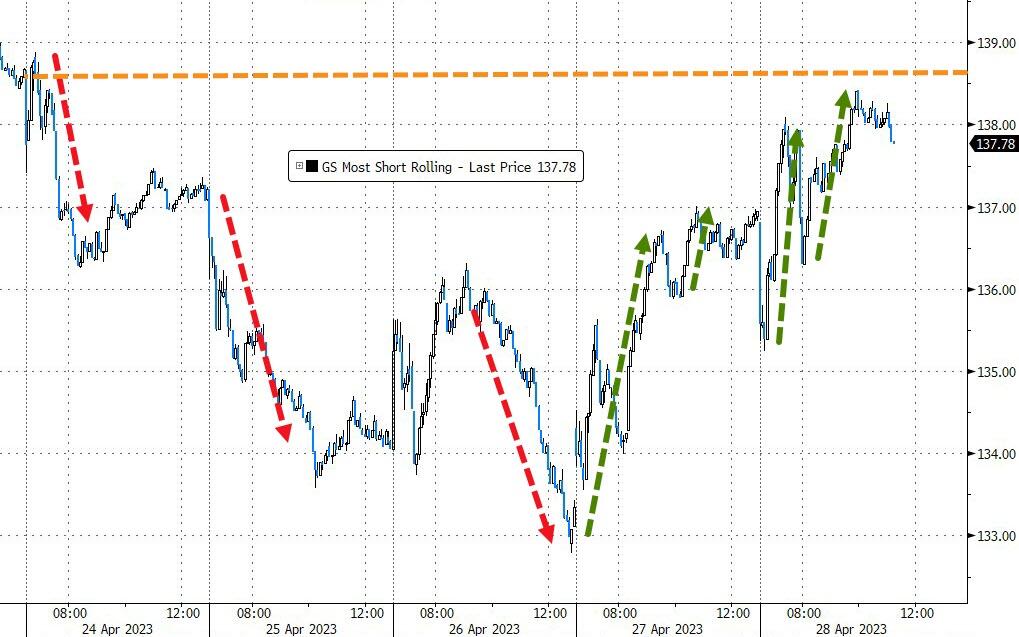
Apple earnings, due out after the close, could be a game changer tomorrow. Looking at the big picture, however, I am more in tune with the Goldman Sachs trader, who uttered this spot-on remark:

What’s coming in the markets is like when Indiana Jones was running from the boulder.

Read More

The Fed Disappoints—Markets Sell Off

Ulli Market Commentary Contact

[Chart courtesy of MarketWatch.com]

  1. Moving the markets

As expected, the Fed raised their interest rate by 0.25%, but traders were more interested in the accompanying statement, and that’s where the disappointment came in.

The statement was a hawkish pause, which signaled that “some additional policy firming may be appropriate,” as opposed to what traders had hoped for, namely “some additional policy easing may be appropriate.”

For a while, confusion reigned, as Wall Street came to grips with what was said, and how it could be interpreted, with the major indexes chopping up and down (see chart above), before the bears stepped in and took the upper hand.

Former chair Richard Clarida summed up best the tight spot the Fed finds itself in:

The chair will have his work cut out for him because when the chair will say ‘pause,’ the markets may hear ‘done.’ And if he says it again, they may hear ‘rate cuts.’

And that’s exactly how the market has reacted over the past year, in that Powell’s words were ignored in favor of what the markets wanted to hear.

In the meantime, the banking crisis goes on, and it remains to be seen how many of the 4,000 banks will follow the same downward path. You may not think that the 3 banks that failed so far are a big deal, but they are when compared to the events of 2008.

All three had more assets ($549 billion) than all 25 banks ($374 billion) that collapsed in 2008. That is a sobering statistic, and should the domino effect continue, which I believe it will, equities will be severely affected.

The Regional banks took another hit, after Powell announced that the banking system was sound and resilient. Huh? Bond yields tumbled, with the 2-year again losing its 4% level.  

The US Dollar tanked and reached 2-week lows, which was a benefit for Gold, as the precious metal solidified its position above the $2k level.

Read More

Gravity Leaves Its Mark

Ulli Market Commentary Contact

[Chart courtesy of MarketWatch.com]

  1. Moving the markets

After a flat session yesterday, gravity set in and pulled the major indexes into a deep hole, with the Dow being down over 500 points early on. A slow recovery helped lessen the pain, but in the end, losses exceeded 1% with the S&P 500 faring the worst.

Right after the opening bell, the bears took control of the market direction, supported by a host of issues—and south we went.

Contagion in the regional banking sector returned, as the stability of smaller regional institutions was on traders’ minds. The regional bank index KRE got hammered, as some of its members imitated their best bungee jump—without much bungee.  

Even some of the big banks participated in this contest, followed by the majors, as a short squeeze was nowhere in sight to save equities. Bond yields collapsed, with the 10-year dropping 14 basis points to close at 3.43%, thereby pulling rate hike expectations off their lofty levels.

The Fed’s 2-day meeting contributed to this chaotic session, even though it is widely expected that they will increase rates again by 0.25% tomorrow at 11 am. The big question is whether they will give any clues as to a potential pause, or if their resolve to fight inflation outweighs recessionary fears.

Adding to today’s turmoil was the unexpected announcement by the Central Bank of Australia to hike their benchmark rate. Then it was Treasury Secretary Yellen’s turn to add more fuel to the fire, which she did by announcing that the country may hit its debt ceiling much sooner than expected, namely a month from now. Ouch!

The US Dollar dipped, and Gold ripped with the precious metal reclaiming its $2k level and scoring a 3-week high.

Who knows what tomorrow will bring, but I am pleased that on this volatile day, our portfolios managed to eke out a moderate gain. Once the Fed’s decision is published, we could see markets pump or dump some 1.5-2%.

Read More

ETFs On The Cutline – Updated Through 04/28/2023

Ulli ETFs on the Cutline Contact

Below, you can evaluate the latest High-Volume ETF Cutline report, which shows how far above or below their respective long-term trend lines (39-week SMA) my currently tracked ETFs are positioned.

This report covers the HV ETF Master List from Thursday’s StatSheet and includes 312 High Volume ETFs, defined as those with an average daily volume of more than $5 million, of which currently 221 (last report: 210) are hovering in bullish territory. The yellow line separates those ETFs that are positioned above their trend line (%M/A) from those that have dropped below it.

Take a look:                                                                   

The HV ETF Master Cutline Report

In case you are not familiar with some of the terminology used in the reports, please read the Glossary of Terms. If you missed the original post about the Cutline approach, you can read it here.

ETF Tracker Newsletter For April 28, 2023

Ulli ETF Tracker Contact

ETF Tracker StatSheet          

You can view the latest version here.

PUMPING INTO THE WEEKEND

[Chart courtesy of MarketWatch.com]

  1. Moving the markets

If it hadn’t been for the Ramp-A-Thon over the last two trading days of the month, the S&P 500 would have ended in the red during April.

The Fed’s favorite Personal Consumption Expenditure price index (PCE) rose 0.3% in March, meeting expectations and therefore supporting the bullish theme for the moment.

Earnings were mixed, but FactSet reported that just over half of the S&P 500 companies have reported earnings so far, with 80% beating he much-lowered expectations, which in Wall Street’s way of looking at things creates a better sentiment, as markets don’t like to hear about misses. Go figure…

Yesterday’s economic news showed that Pending Home Sales dropped in March, as mortgage rates surged. Even the fact that Q1 GDP turned out much weaker than expected, as it slid from 3% in late March to only 1.1% yesterday, it could not generate a bearish response.

First Republic Bank (FRC) seems to be the next cockroach on the chopping block, after hope for a private deal turned out to be misplaced, with the stock taking another dump. The potential for a weekend bailout certainly exists, and could create a systemic threat, but none of that was able to disturb the bullish mood during this last trading day of April.

Not even the prospect of looming US debt defaults provided hesitancy in the markets due to the above-mentioned fantasy of “earnings beats” overriding all concerns. I suspect that this exuberant attitude will come to an end, as we move into May.  

Of course, these kinds of bullish moves never happen in isolation, so it came as no surprise that the usual short-squeeze made its presence felt and assisted with this 2-day bullish run. Bond yields slipped for the week but were unchanged for the month.

The US Dollar swung wildly during the past 30 days and closed a tad lower, while Gold eked out a tiny gain.  

On a personal note, I will be out Monday afternoon, so I won’t be able write the usual market commentary. However, should the markets behave in a way that threatens our current “Buy” mode, I will post a short update by 6 pm PST.

Read More

Weekly StatSheet For The ETF Tracker Newsletter – Updated Through 04/27/2023

Ulli ETF StatSheet Contact

ETF Data updated through Thursday, April 27, 2023

Methodology/Use of this StatSheet:

1. From the universe of over 1,800 ETFs, I have selected only those with a trading volume of over $5 million per day (HV ETFs), so that liquidity and a small bid/ask spread are assured.

2. Trend Tracking Indexes (TTIs)

Buy or Sell decisions for Domestic and International ETFs (section 1 and 2), are made based on the respective TTI and its position either above or below its long-term M/A (Moving Average). A crossing of the trend line from below accompanied by some staying power above constitutes a “Buy” signal. Conversely, a clear break below the line constitutes a “Sell” signal. Additionally, I use a 12% trailing stop loss on all positions in these categories to control downside risk.

3. All other investment arenas do not have a TTI and should be traded based on the position of the individual ETF relative to its own respective trend line (%M/A). That’s why those signals are referred to as a “Selective Buy.” In other words, if an ETF crosses its own trendline to the upside, a “Buy” signal is generated. Here too, I recommend trailing sell stop of 12%, or less, depending on your risk tolerance.

If you are unfamiliar with some of the terminology, please see Glossary of Terms and new subscriber information in section 9.     

1. DOMESTIC EQUITY ETFs: BUY — since 12/01/2022

Click on chart to enlarge

Our main directional indicator, the Domestic Trend Tracking Index (TTI-green line in the above chart) has reclaimed its long-term trend line (red) by +1.03% and remains in “Buy” mode for the time being.

The link below shows all High Volume (HV) Domestic Equity ETFs. The sorting order is by M-Index ranking. Prices in all linked tables below are updated through 04/27/2023, unless otherwise noted. Price data not yet available at publication is indicated with 00.00% or -100.00%. Please note that distributions are not included in the current momentum numbers.

Whenever the TTI is above the trend line, and therefore in “Buy” mode, you can use the tables in the link below to make your selections:

http://www.successful-investment.com/SSTables/HVDomETFs042723.pdf

2. INTERNATIONAL ETFs: BUY — since 12/01/2022

Click on chart to enlarge

The International Trend Tracking Index (green) has now moved +7.27% above its long-term trend line (red) and is now in “Buy” mode as posted.

Read More