
- Moving the markets
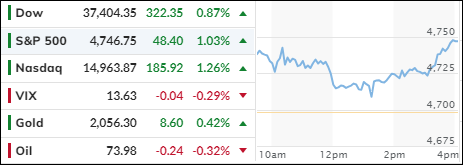
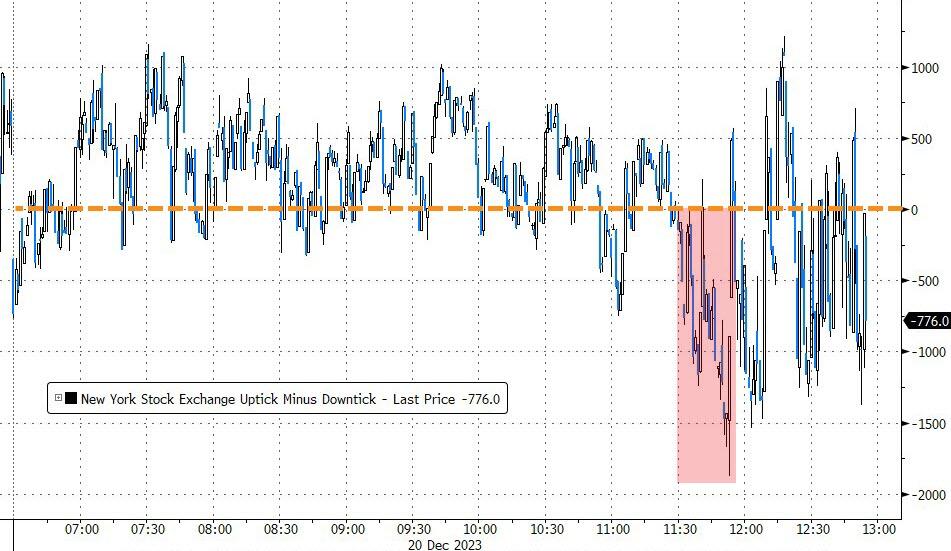
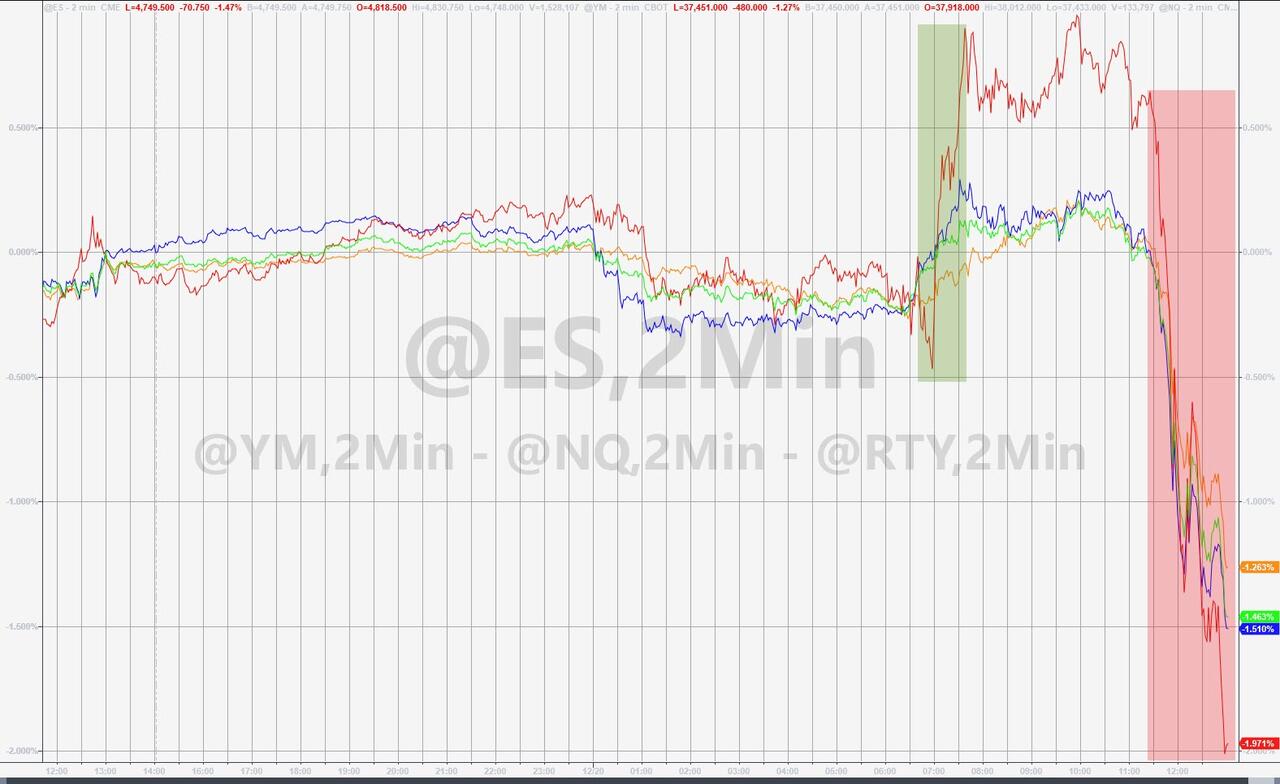
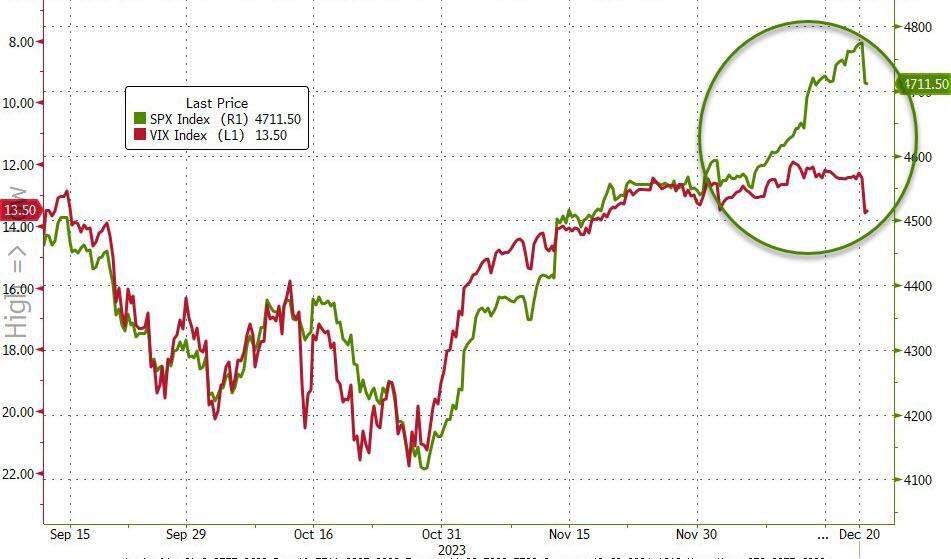
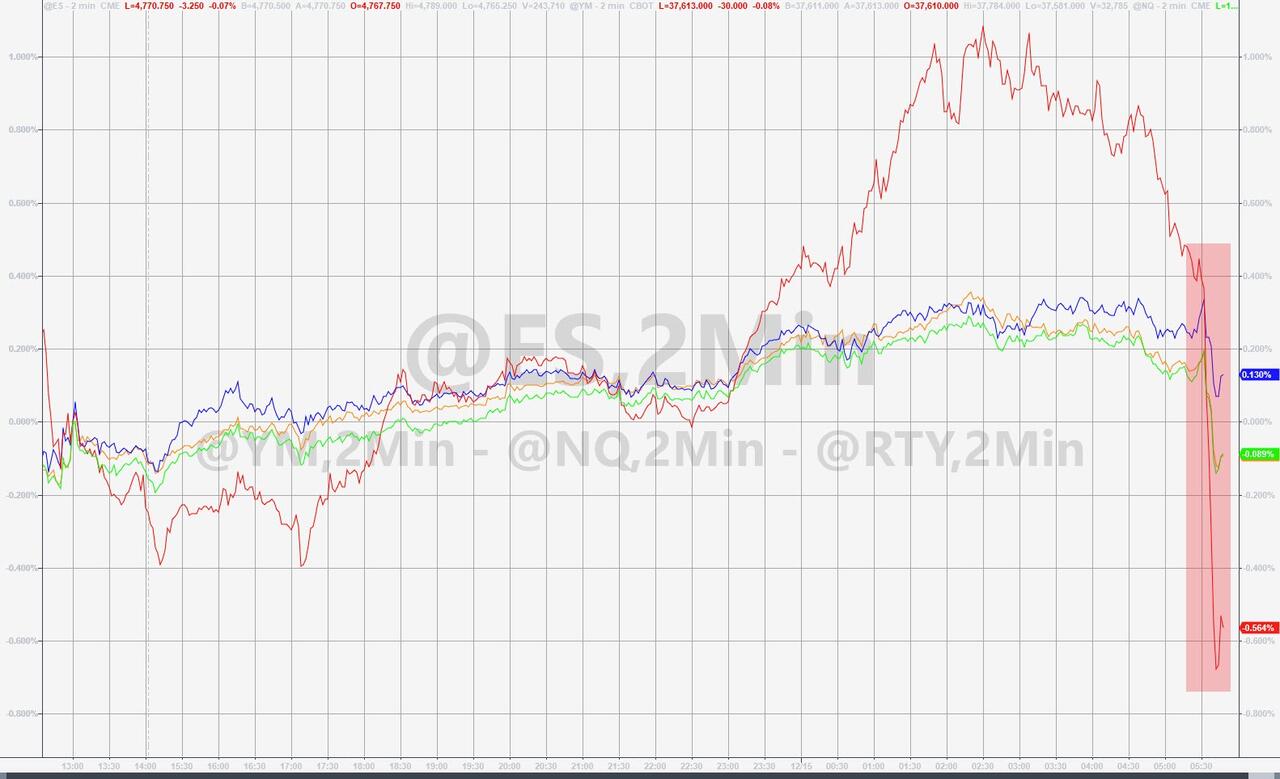
The markets bounced back from yesterday’s beating and regained most of their ground.
Traders are feeling optimistic about the yearend rally and ready to pop the champagne. Almost every stock in the S&P rose, led by Micron Technology, which soared 9% after smashing earnings estimates and raising its outlook.
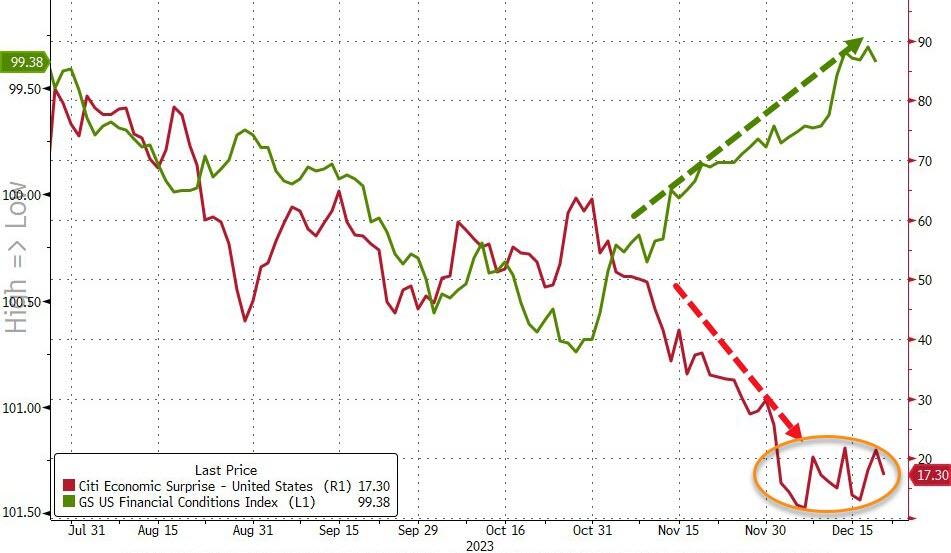
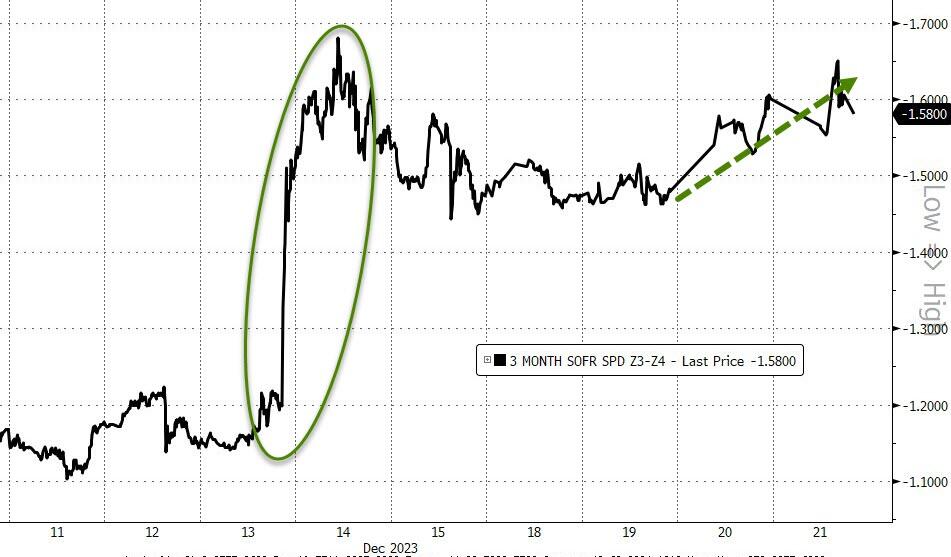
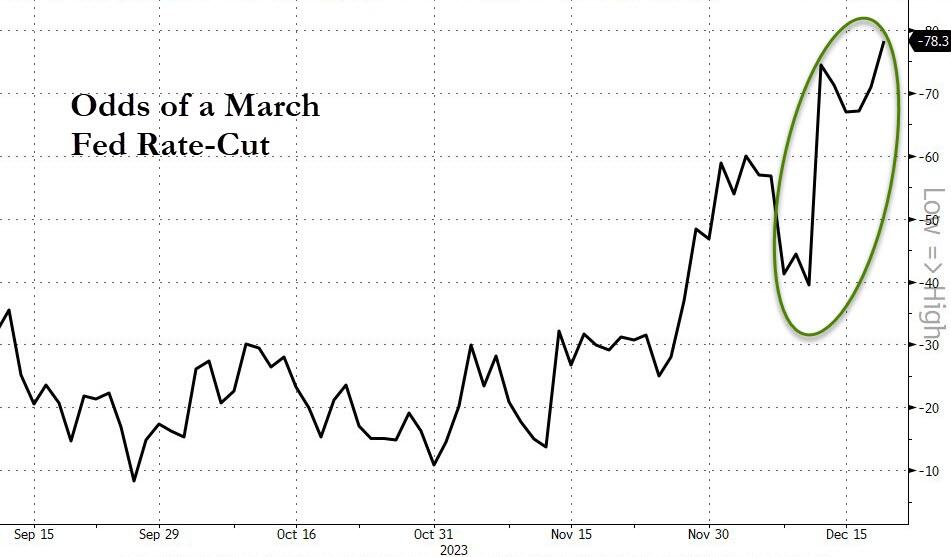
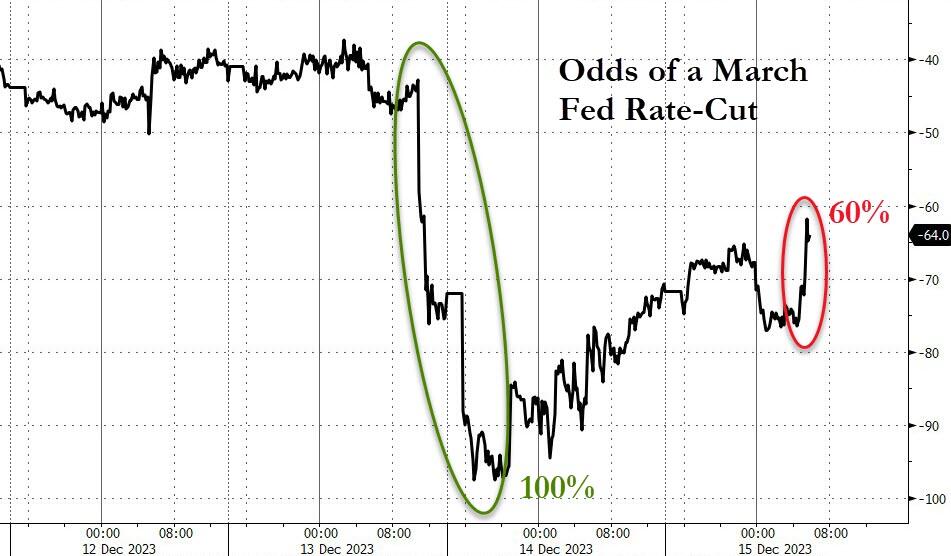
The bulls were also encouraged by weak economic data and easy money policies, which made them think that the economy is just right, not too hot, and not too cold. They used words like “goldilocks,” “soft landing” and “everything is awesome” to describe their euphoria. They are now betting that the Fed will slash interest rates by 160 bps next year, according to ZeroHedge.
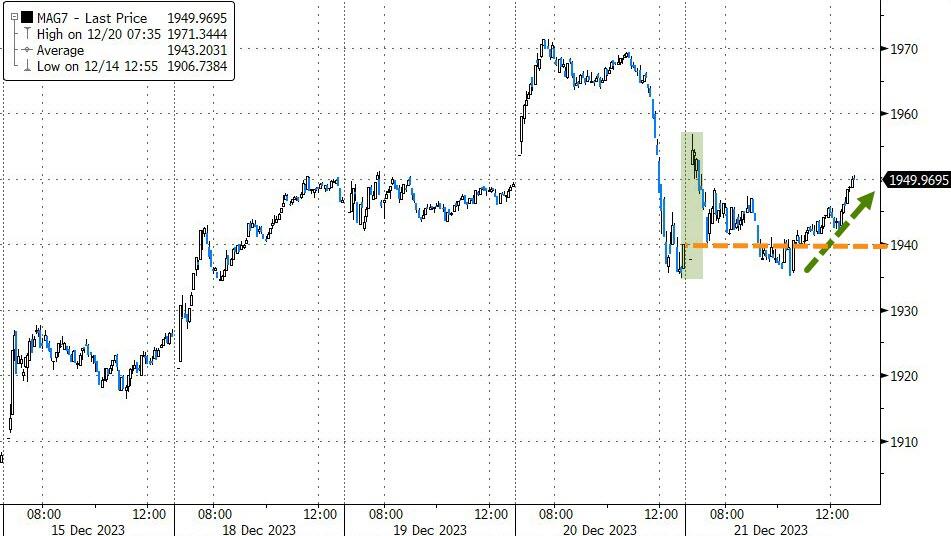
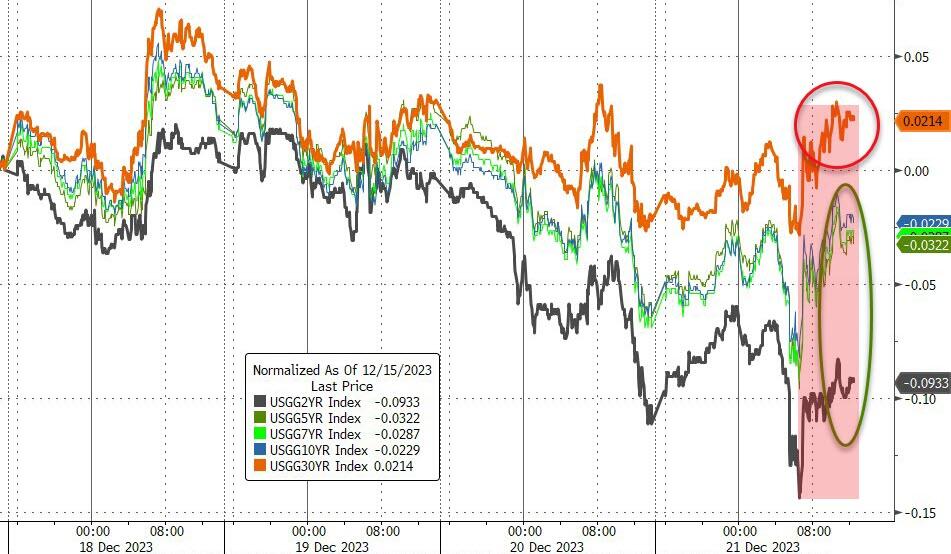
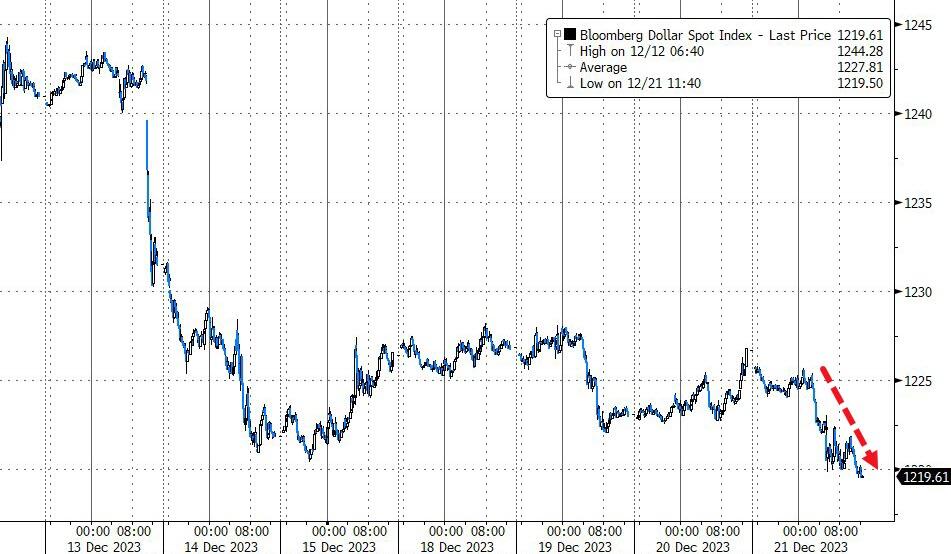
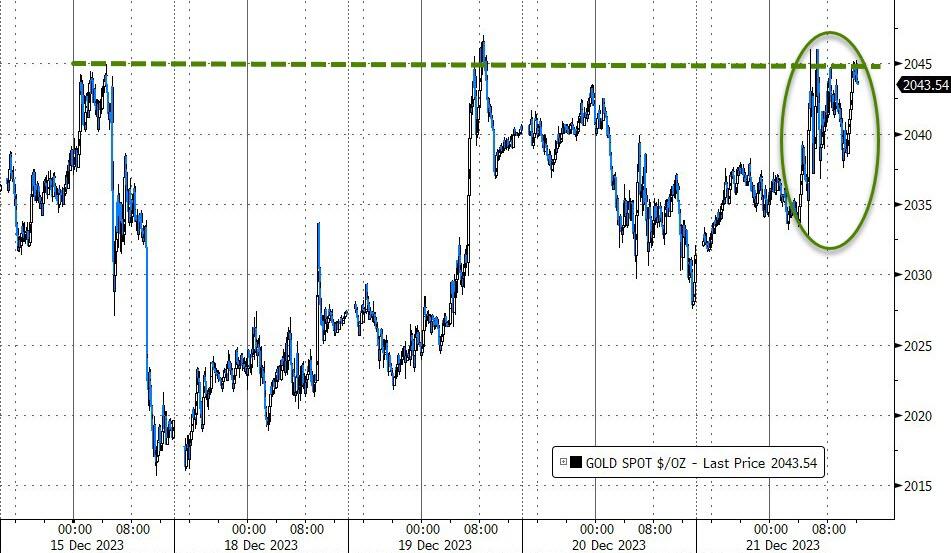
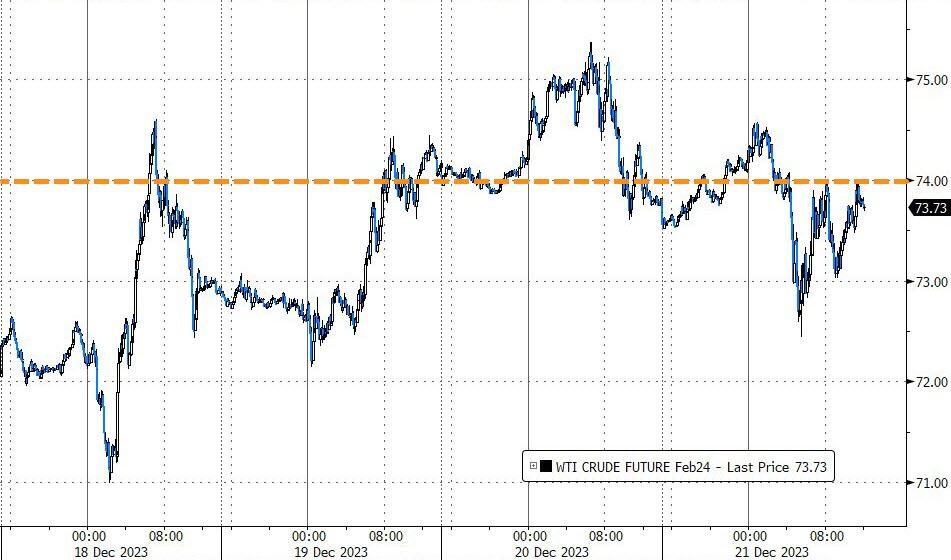
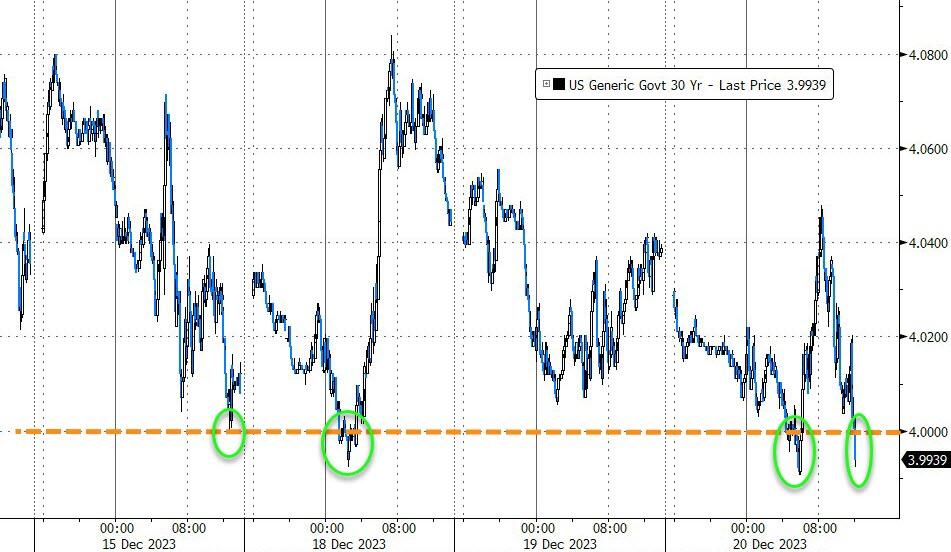
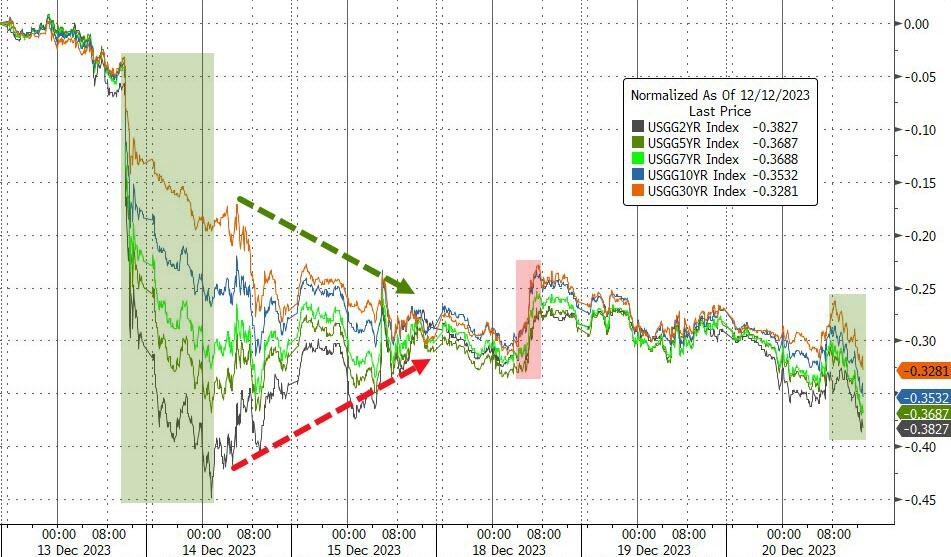
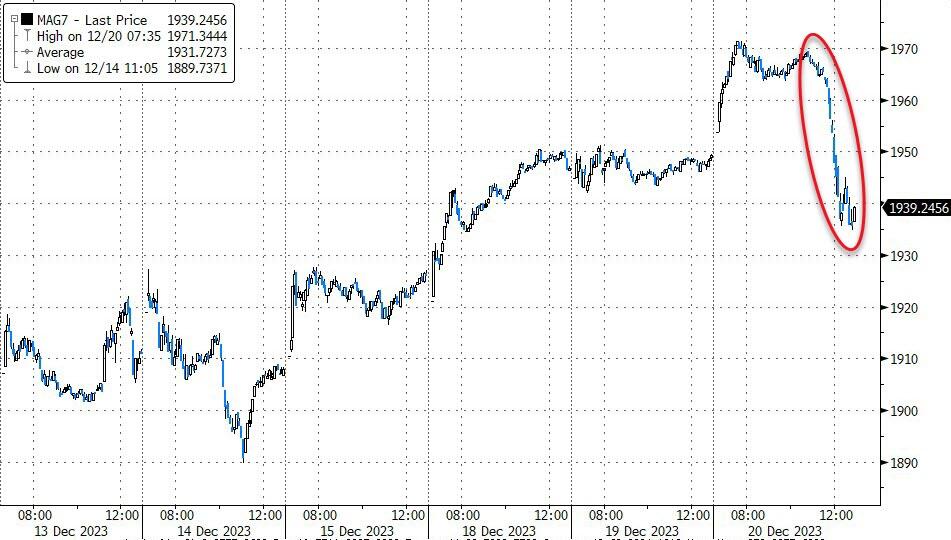
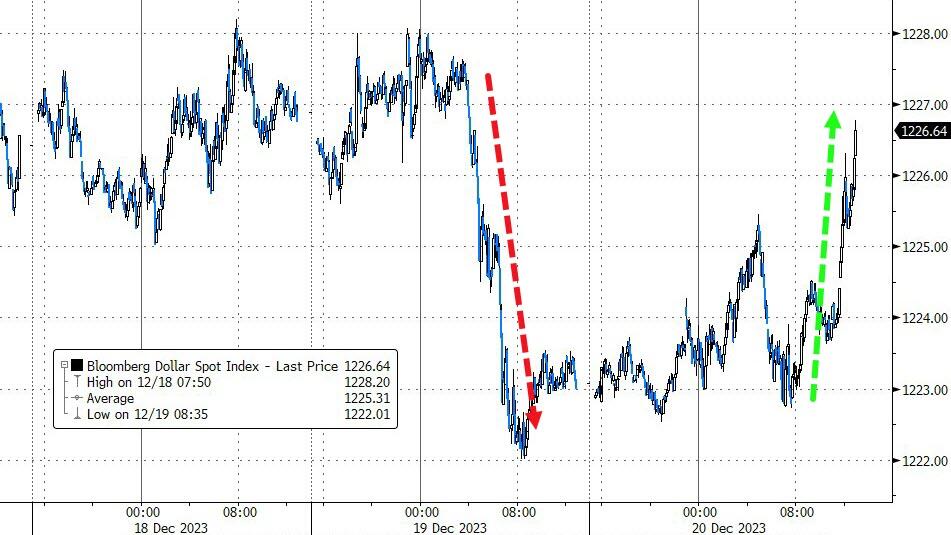
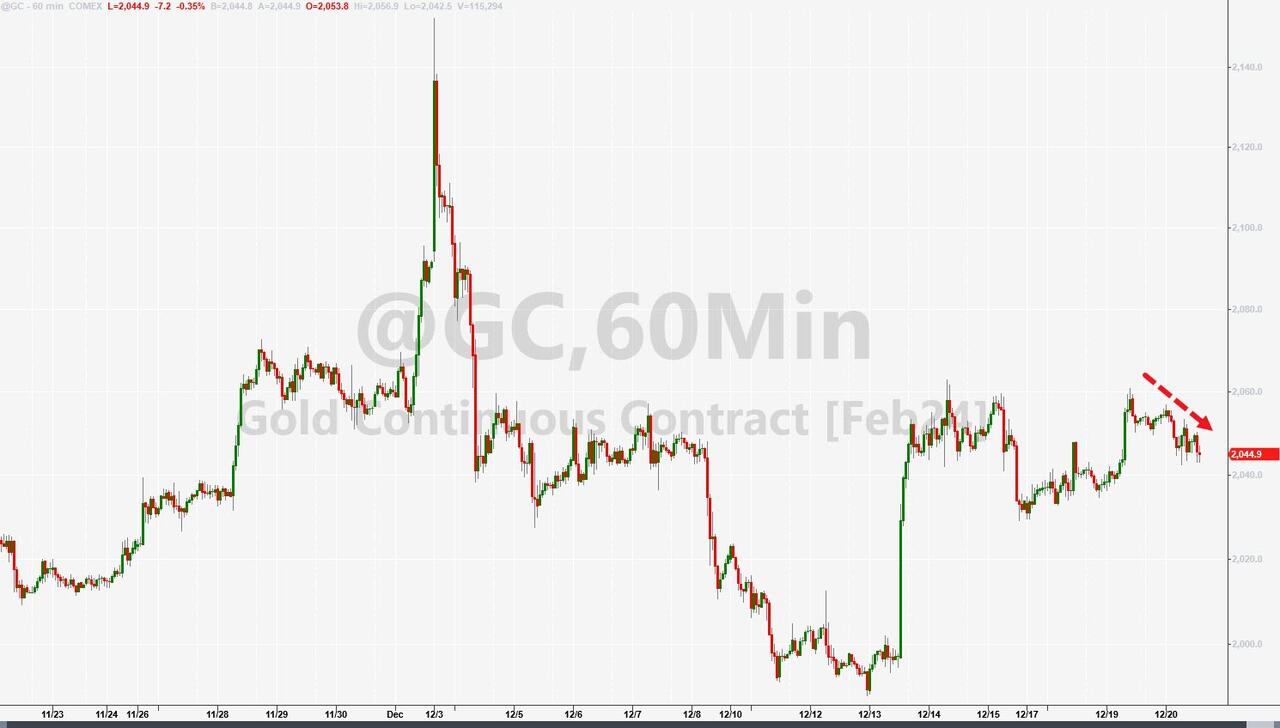
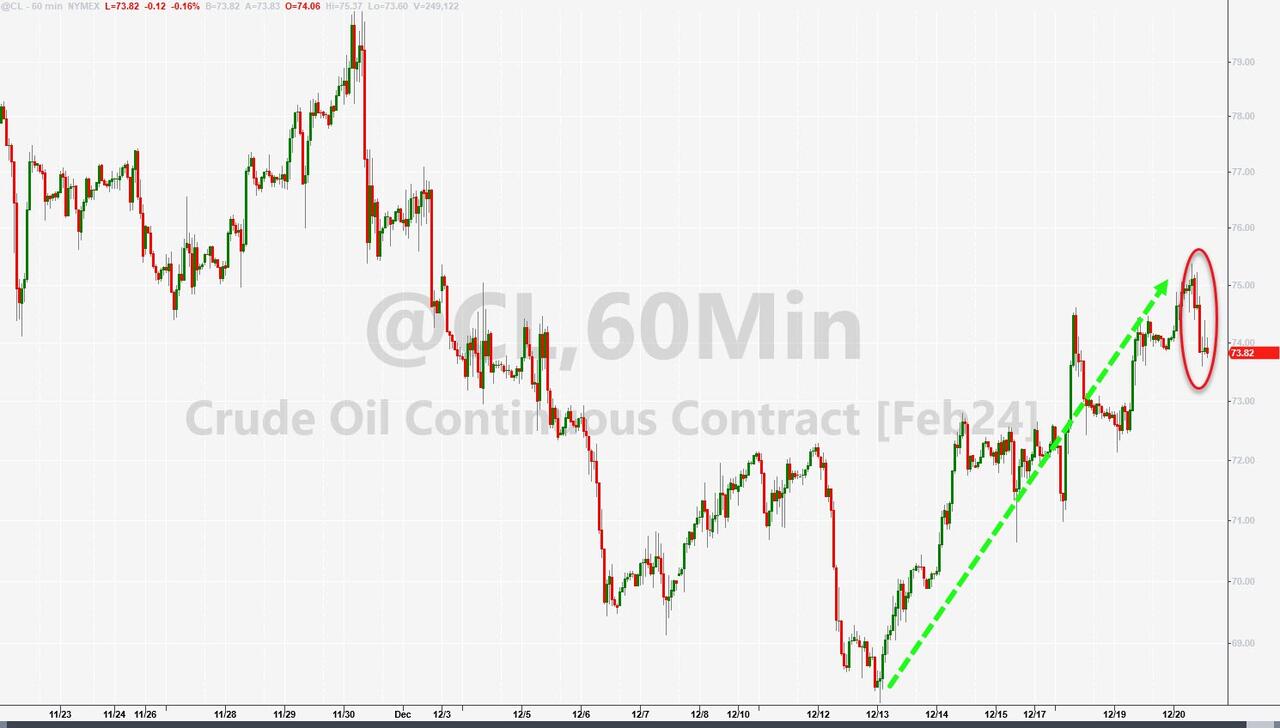
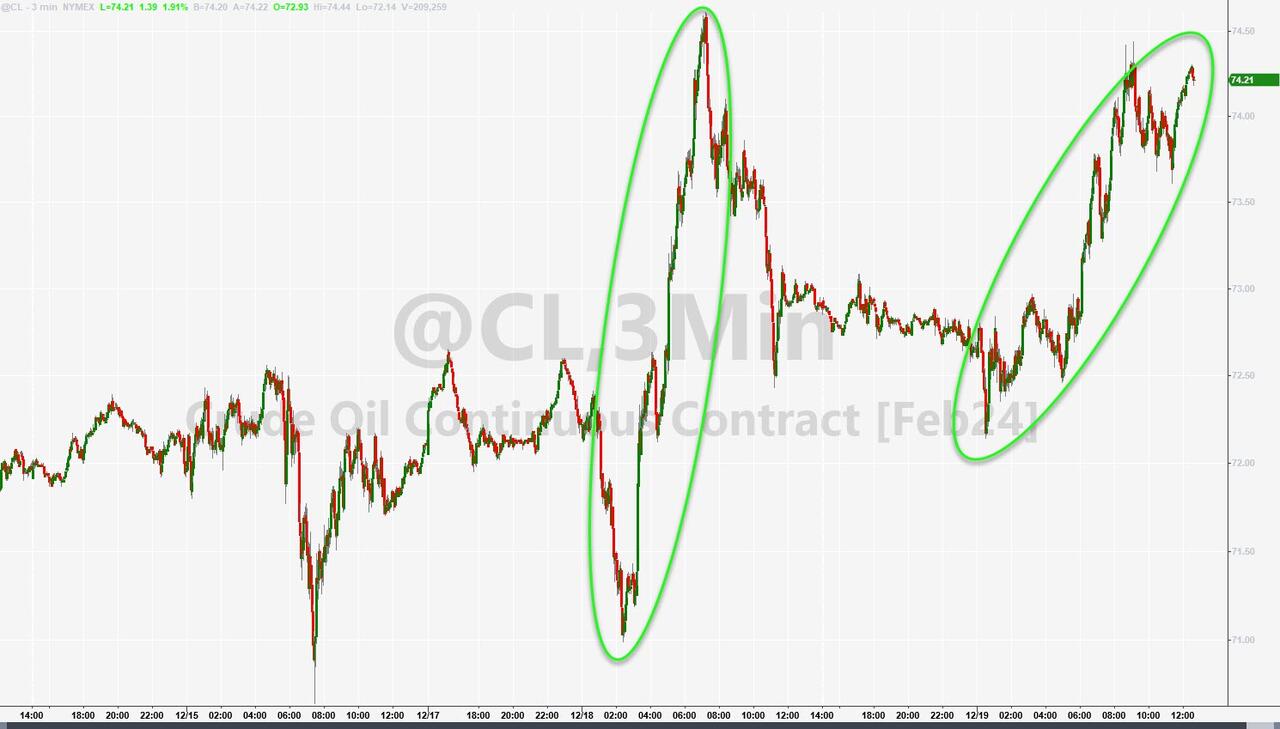
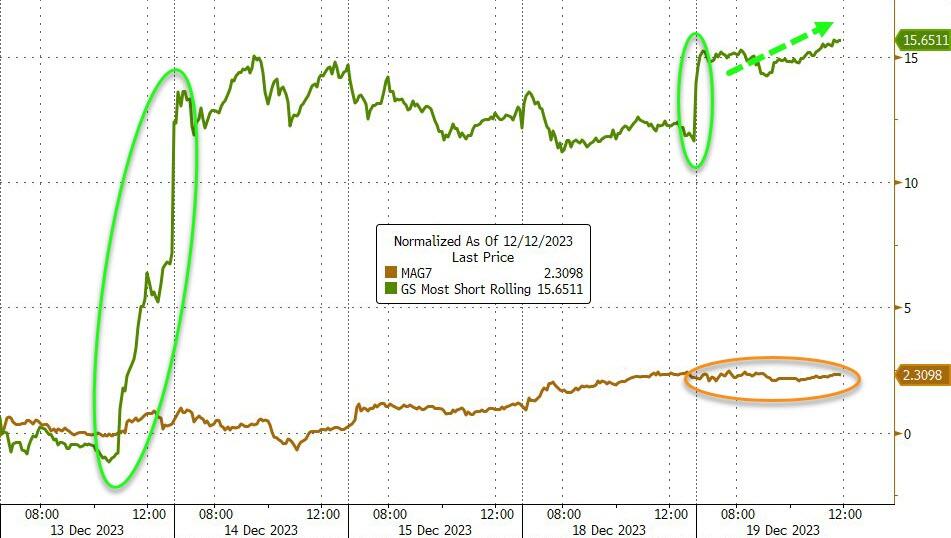
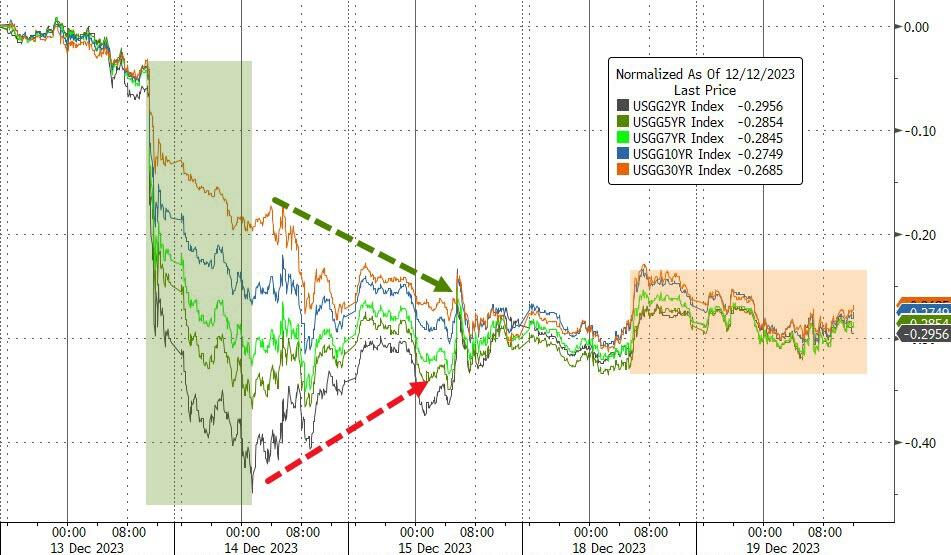
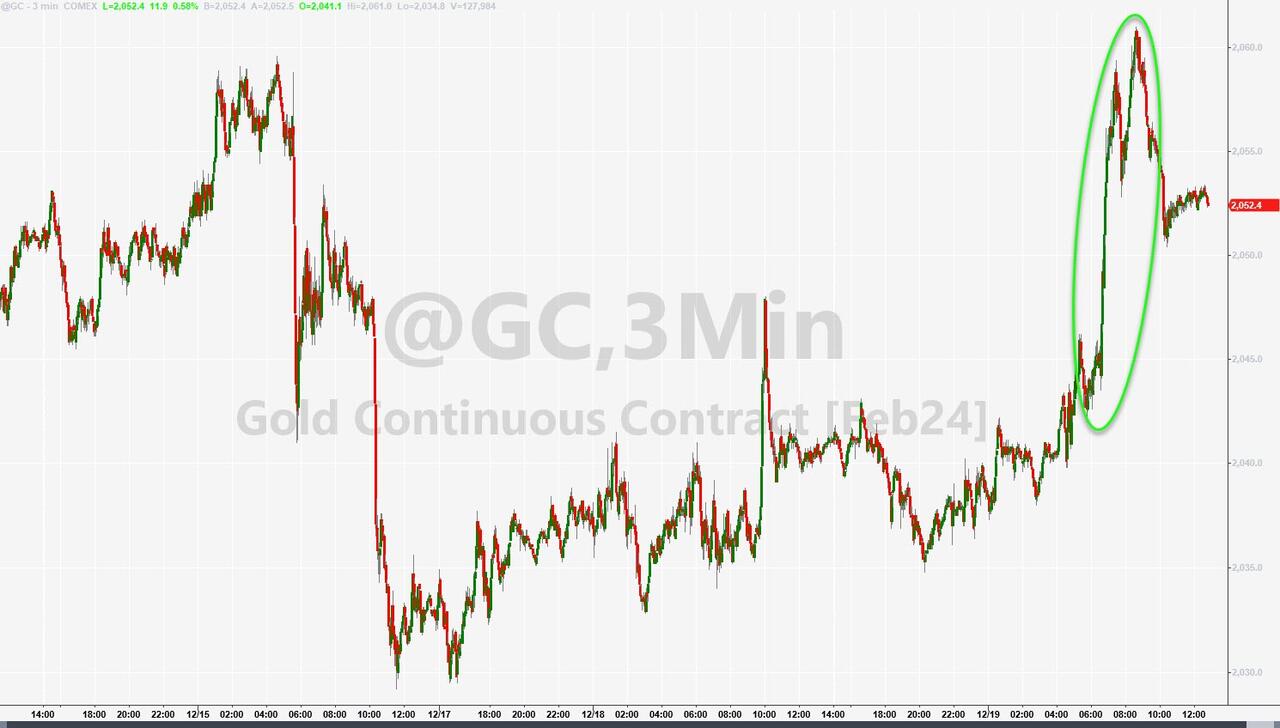
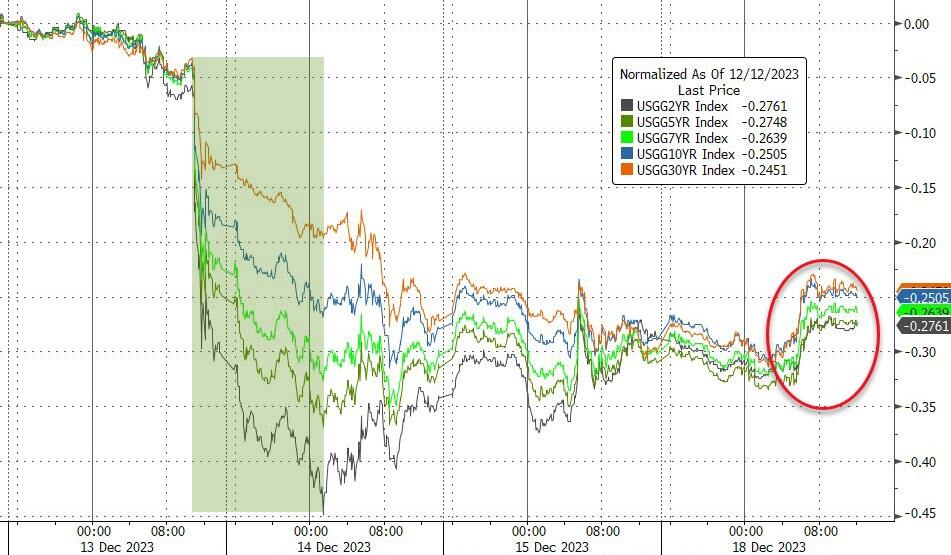
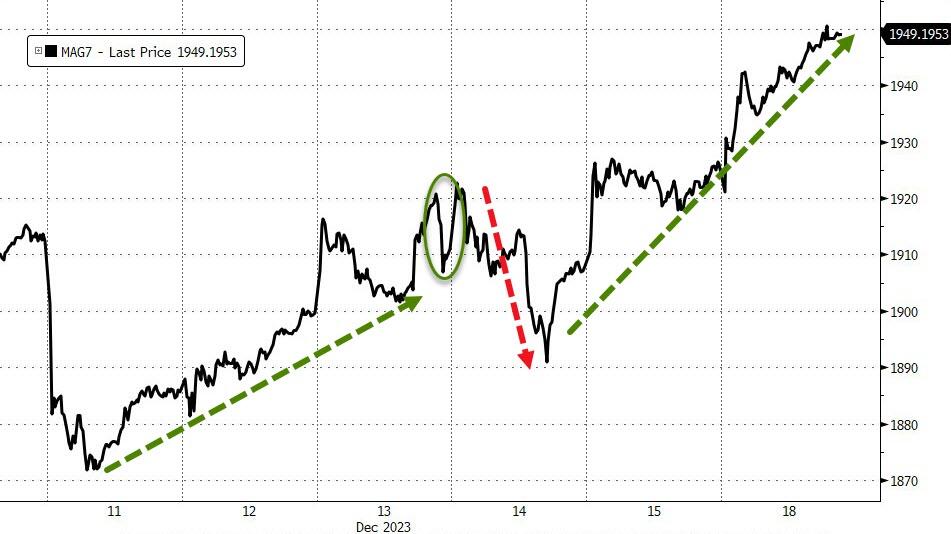
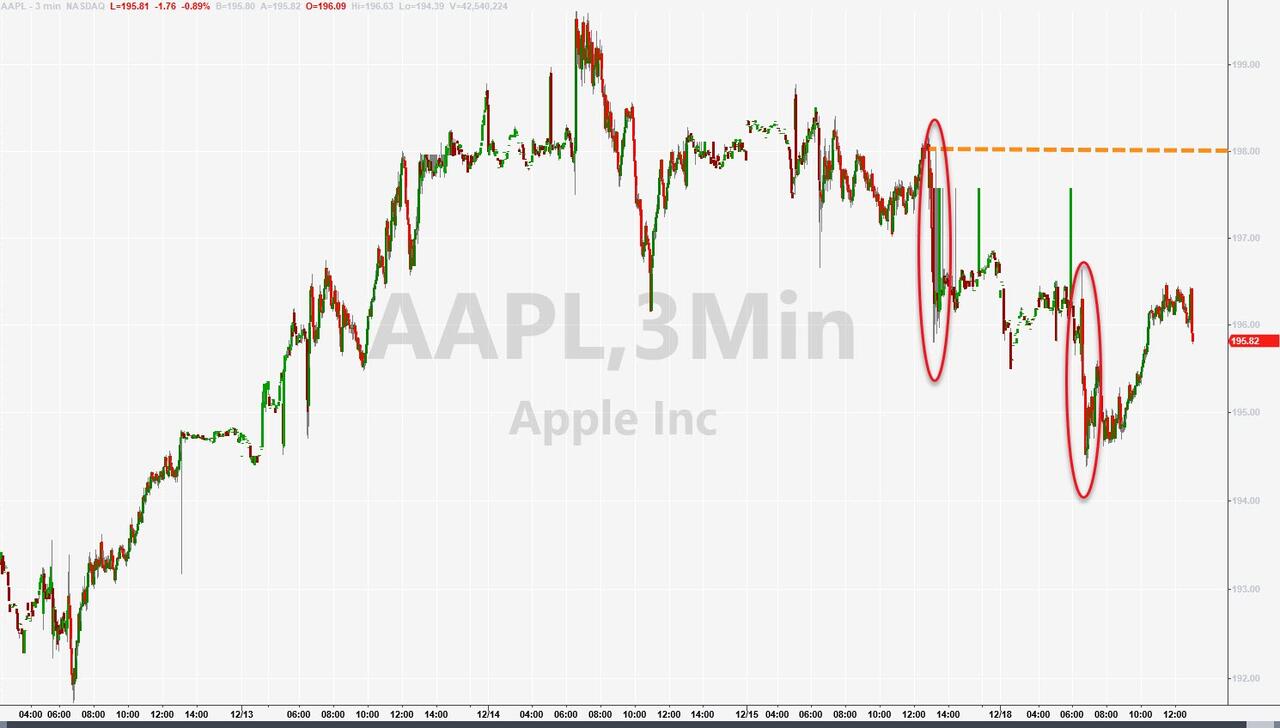
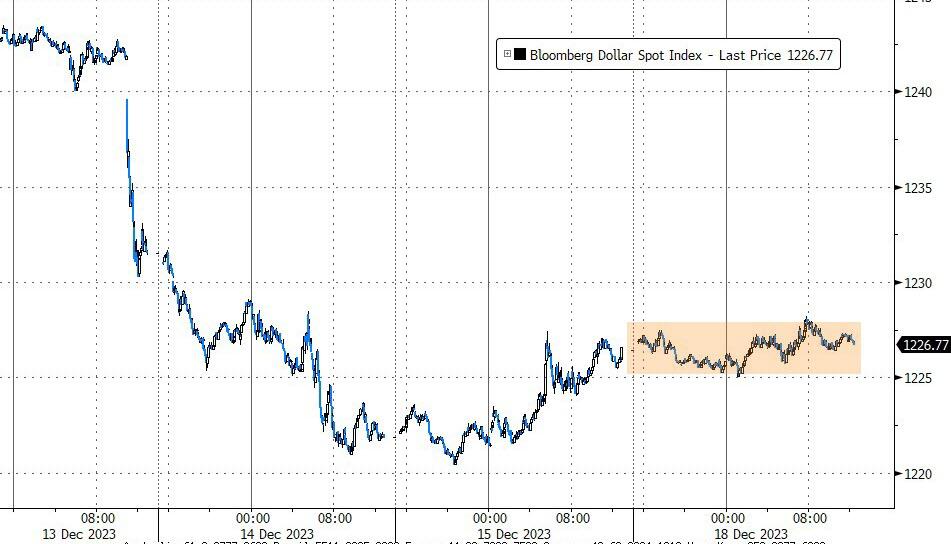
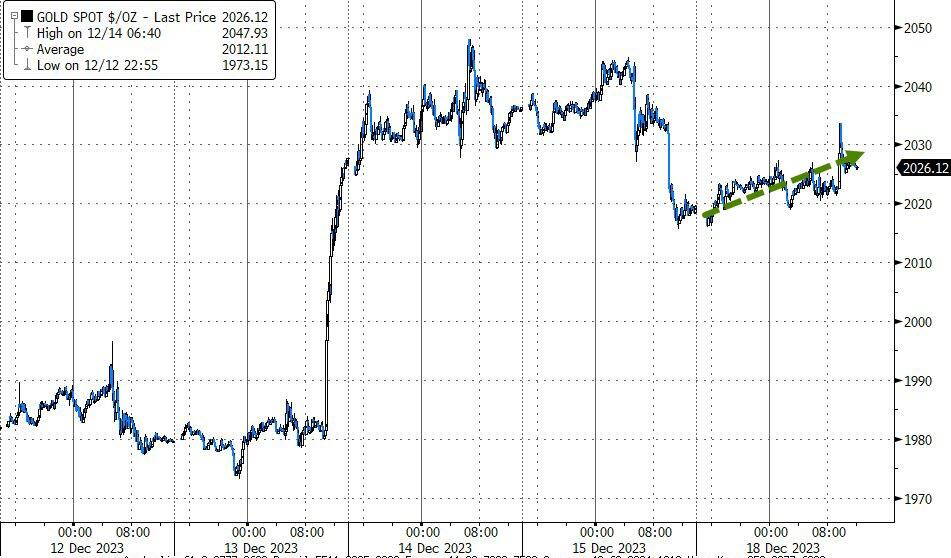
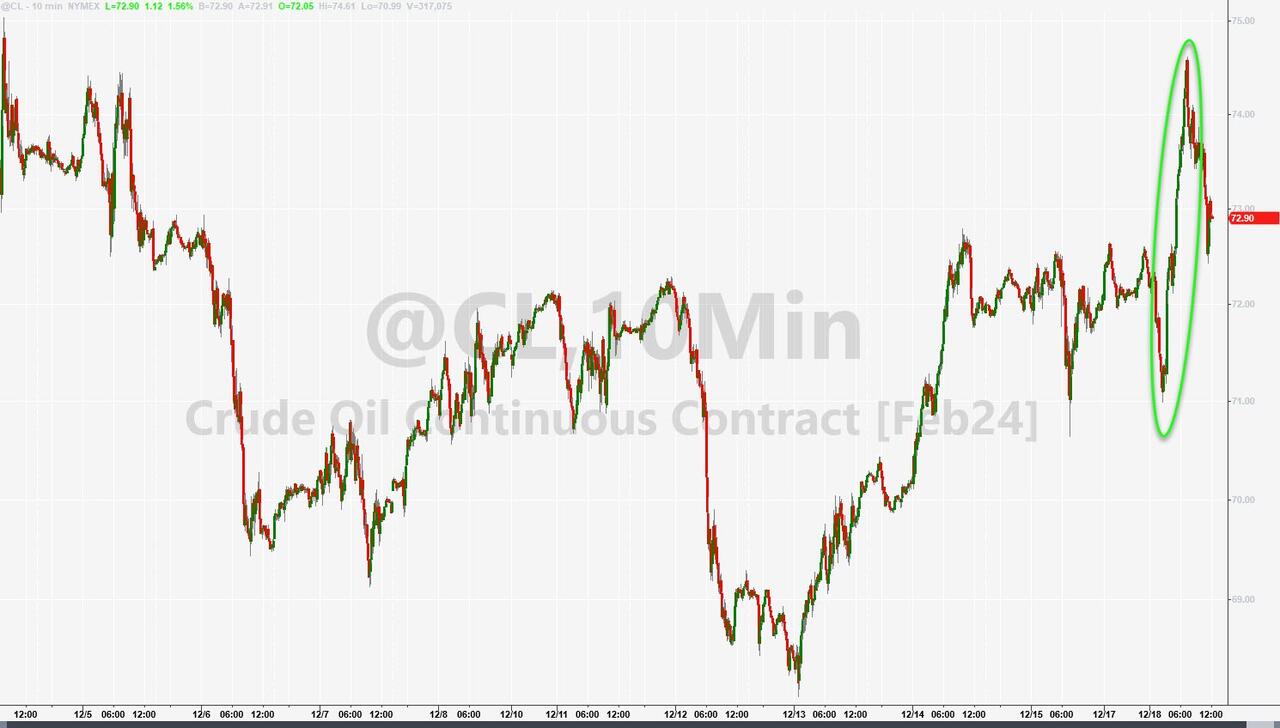
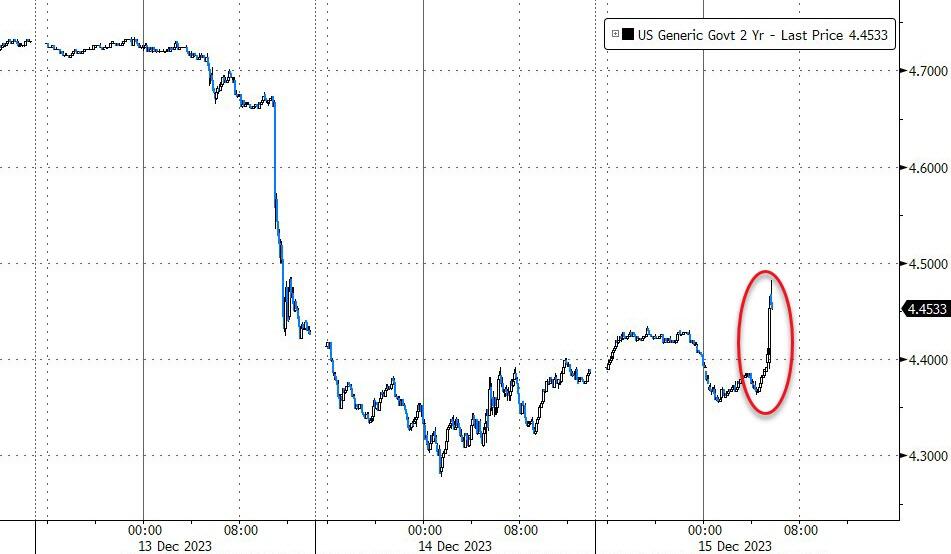
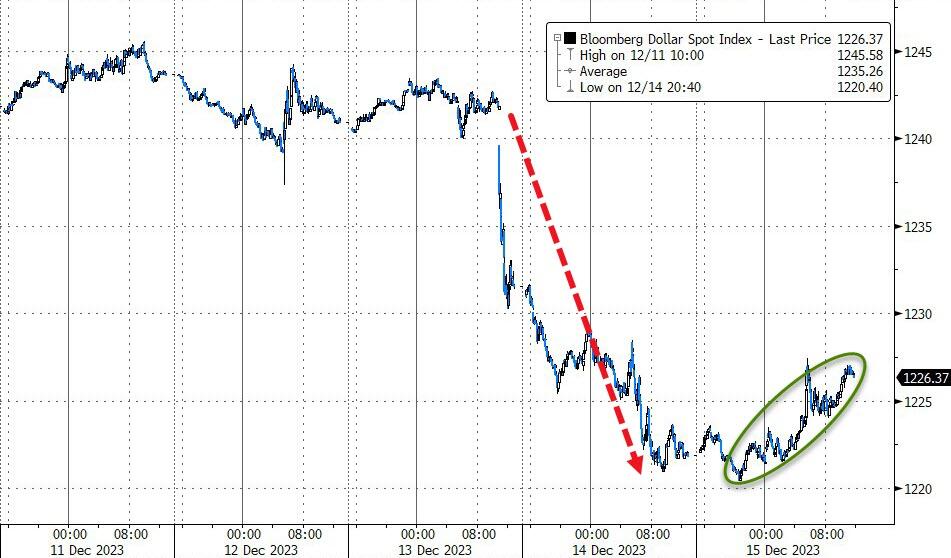
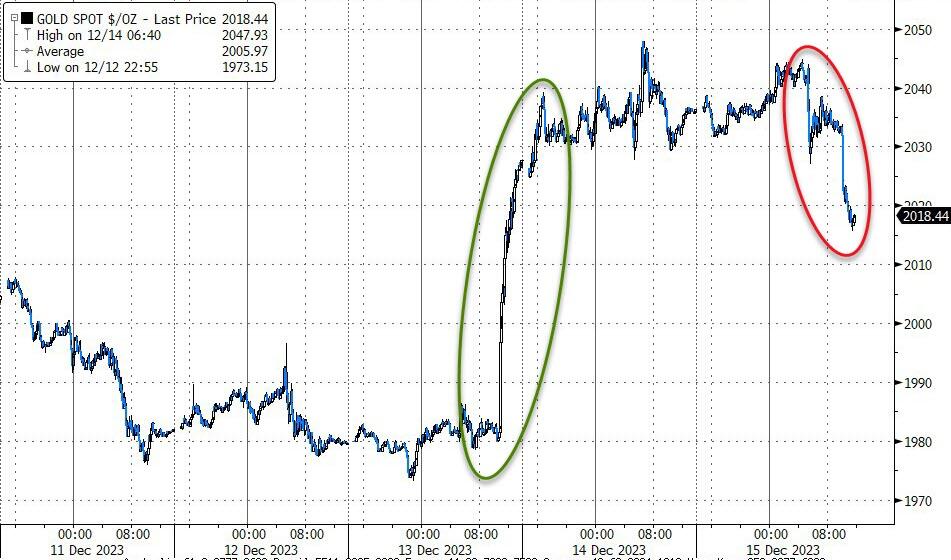
The MAG7 stocks had a mixed day but managed to end in the green. Bond yields edged up but did not spoil the party for stocks. The dollar slipped, giving gold a chance to shine again, while oil had a wild ride but finished slightly down.
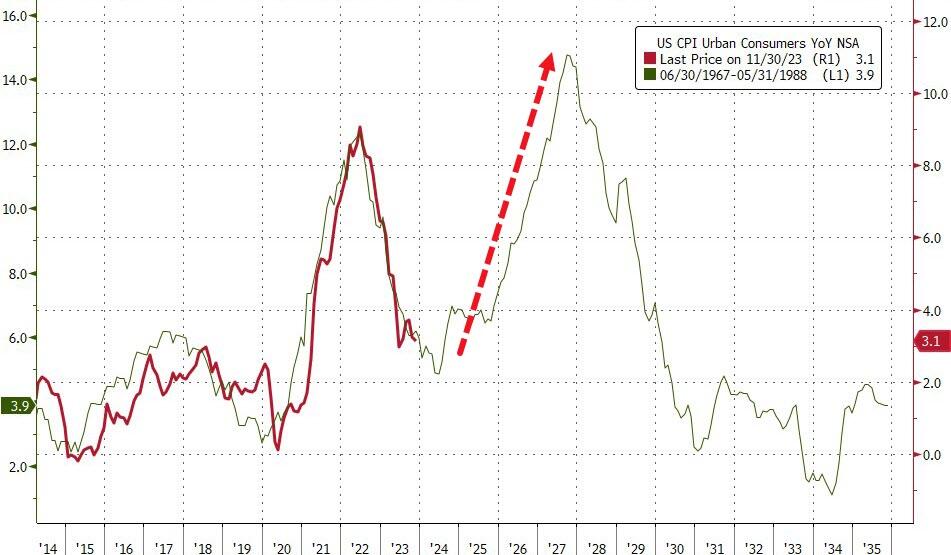
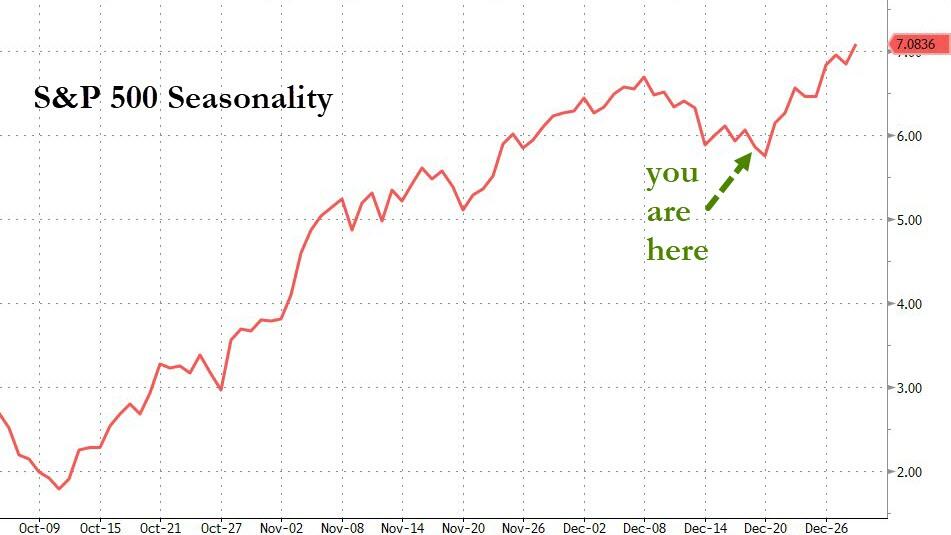
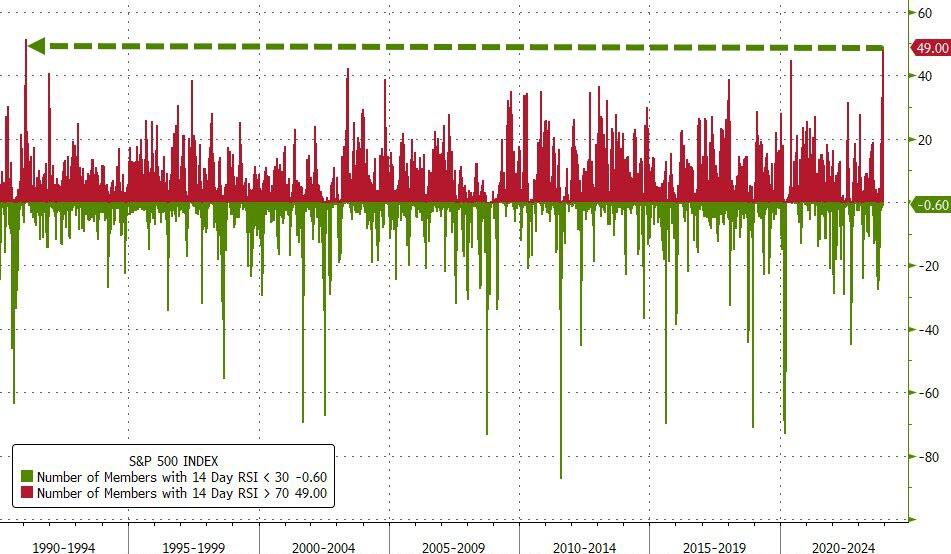
I have repeatedly warned that inflation is not dead and will come back to haunt us. The markets and the Fed don’t agree and think that history, as shown in this chart, won’t repeat itself.
Are they right?
Read More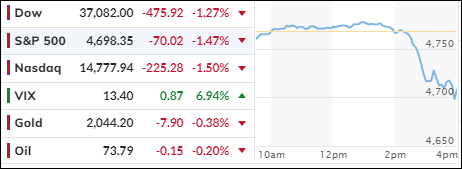
