
- Moving the markets
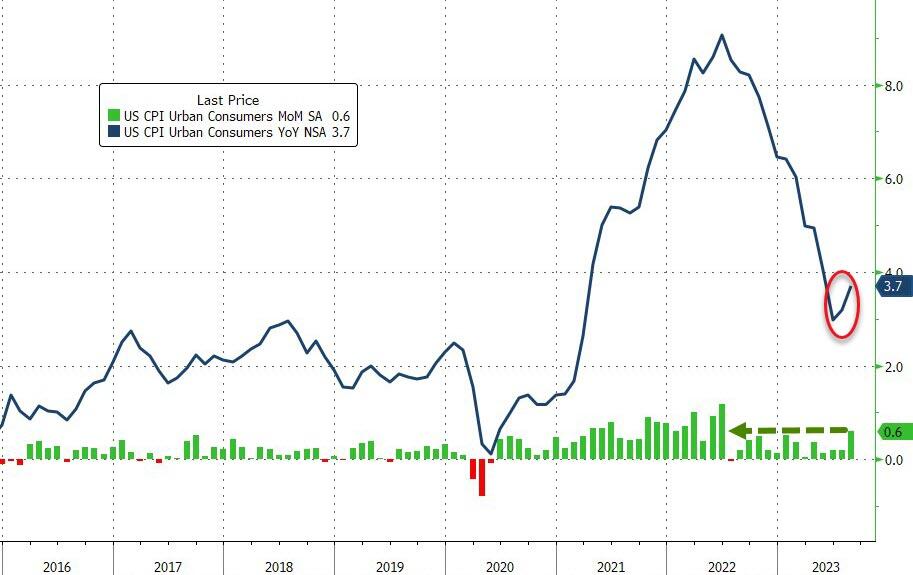
The markets were like a yo-yo today, as traders freaked out over the latest inflation report. The CPI, or consumer price index, showed that prices of stuff we buy went up more than expected in August.
The core CPI, which excludes food and energy (because who needs those, right?), also went up more than expected. The Fed, which is supposed to keep inflation under control, may or may not raise interest rates or stop buying bonds. Nobody knows for sure, and that’s why the markets are so jittery.
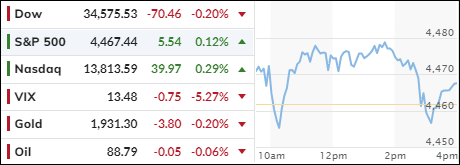
The Dow dropped a bit, while the Nasdaq and the S&P barely stayed in the green. Our Domestic TTI, or Trend Tracking Index (section 3), went below +1% and is almost ready to tell us to change our market strategy. But not yet, we still need more evidence from the market.
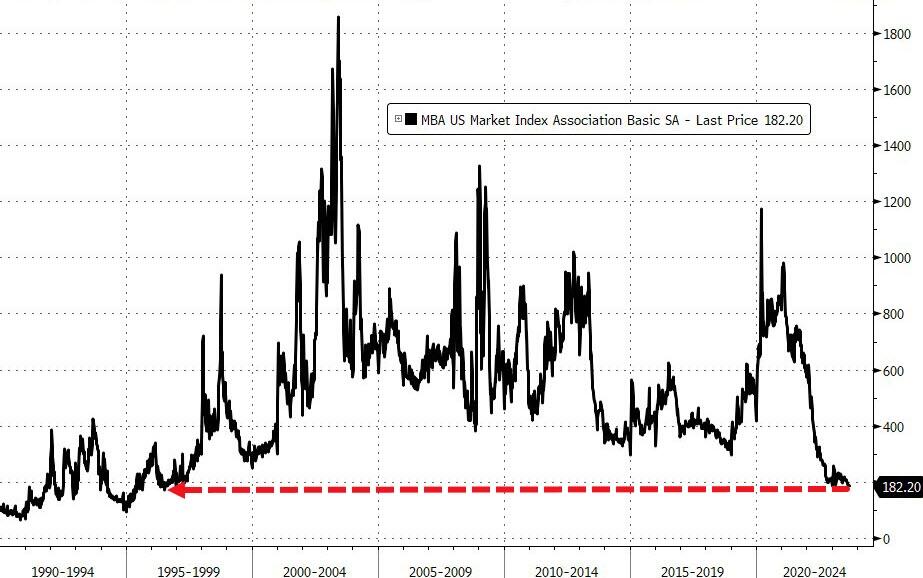
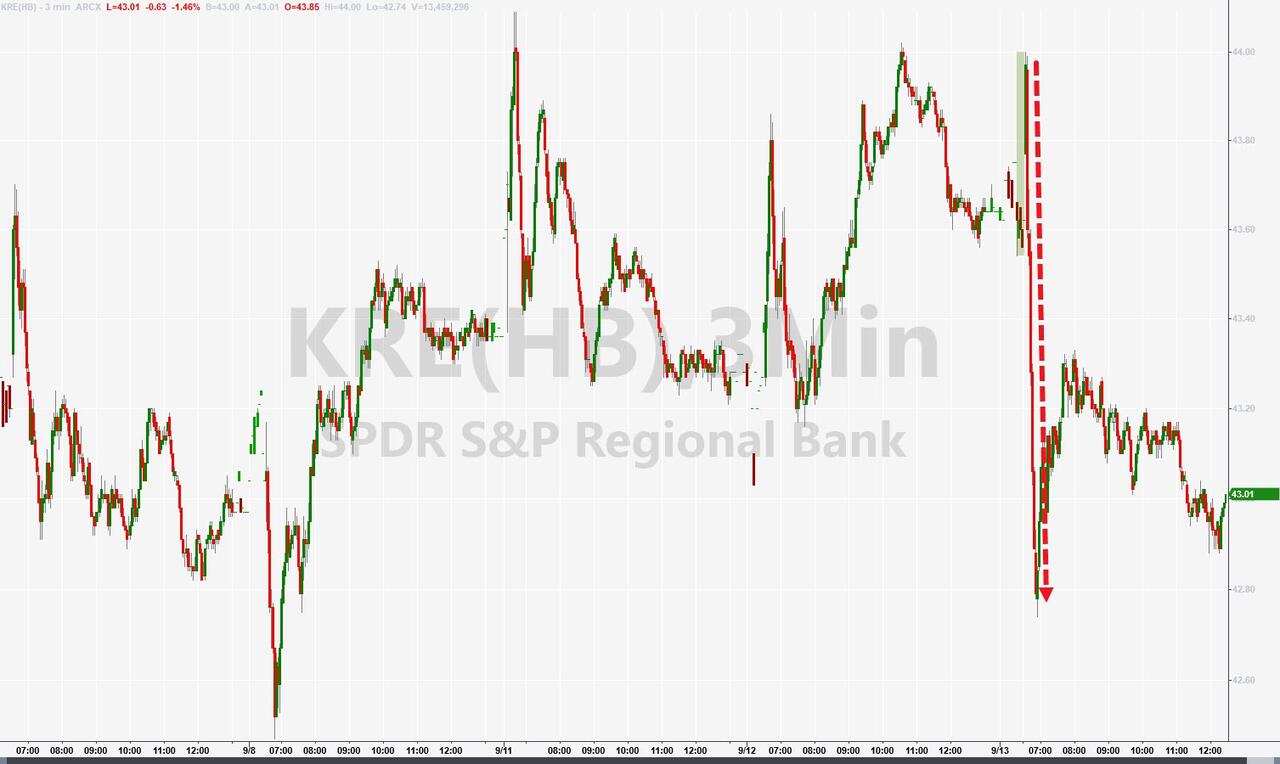
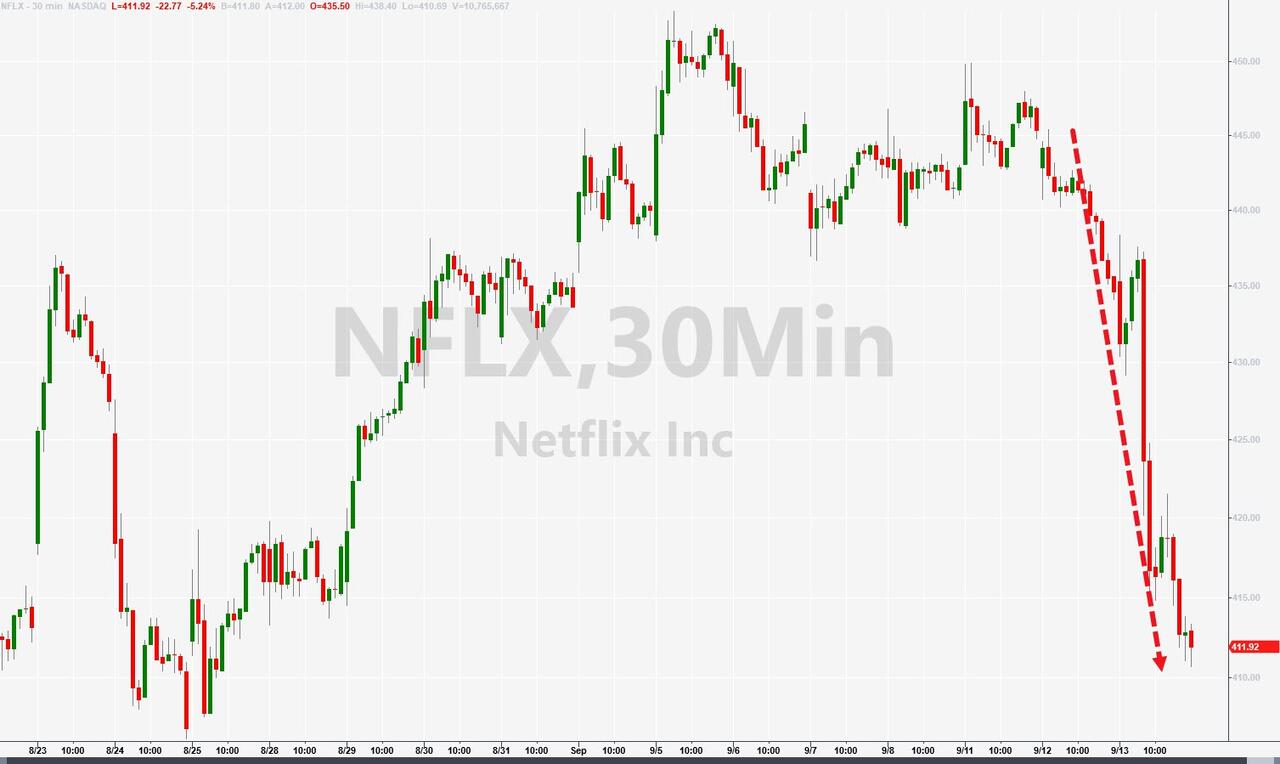
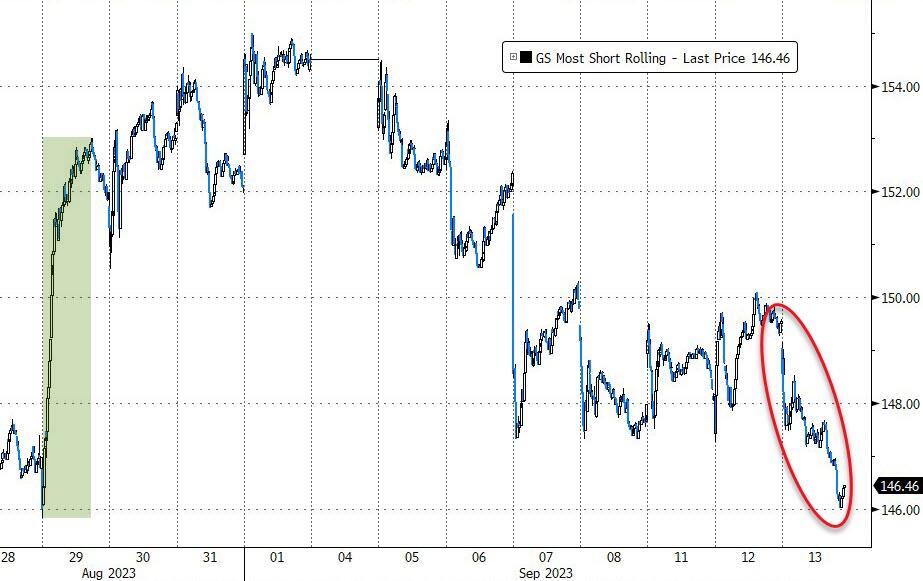
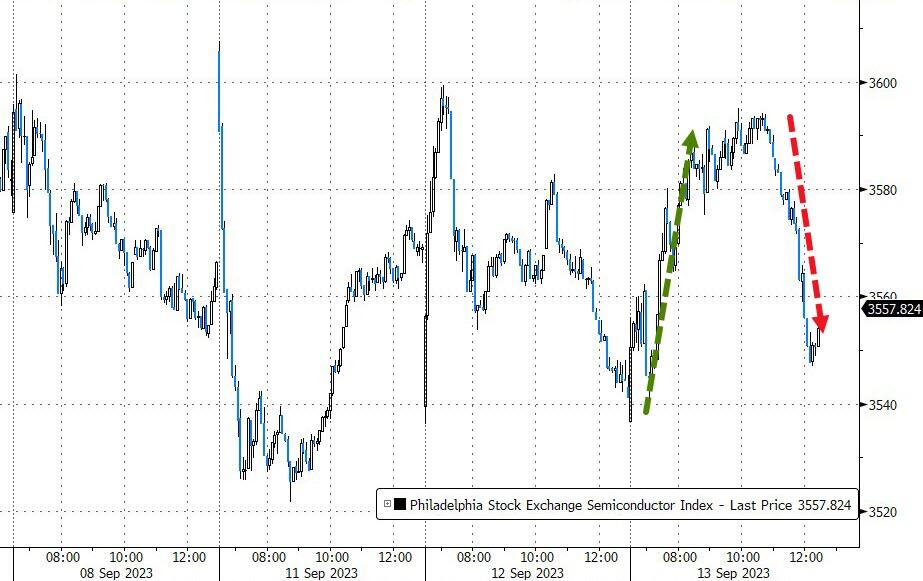
In other news, US mortgage applications hit rock bottom, the lowest since 1996. That’s bad news for the housing market and anyone who wants to buy or sell a home. The banking sector (KRE) had a wild ride, Netflix got slammed, and the most shorted stocks erased all of their “gains” from the August big squeeze. Semiconductors also had a rough day, as uncertainty ruled the market.
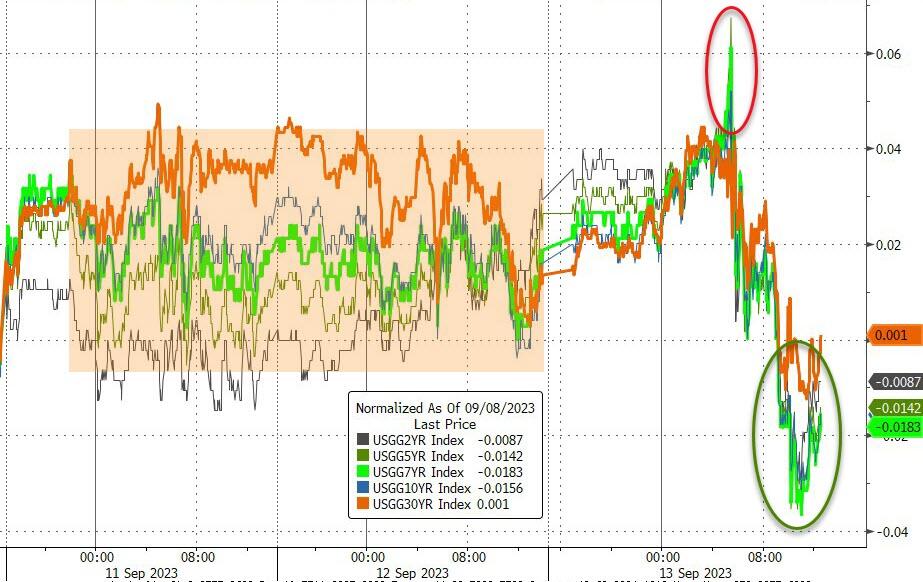
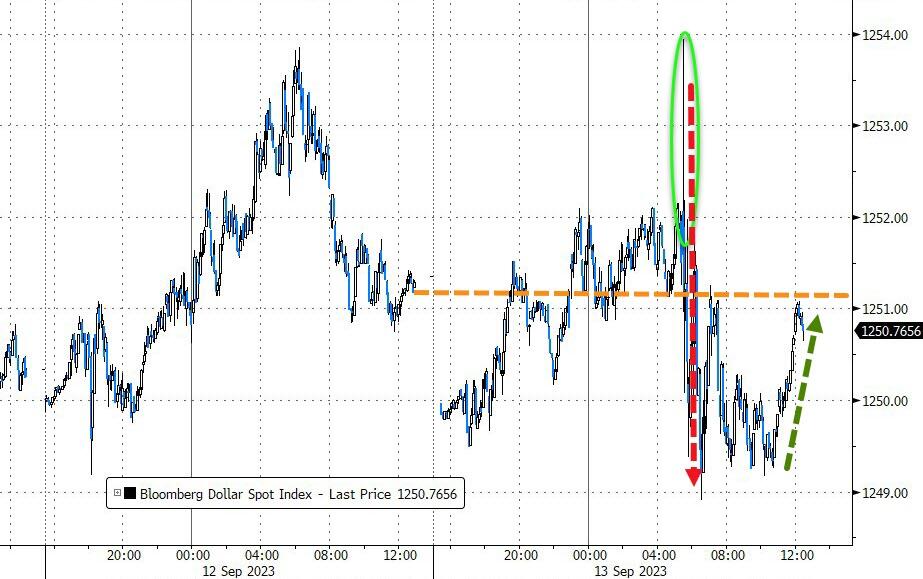
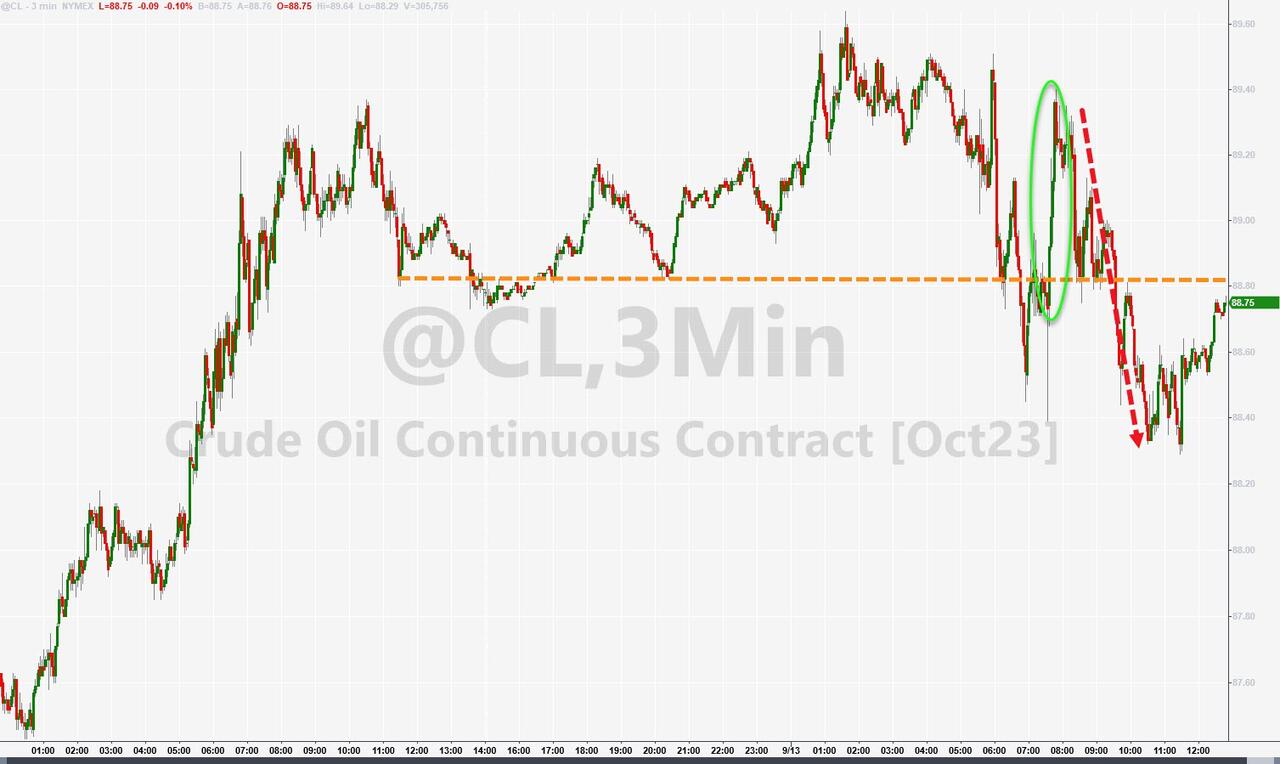
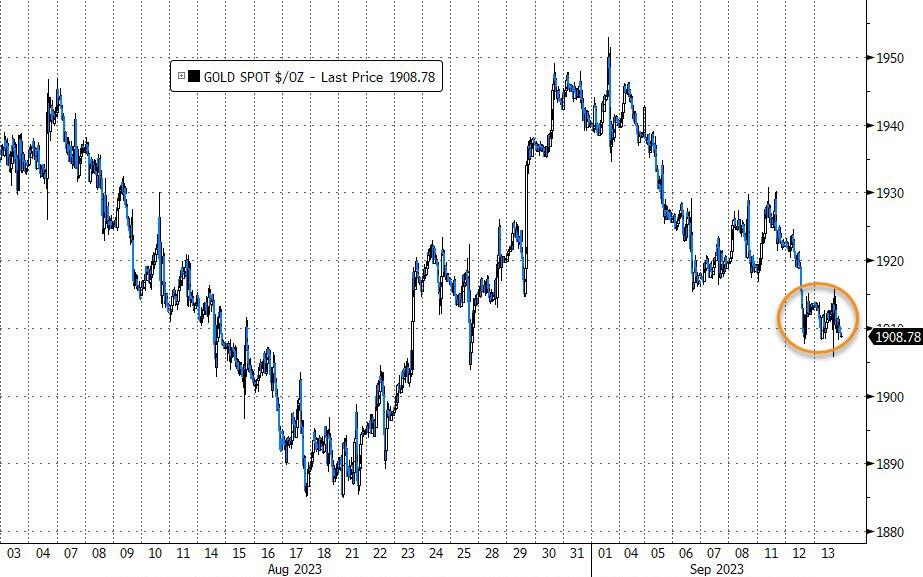
Bond yields fell, the dollar stayed flat, crude oil did nothing, and gold drifted along. What a boring day for commodities!
Will tomorrow’s PPI release, or producer price index, make things clearer or messier? The PPI measures the changes in the prices of stuff that producers sell.
A high PPI means that producers are passing on their higher costs to consumers, which could lead to more inflation. A low PPI means that producers are absorbing their higher costs or cutting their prices, which could lead to less inflation.
Stay tuned for tomorrow’s episode of “As the Market Turns”!
2. “Buy” Cycle Suggestions
The current Buy cycle began on 12/1/2022, and I gave you some ETF tips based on my StatSheet back then. But if you joined me later, you might want to check out the latest StatSheet, which I update and post every Thursday at 6:30 pm PST.
You should also think about how much risk you can handle when picking your ETFs. If you are more cautious, you might want to go for the ones in the middle of the M-Index rankings. And if you don’t want to go all in, you can start with a 33% exposure and see how it goes.
We are in a crazy time, with the economy going downhill and some earnings taking a hit. That will eventually drag down stock prices too. So, in my advisor’s practice, we are looking for some value, growth and dividend ETFs that can weather the storm. And of course, gold is always a good friend.
Whatever you invest in, don’t forget to use a trailing sell stop of 8-12% to protect yourself from big losses.
3. Trend Tracking Indexes (TTIs)
The markets experienced a lot of volatility today, as investors were unsure about the impact of the CPI reading on the Fed’s monetary policy. The CPI, or consumer price index, measures the changes in the prices of goods and services that consumers buy.
Our Domestic TTI crossed the +1% mark to the downside and is close to signaling a major shift in the market direction. The TTI is a tool that we use to track the long-term trends of the market and determine when to buy or sell. A positive TTI means that the market is in an uptrend, while a negative TTI means that the market is in a downtrend.
However, we are not ready to change our position yet, as we need more confirmation from the market.
This is how we closed 09/13/2023:
Domestic TTI: +0.93% above its M/A (prior close +1.33%)—Buy signal effective 12/1/2022.
International TTI: +3.40% above its M/A (prior close +3.50%)—Buy signal effective 12/1/2022.
All linked charts above are courtesy of Bloomberg via ZeroHedge.
Contact Ulli