
ETF Tracker StatSheet
You can view the latest version here.
TECH WRECK: MARKET PLUNGES AS INFLATION FEARS LOOM
- Moving the markets
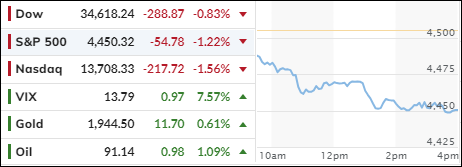
The market had a bad case of the Fridays, as tech stocks led the way down and erased most of the gains from earlier this week. Auto stocks were the exception, as Ford, GM and Stellantis managed to rev up despite a massive strike by the UAW that shut down half of US auto production.
The market was also hopeful about the end of the tech IPO drought, as ARM Holdings made a strong debut and traded 6% higher. But that optimism faded as investors looked at the latest economic data. The data was a mixed bag, to say the least.
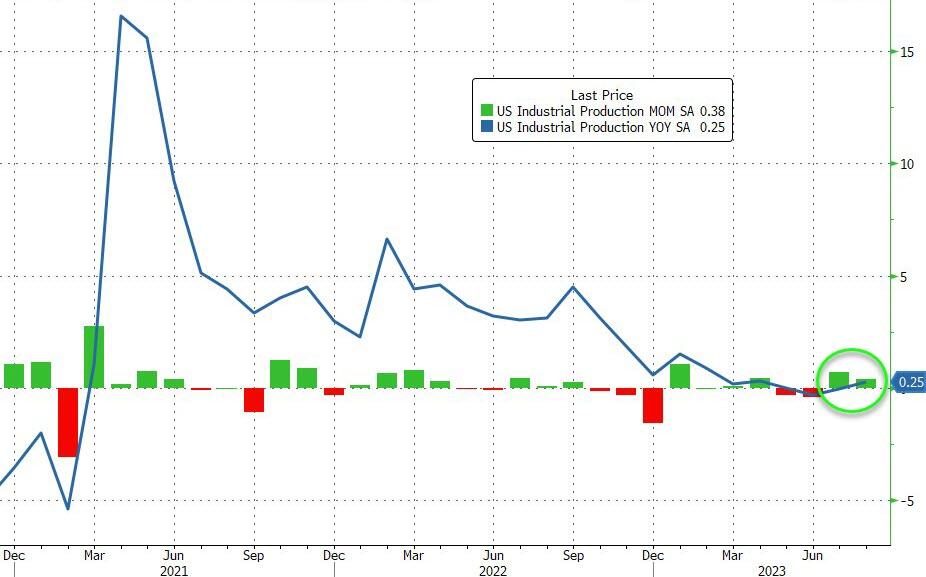
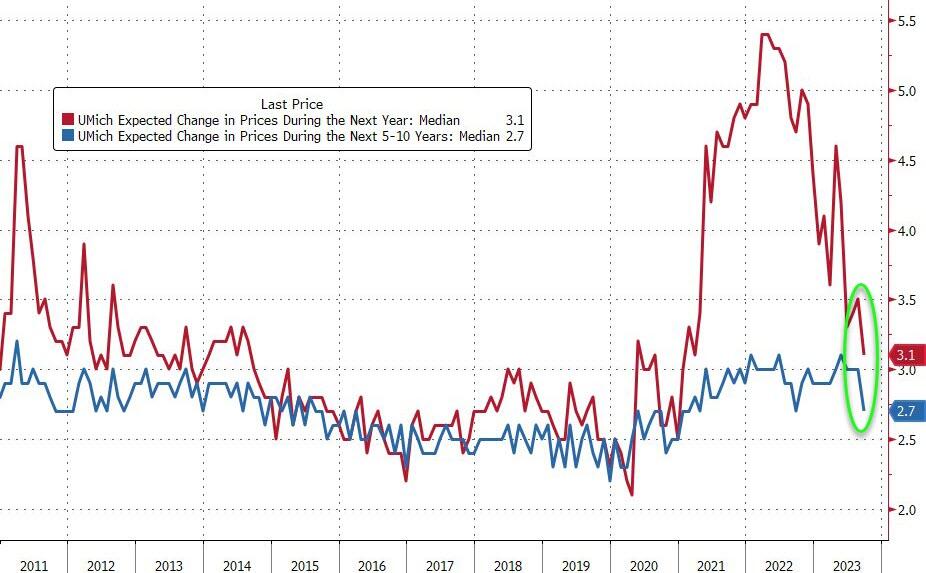
On one hand, industrial production rose more than expected in August, showing some resilience in the manufacturing sector. On the other hand, inflation expectations dropped sharply in September, according to the UMich survey. That’s either good news or bad news, depending on how you look at it.
The market is now waiting for the Fed’s decision next week, hoping that they won’t raise rates again or taper their bond buying program. The Fed has been saying that inflation is transitory, but the data seems to suggest otherwise.
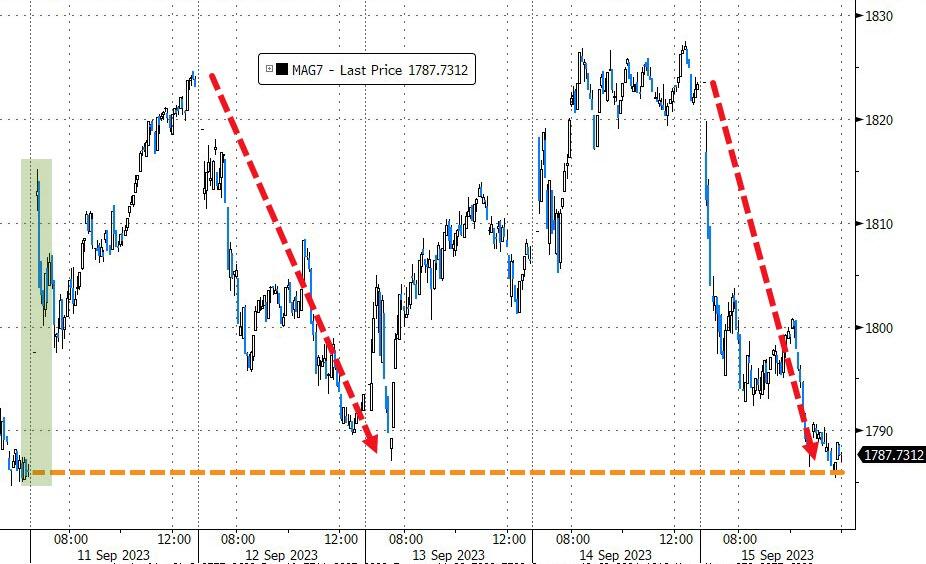
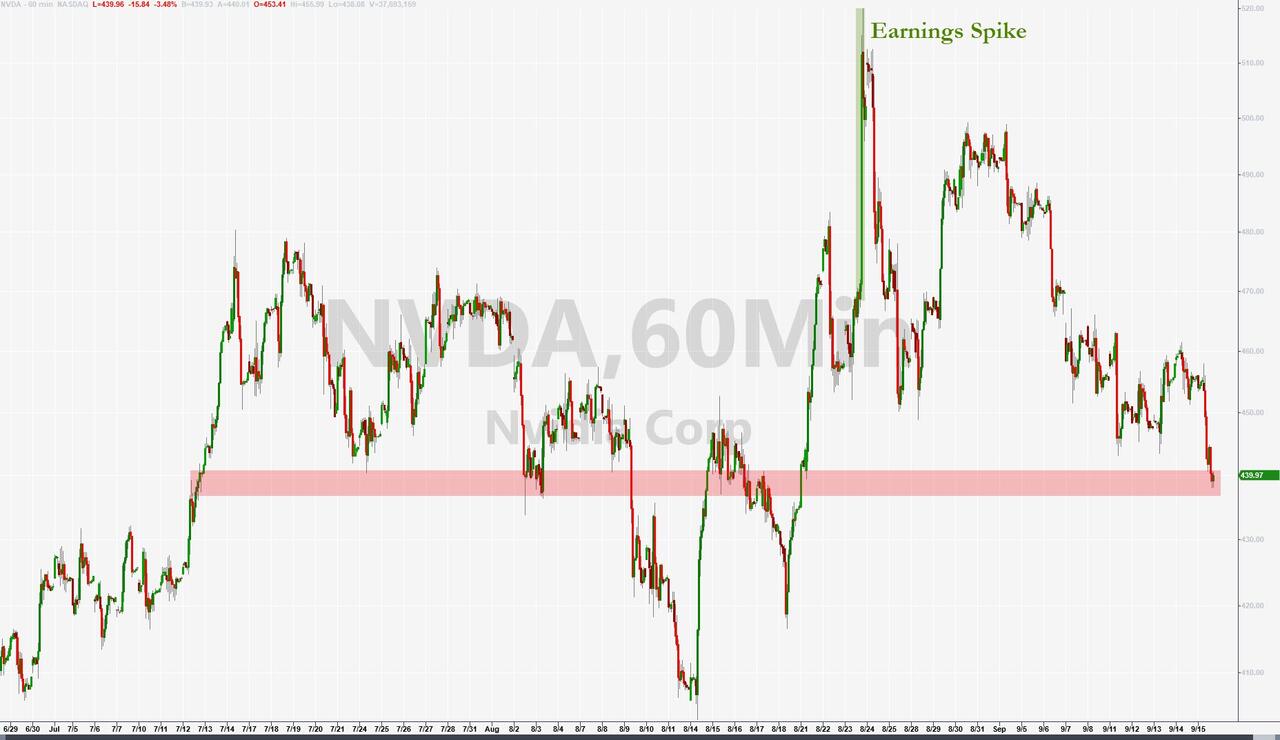
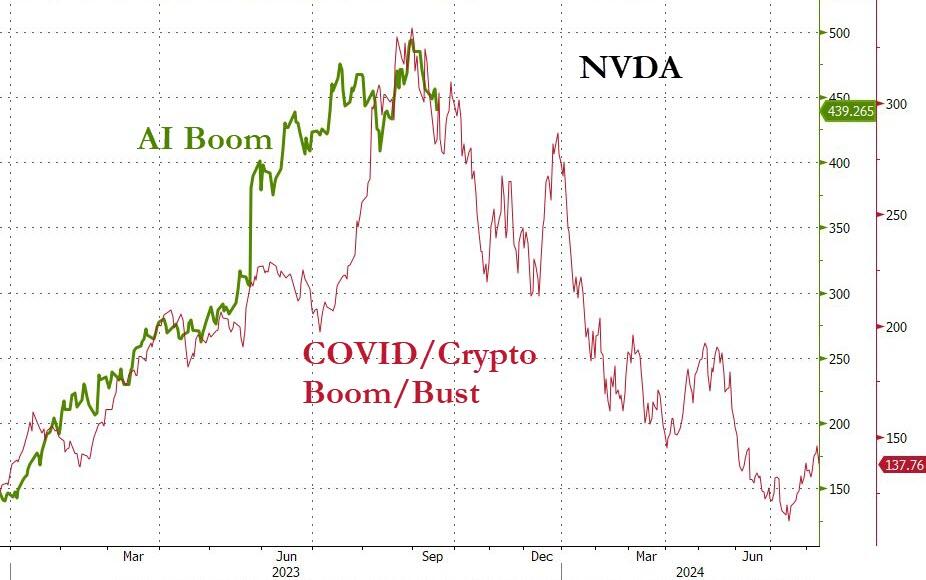
The tech sector was especially hit hard, as the ‘Magnificent 7’ (AAPL, AMZN, FB, GOOG, MSFT, NFLX and NVDA) lost their magic and gave up all their weekly gains. NFLX was the worst performer, dropping like a bad movie. NVDA also suffered, falling 13% from its record high after earnings.
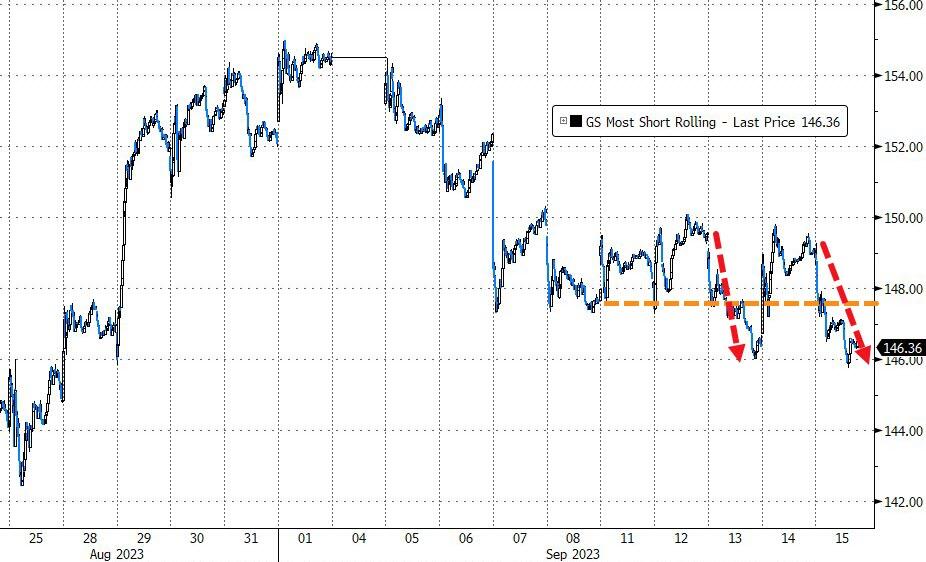
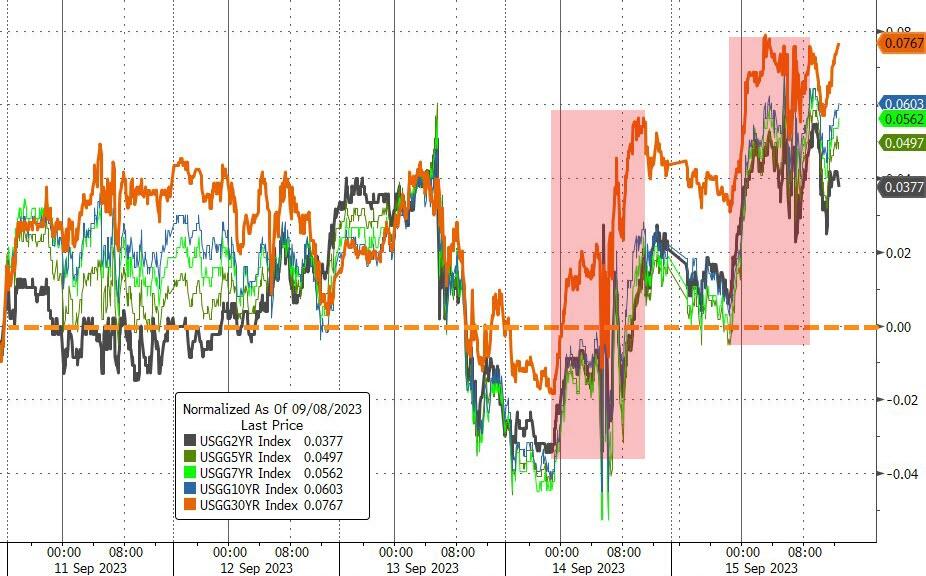
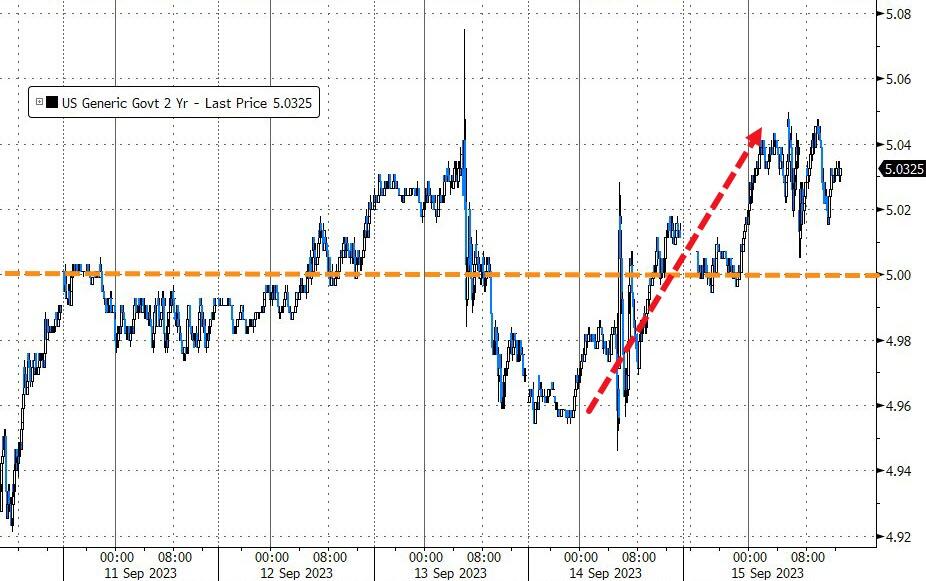
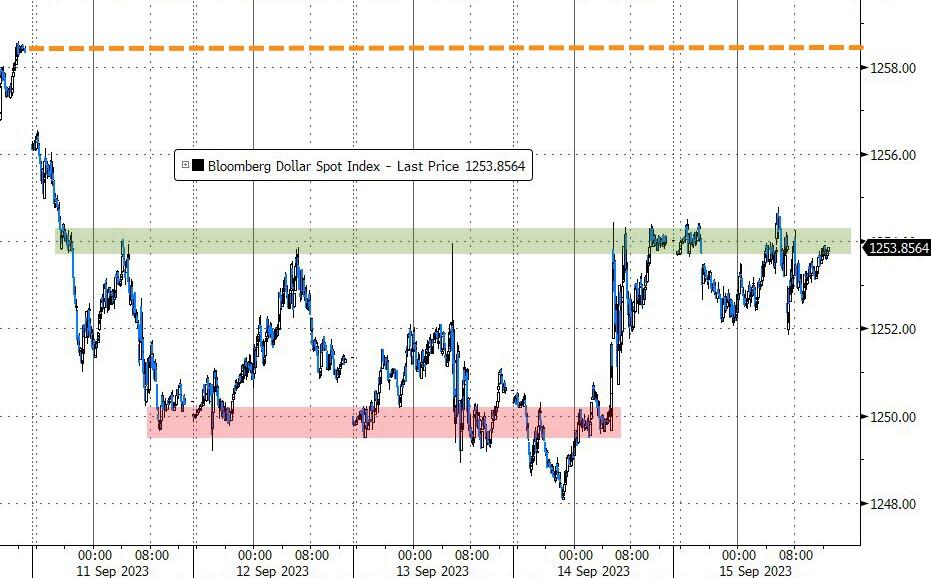
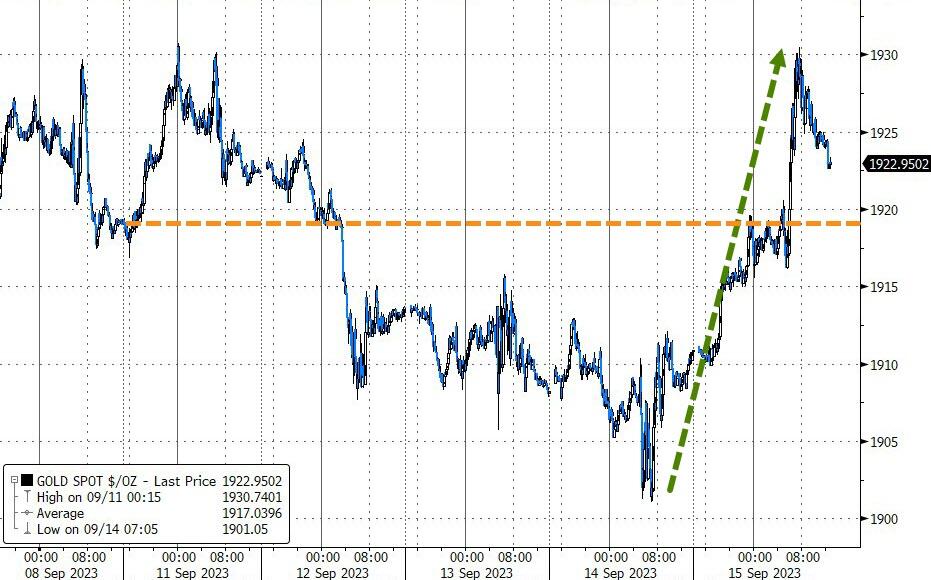
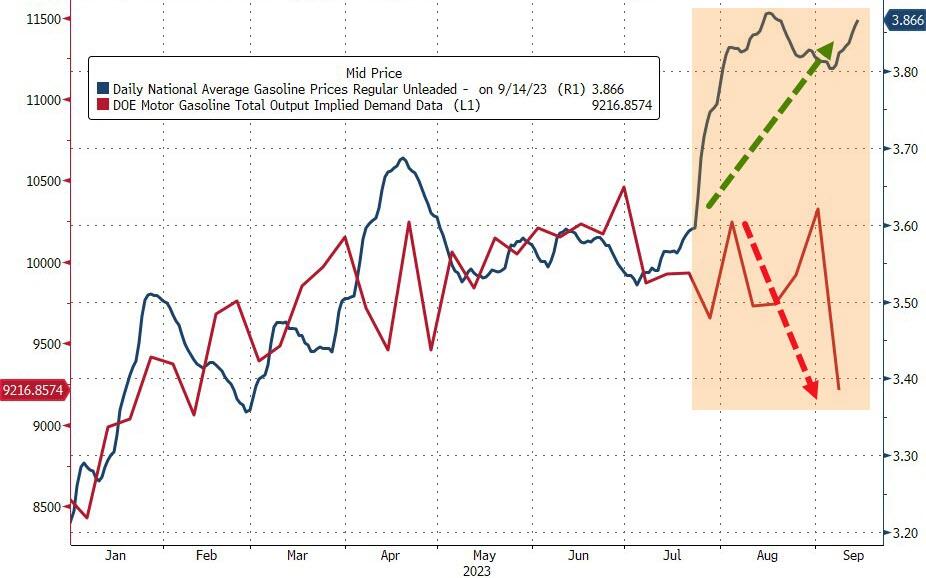
The most shorted stocks also continued their downward trend, falling for the second week in a row. Bond yields rose slightly, with the 2-year breaking above 5%. The dollar weakened, while gold and oil prices rose with the latter reaching $91. Gas prices are also soaring, which might hurt consumer spending.
With all this uncertainty, some analysts are comparing the current situation to the AI/Covid/Crypto Boom/Bust.
Will history repeat itself? Or will the market find a way to bounce back? That’s the million-dollar question.
2. “Buy” Cycle Suggestions
The current Buy cycle began on 12/1/2022, and I gave you some ETF tips based on my StatSheet back then. But if you joined me later, you might want to check out the latest StatSheet, which I update and post every Thursday at 6:30 pm PST.
You should also think about how much risk you can handle when picking your ETFs. If you are more cautious, you might want to go for the ones in the middle of the M-Index rankings. And if you don’t want to go all in, you can start with a 33% exposure and see how it goes.
We are in a crazy time, with the economy going downhill and some earnings taking a hit. That will eventually drag down stock prices too. So, in my advisor’s practice, we are looking for some value, growth and dividend ETFs that can weather the storm. And of course, gold is always a good friend.
Whatever you invest in, don’t forget to use a trailing sell stop of 8-12% to protect yourself from big losses.
3. Trend Tracking Indexes (TTIs)
The market rally that happened yesterday was almost reversed today, as investors were not convinced by the economic indicators that came out.
Our Trend Tracking Indexes (TTIs) also declined, with the domestic one getting close to the +1% mark again. This means that we are still in a bullish zone, but not by much.
This is how we closed 09/15/2023:
Domestic TTI: +1.10% above its M/A (prior close +2.11%)—Buy signal effective 12/1/2022.
International TTI: +3.91% above its M/A (prior close +4.49%)—Buy signal effective 12/1/2022.
All linked charts above are courtesy of Bloomberg via ZeroHedge.
———————————————————-
WOULD YOU LIKE TO HAVE YOUR INVESTMENTS PROFESSIONALLY MANAGED?
Do you have the time to follow our investment plans yourself? If you are a busy professional who would like to have his portfolio managed using our methodology, please contact me directly to get more details.
Contact Ulli