Do you want to know which ETFs are hot and which ones are not? Then you need my High-Volume ETF Cutline report. It tells you how close or far each of the 311 ETFs I follow is from its long-term trend line (39-week SMA). These are the ETFs that trade more than $5 million a day, so they are not some obscure funds that nobody cares about.
The report is split into two parts: The winners that are above their trend line (%M/A), and the losers that are below it. The yellow line is the line of shame that separates them. You can see how many ETFs are in each group and how they have changed since the last report (267 vs. 268 current).
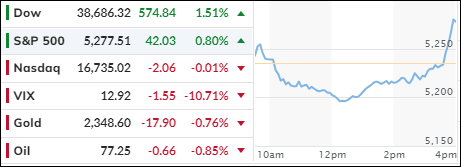
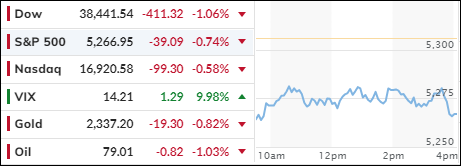
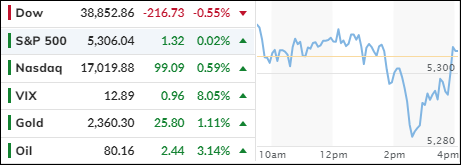
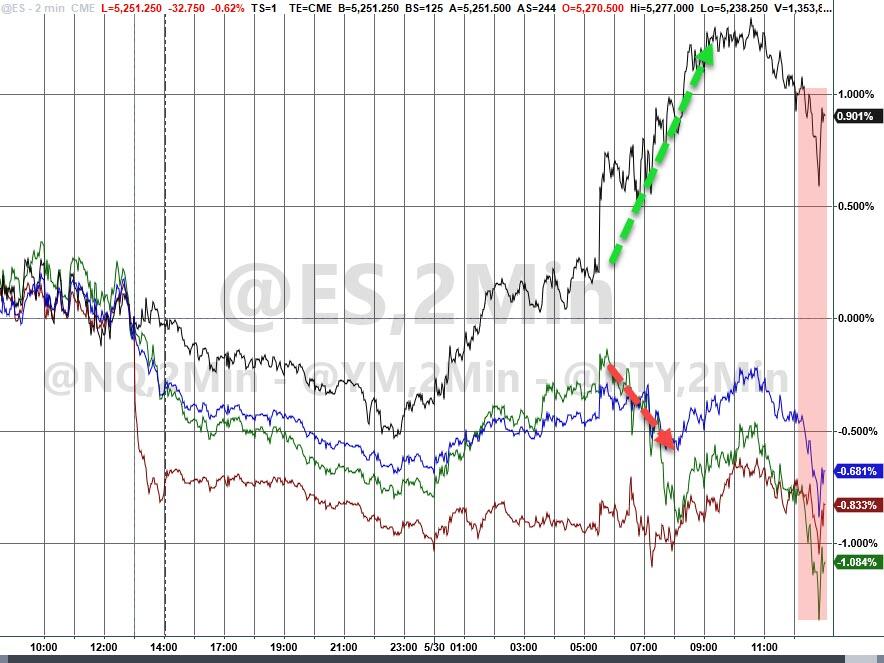
The major indexes started the last day of May in mixed mode, with the Dow being little changed, while the S&P 500 and Nasdaq meandered below their respective unchanged lines.
However, an afternoon melt-up pulled the Dow and S&P out of their doldrums with both indexes closing solidly in the green, while the Nasdaq ended about unchanged.
The Fed’s preferred inflation gauge, the PCE, increased 0.2% in April, which was in line with expectations. The Core PCE rose 2.8% on an annual basis, a tad above the forecast of 2.7%.
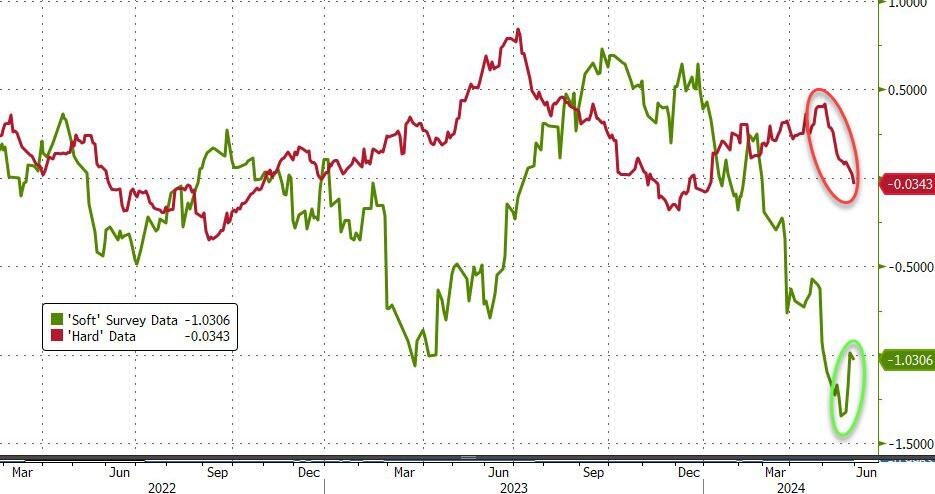
On the economic side, consumer spending grew only 0.2% in April, less than hoped for. But when adjusted for inflation spending declined 0.1% from the prior month, confirming that the consumer is not in good shape.
Still, traders were somewhat relieved that these numbers did not turn out to be worse, with hope abounding that slowing spending could lead to lower inflation numbers.
That shows the lack of understanding that the real threat of higher inflation still lies ahead of us and is caused by ever-growing debt and deficits, as there seems to be no end to unrelenting government spending. Have you heard anyone talk about balancing the budget lately?
Be that as it may, this month turned out to be positive for equities, with the S&P 500 being up some 4.8%, after having lost 4% the prior month.
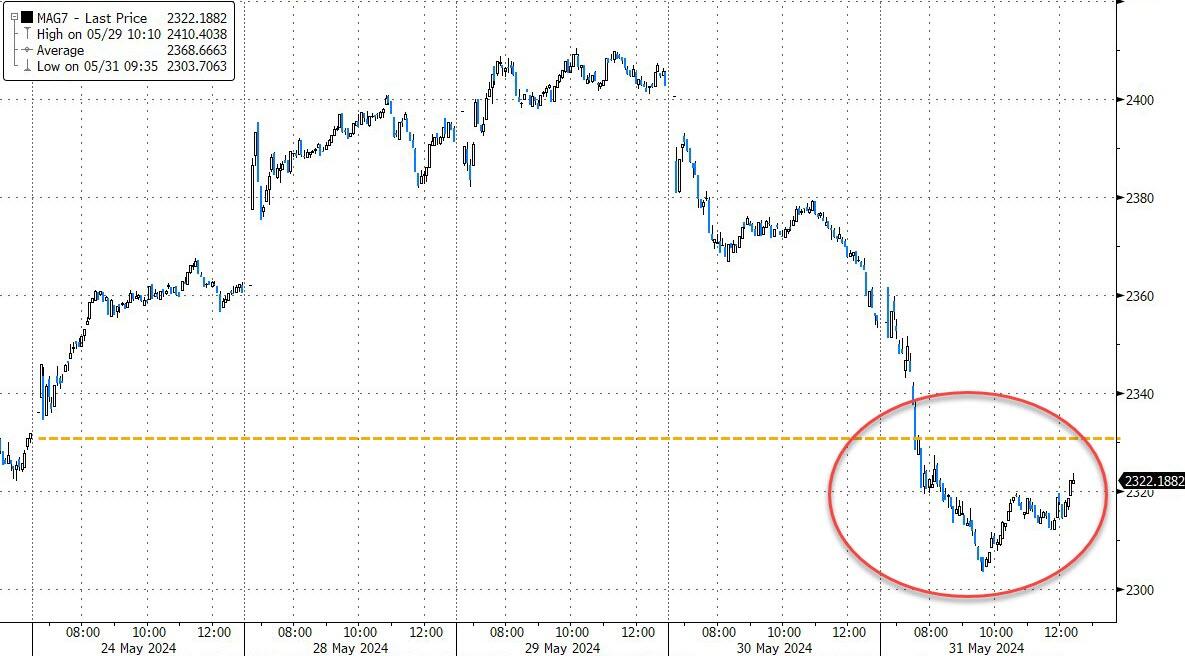
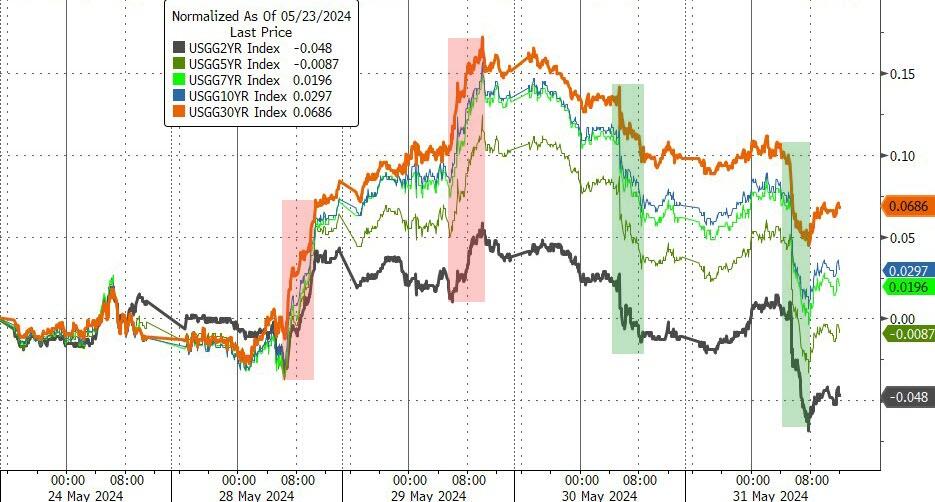
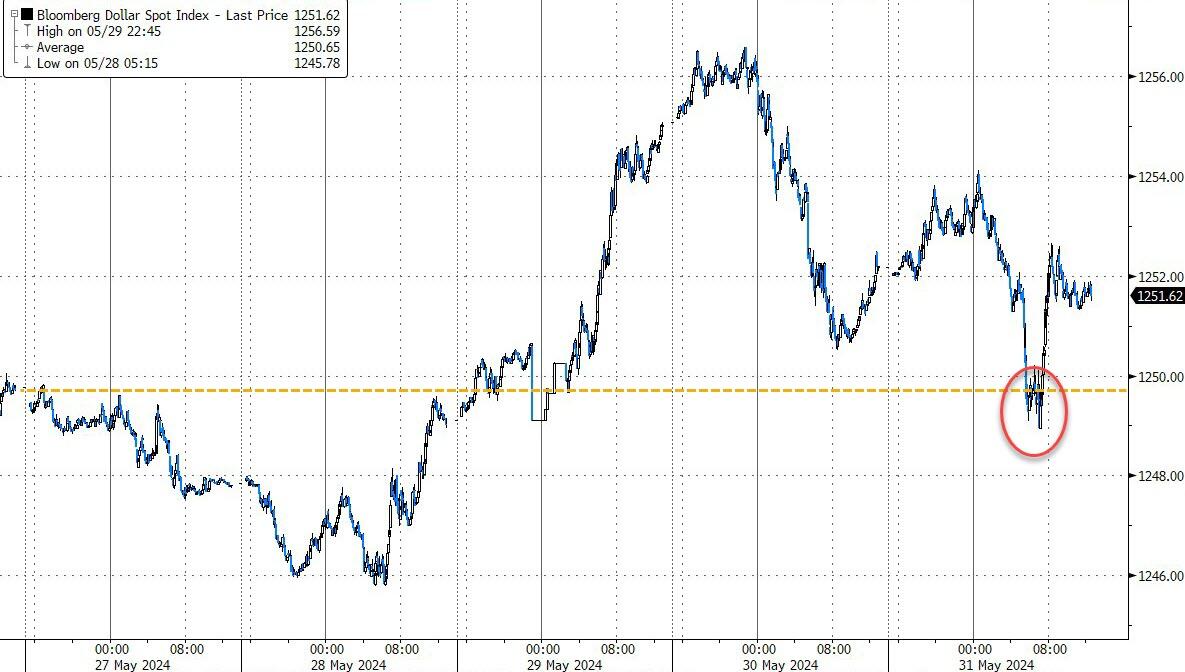
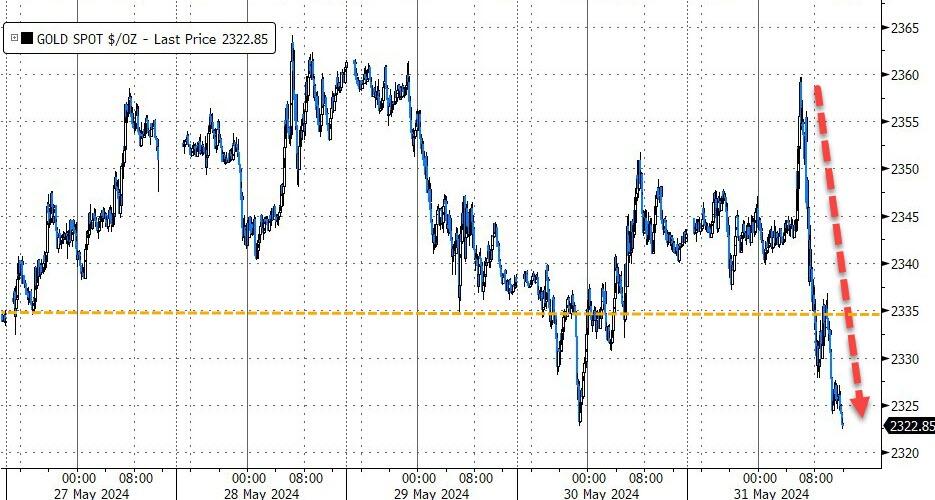
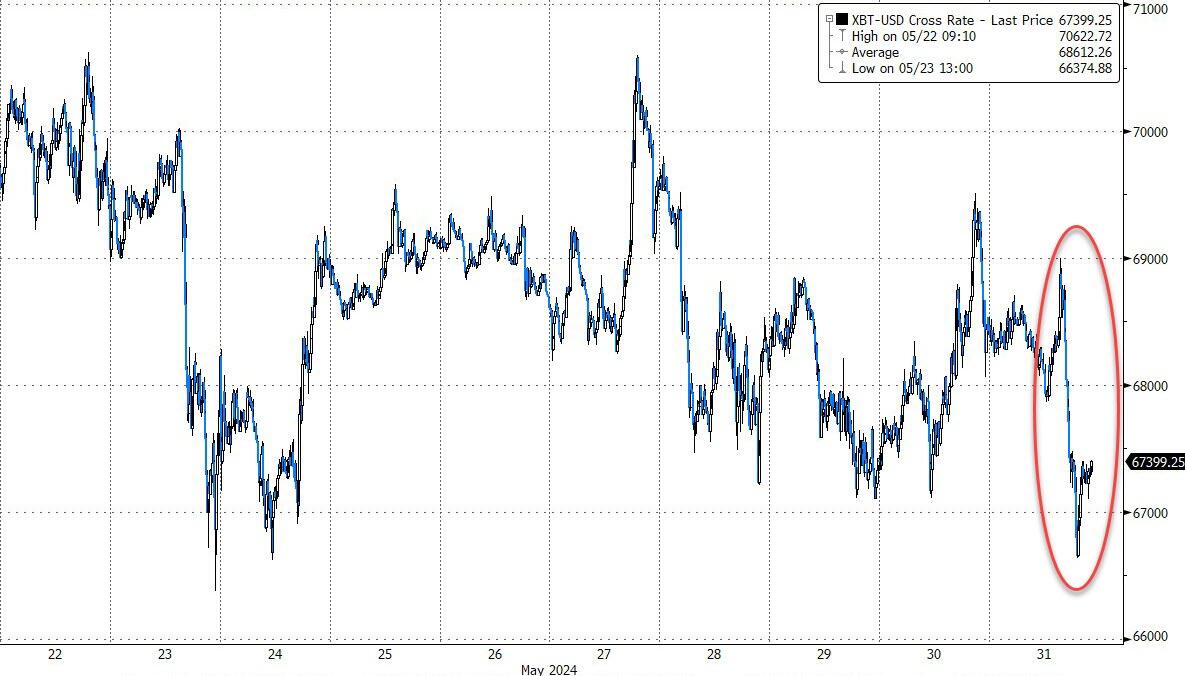
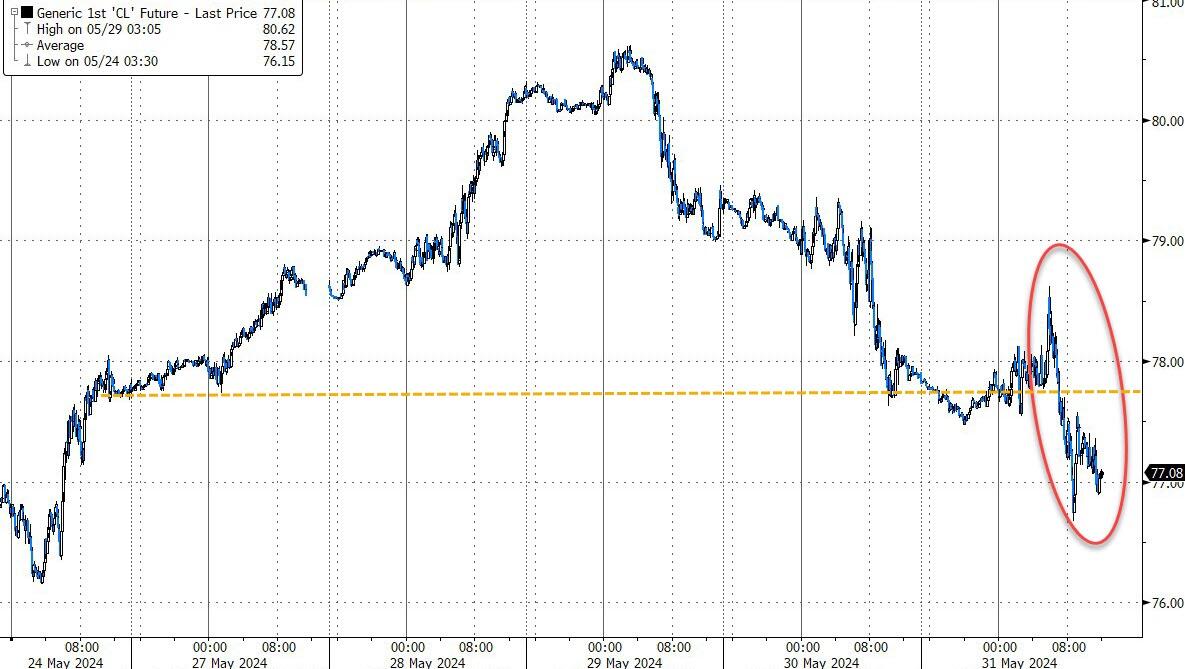
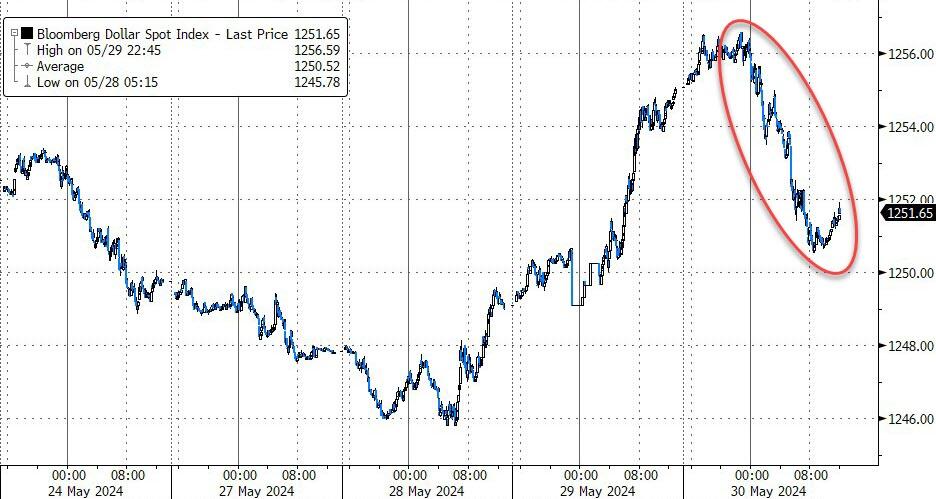
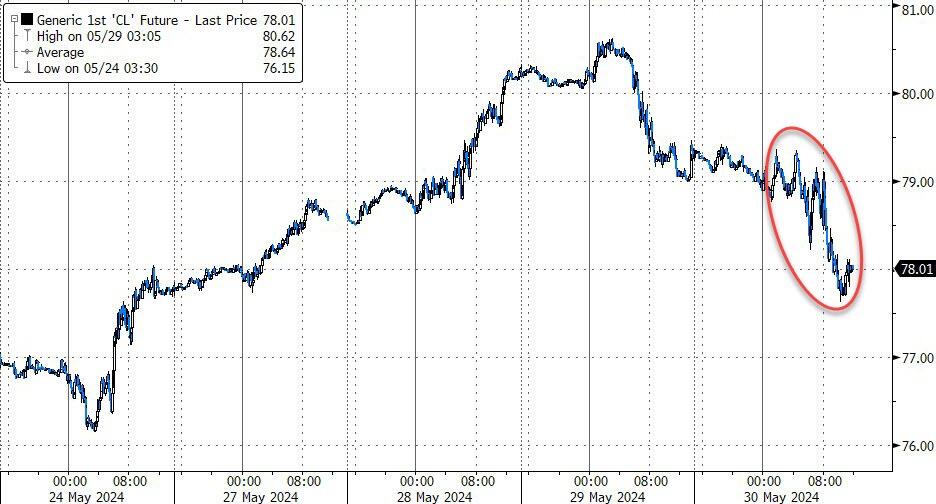
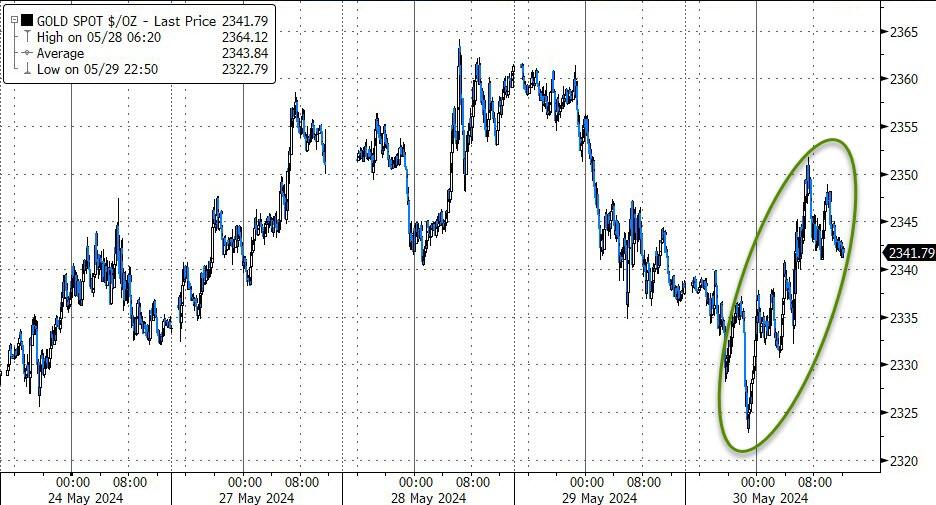
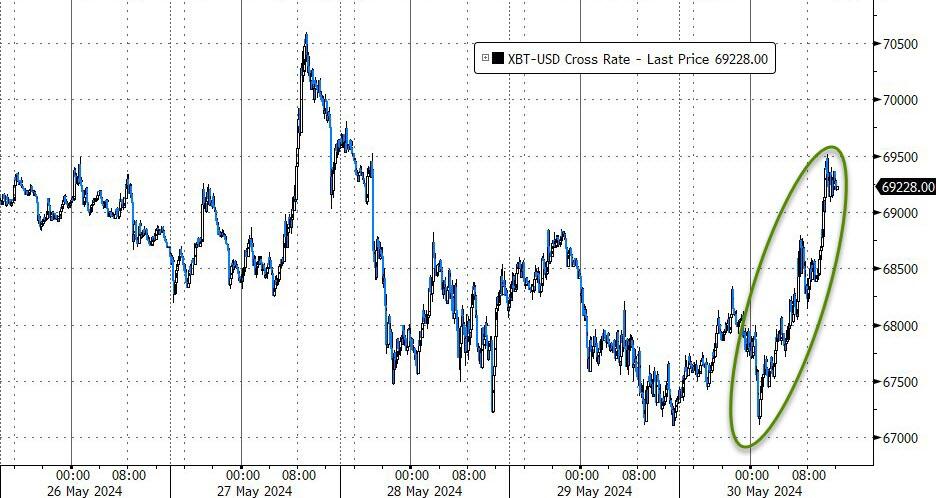
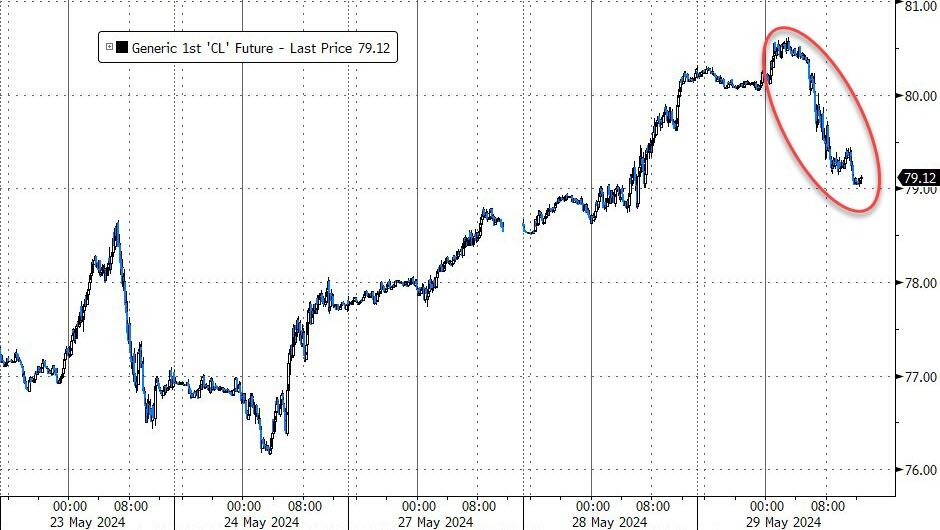
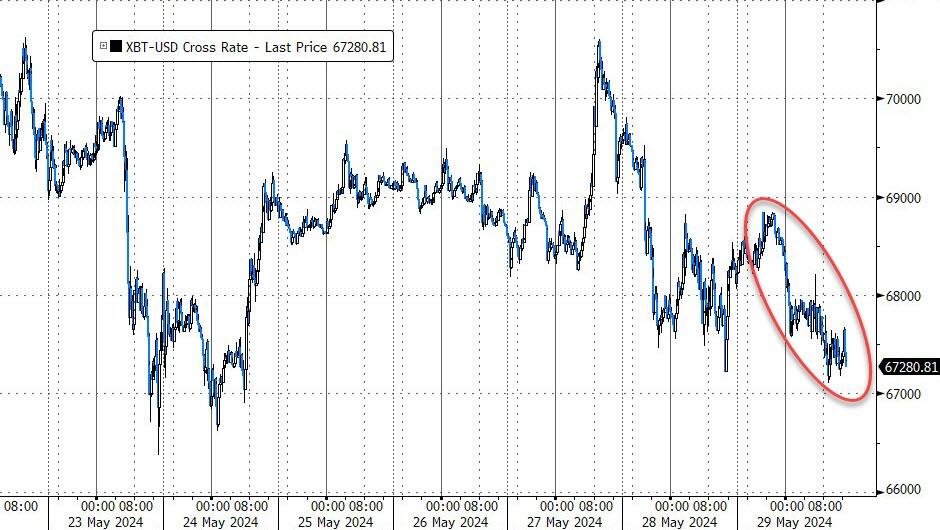
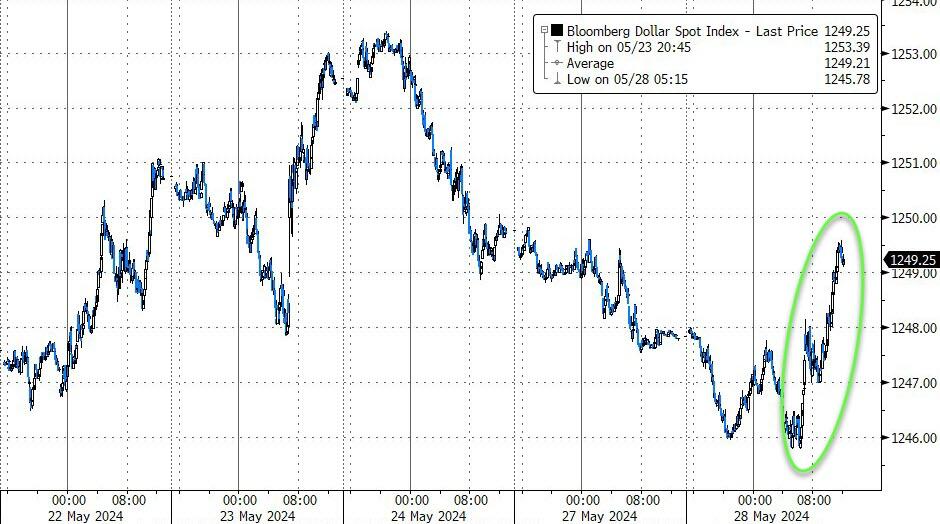
The MAG7 stocks lost momentum, while bond yields showed a mixed picture. The dollar moved higher after bouncing off its unchanged line, gold pulled back from yesterday’s gains, as Bitcoin dropped but found support at its $67k level. Crude oil, after a spike midweek, gave back all advances for the week.
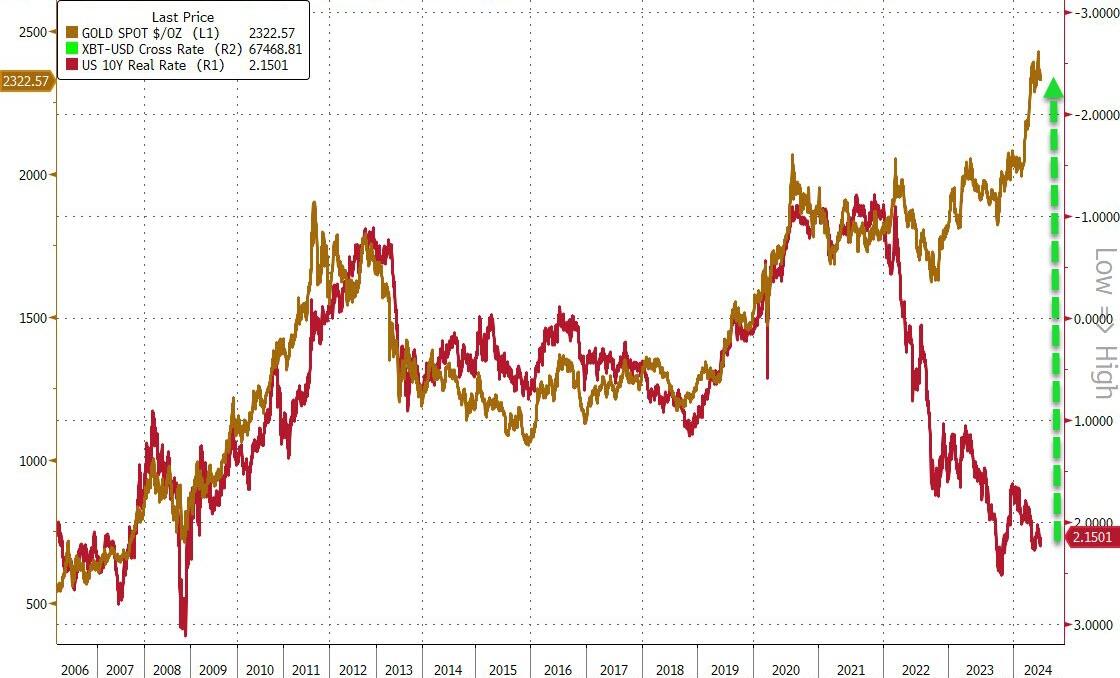
Another divergence, between gold and the 10-year real rate, has created another alligator snout, which is bound to close at some time.
Out of the 1,800+ ETFs out there, I only pick the ones that trade over $5 million per day (HV ETFs), so you don’t get stuck with a lemon that nobody wants to buy or sell.
Trend Tracking Indexes (TTIs)
These are the main indicators that tell you when to buy or sell Domestic and International ETFs (section 1 and 2). They do that by comparing their position to their long-term M/A (Moving Average). If they cross above, and stay there, it’s a green light to buy. If they fall below, and keep going, it’s a red light to sell. And to make sure you don’t lose your shirt if things go south, I also use a 12% trailing stop loss on all positions in these categories.
All other investment areas don’t have a TTI and should be traded based on the position of each ETF relative to its own trend line (%M/A). That’s why I call them “Selective Buy.” In other words, if an ETF goes above its own trend line, you can buy it. But don’t forget to use a trailing sell stop of 12%, or less if you’re feeling nervous.
If some of these words sound like Greek to you, please check out the Glossary of Terms and new subscriber information in section 9.
DOMESTIC EQUITY ETFs: BUY— since 11/21/2023
Click on chart to enlarge
This is our main compass, the Domestic Trend Tracking Index (TTI-green line in the above chart). It has broken above its long-term trend line (red) by +6.23% and is in “Buy” mode as posted.
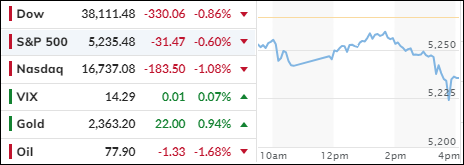
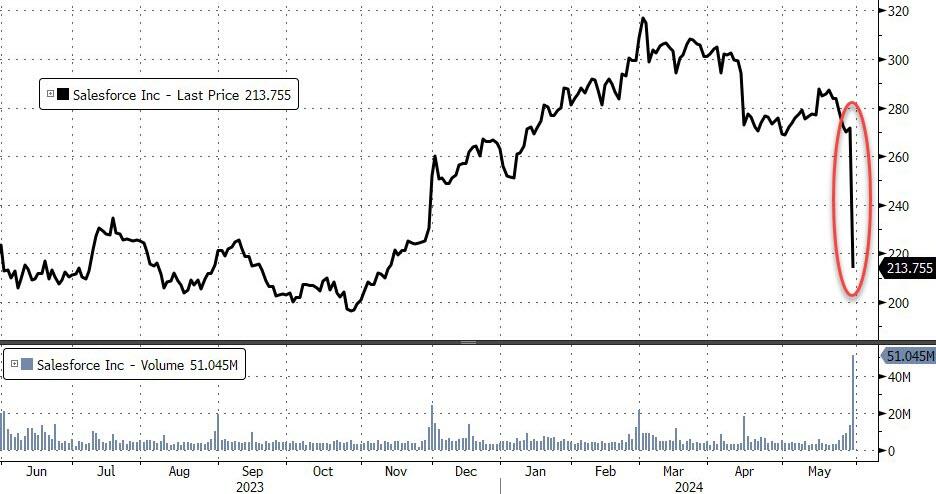
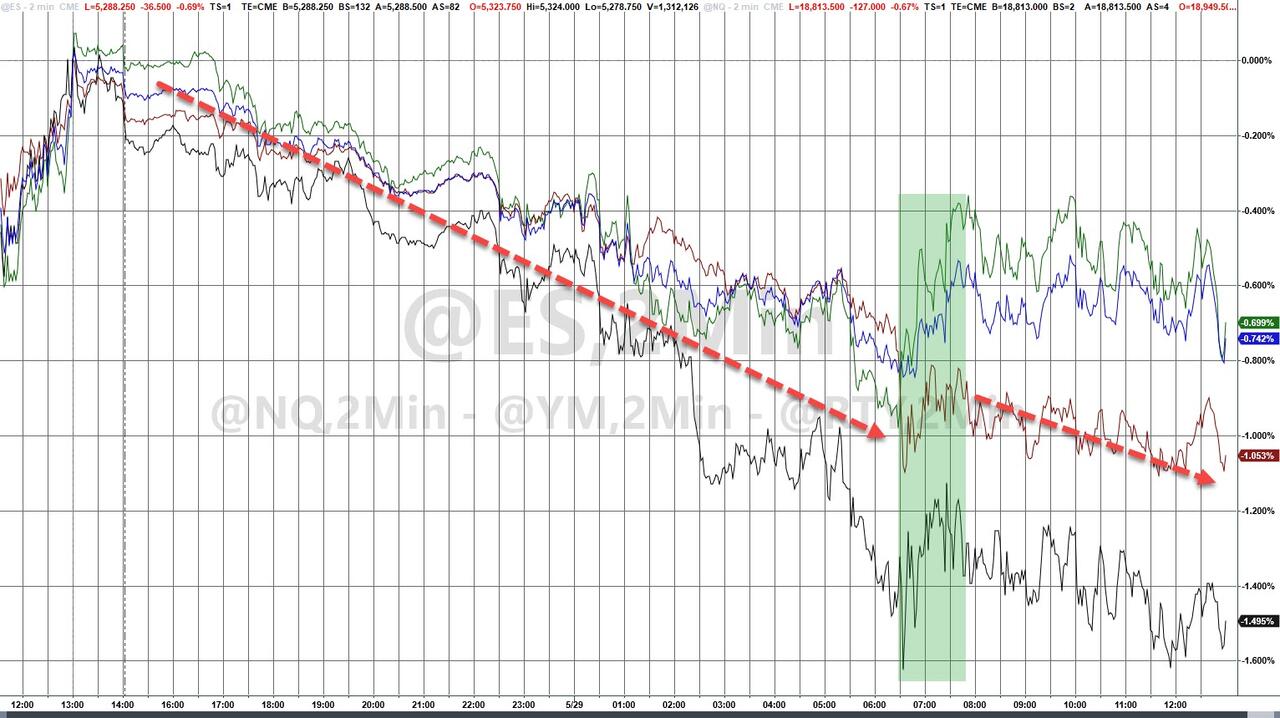
The major indexes started this session deep in the red, with Salesforce’s 20% drop due to a revenue miss and weak guidance setting a bearish background, while upcoming key inflation data created anxiety on the trading floors.
Despite this being a holiday shortened week, the major indexes are modestly in the red and seem to be on track to snap their five-week winning streaks. The Dow fared the worst by having lost more than 2% so far.
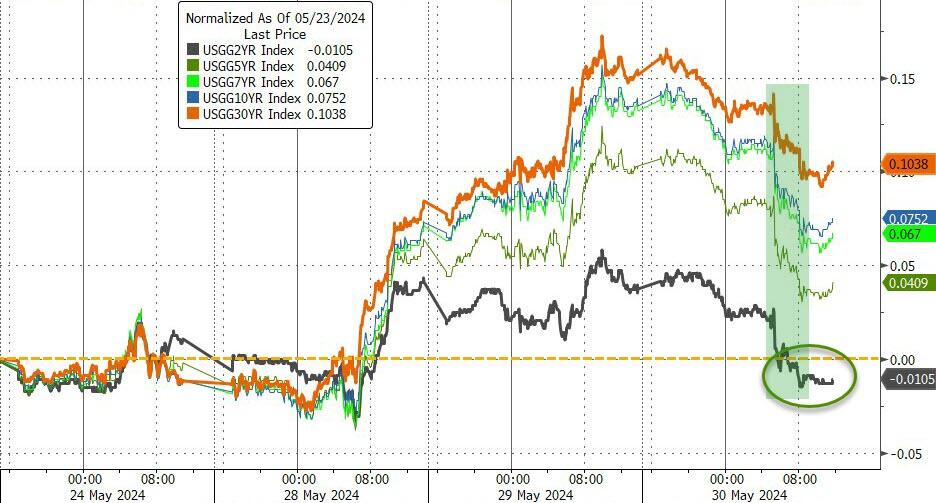
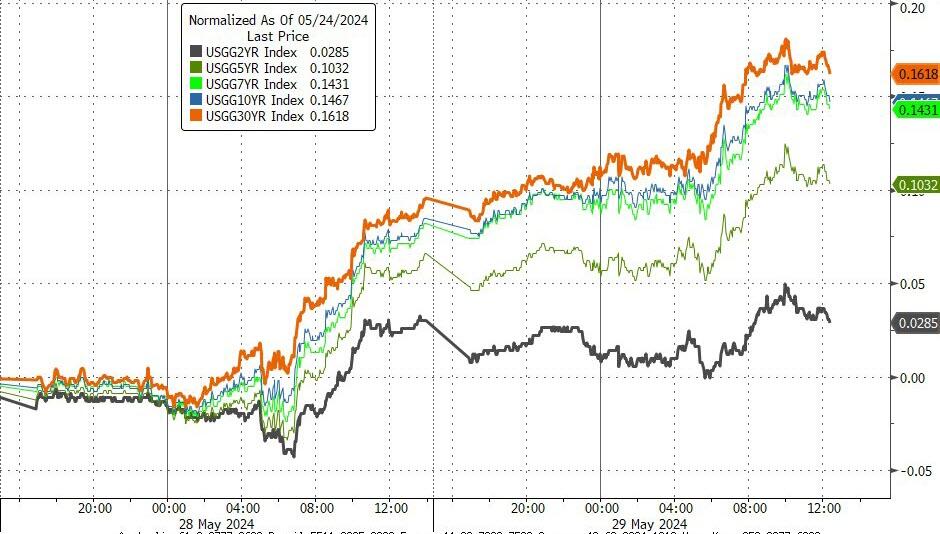
Higher bond yields affected bullish sentiment negatively, as safer investments with higher yields provided a risk-off alternative to equities. The line in the sand has been the 4.5% yield for the 10-year, and we are currently above that level.
Despite this rollercoaster week, the major indexes look to close out the month of May with solid gains, with the Nasdaq and S&P so far being in the green by 7% and 4% respectively.
Still, I see more choppiness ahead, as concerns about consumer health are on traders’ minds along with the path of interest rates, both of which will have a direct impact on market direction.
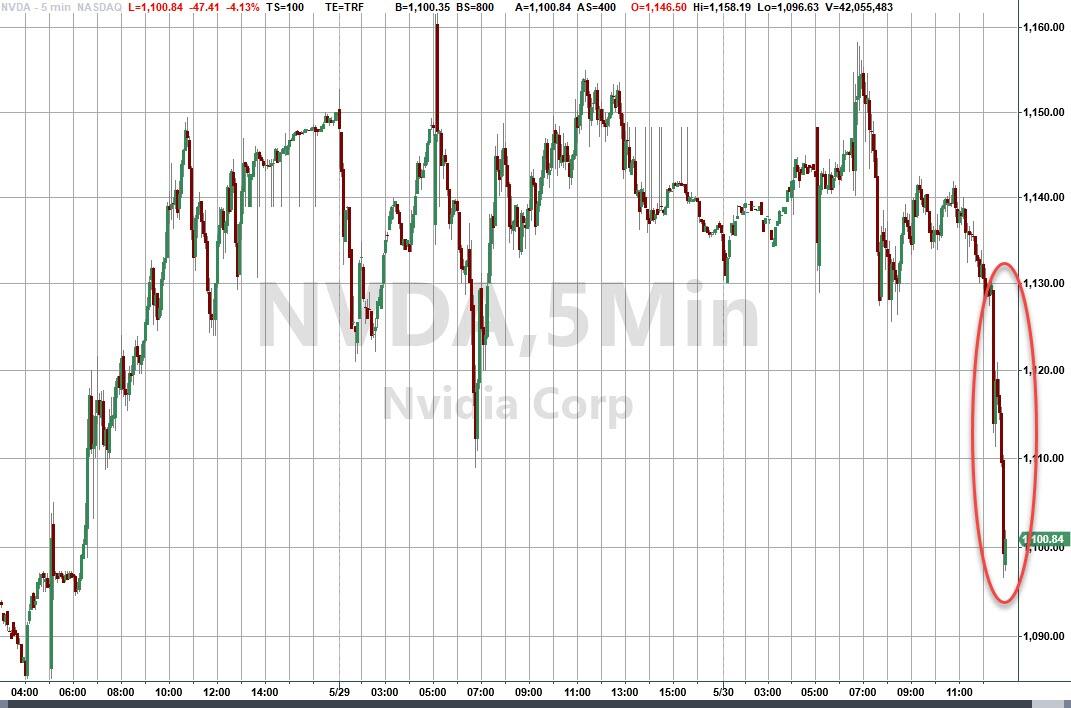
Bond yields slipped, but that did not assist Nvidia, as the tech giant pulled back almost 4%. Small Caps saved the day for equities by rallying around 1%, while the dollar dropped and erased yesterday’s gains.
Crude oil prices dived, but gold found support with the precious metal adding almost 1%. Bitcoin joined the party and increased over 2%.
All eyes are now on tomorrow’s personal consumption expenditure price index (PCE), which serves as the Fed’s favorite inflation gauge. It’s expected to come in around 2.7% for April, which is still above the Fed’s 2% target.
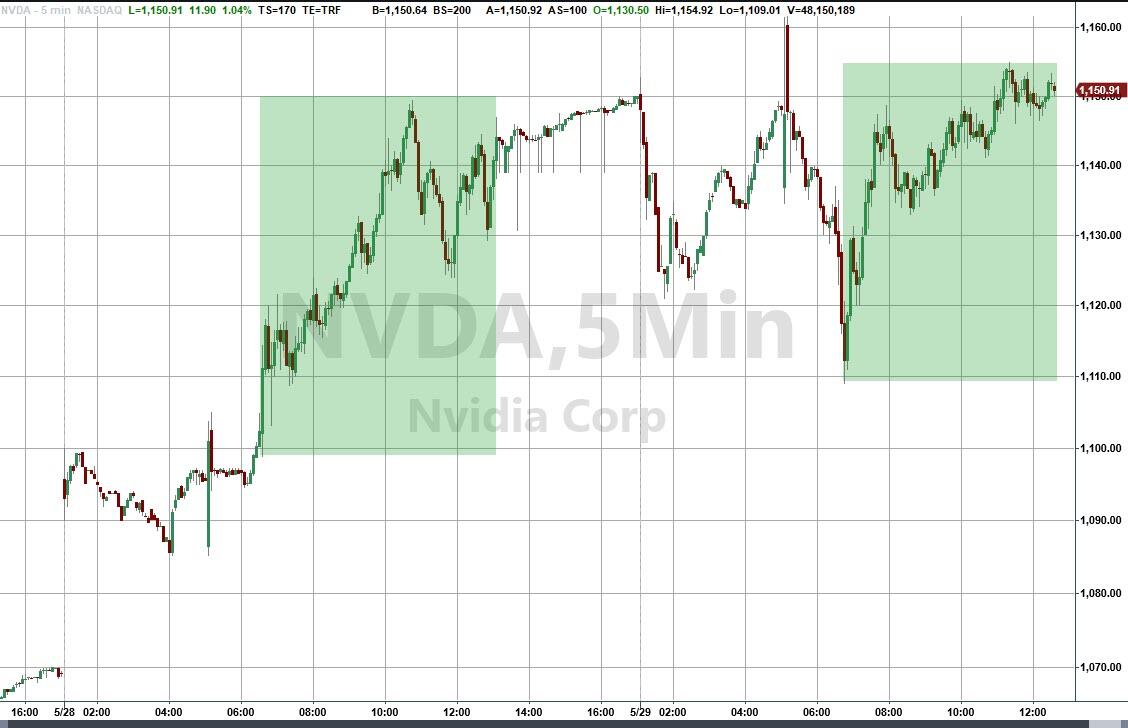
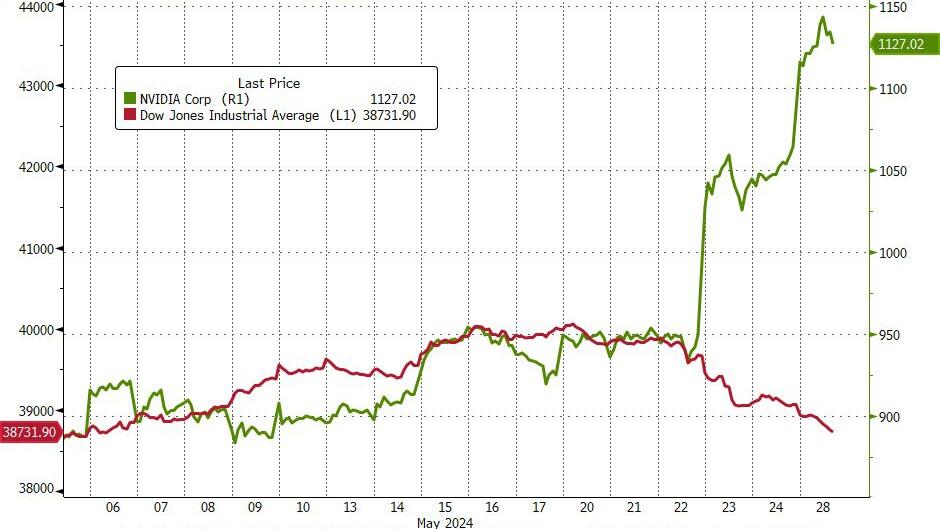
All focus was on Nvidia, with the tech darling dumping and pumping and having a volatile session. It vacillated sharply around its unchanged line and was in danger of scoring its first negative session since its blowout earnings.
In the end, the stock closed higher by a scant +0.8%, but it hit a new record high.
Nevertheless, the major indexes were affected by that volatility, as this last bastion of strength rattled traders’ nerves. The major indexes headed south led by the Dow with a loss of over 1%, while breaking its 50-day and 100-day M/A.
The pullback was broad, with all 11 S&P sectors trading down and 450 members of the index being lower as well. The Dow showed a similar fate, while more than two-thirds of its components slipped into the red.
Not helping matters were bond yields, which ticked higher for the second day, as the 10-year popped above 4.6%, a level that can be troublesome for market direction. A weak Treasury auction disappointed but gave the bearish crowd a moment to cheer.
Still, month to date, the majors are up with the Nasdaq leading the pack with a gain of around 8%, followed by the S&P 500 with an almost 5% advance.
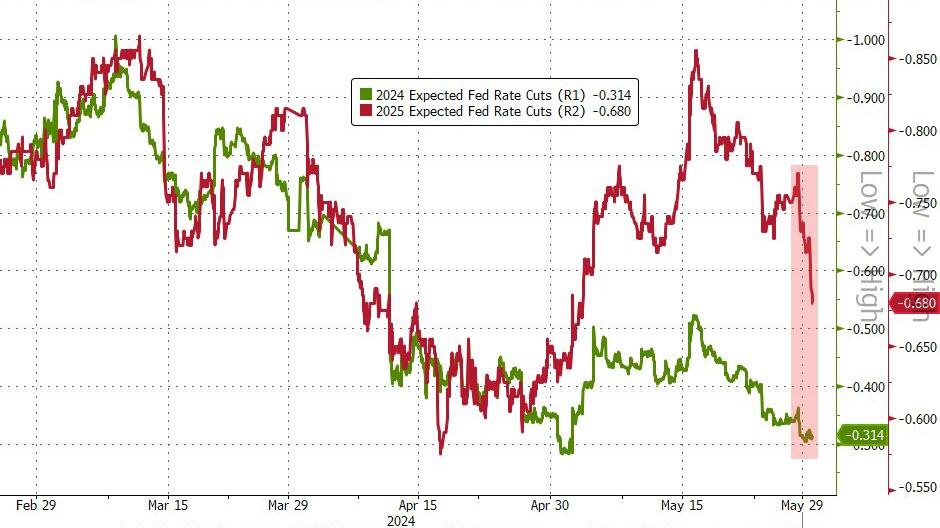
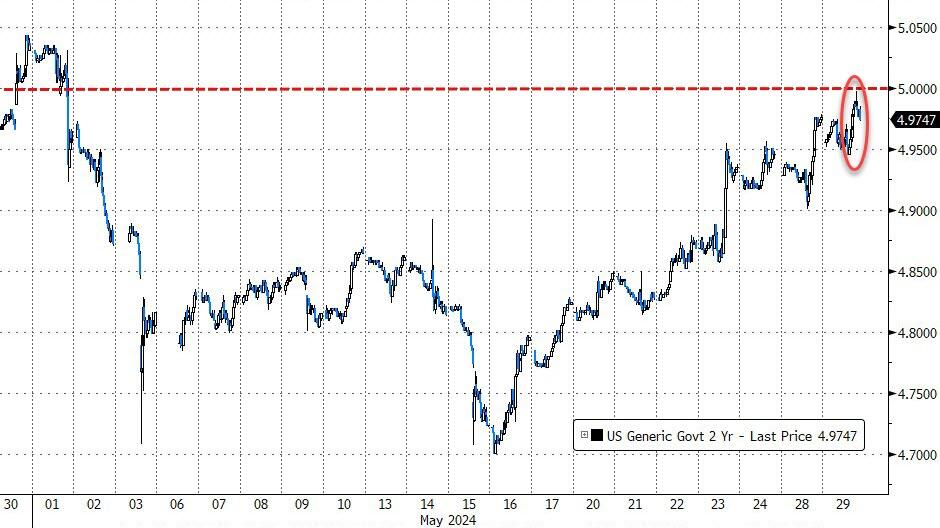
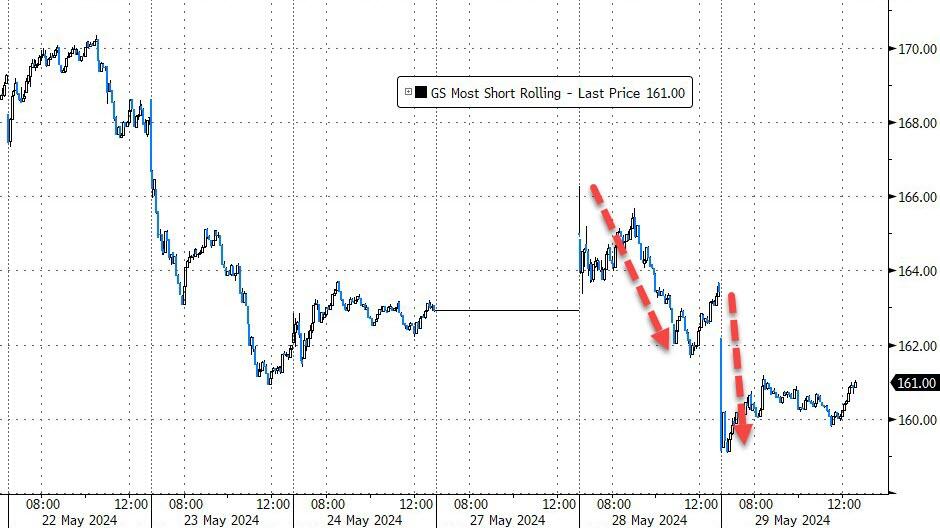
The session was a mixed bag, as rate-cut expectations headed south, and bond yields surged, with the 2-year attacking its 5% level but failing to conquer it. The most shorted stocks did what they do best in this environment, namely imitating a swan dive.
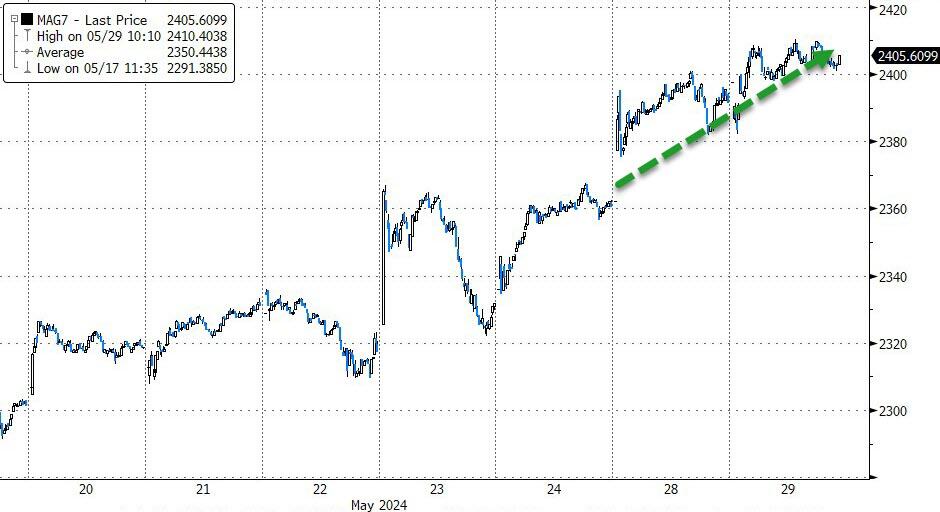
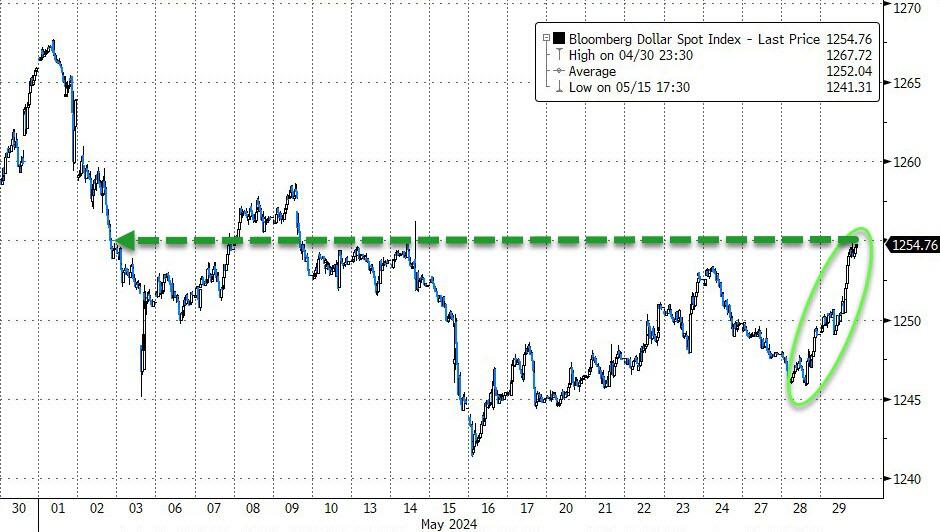
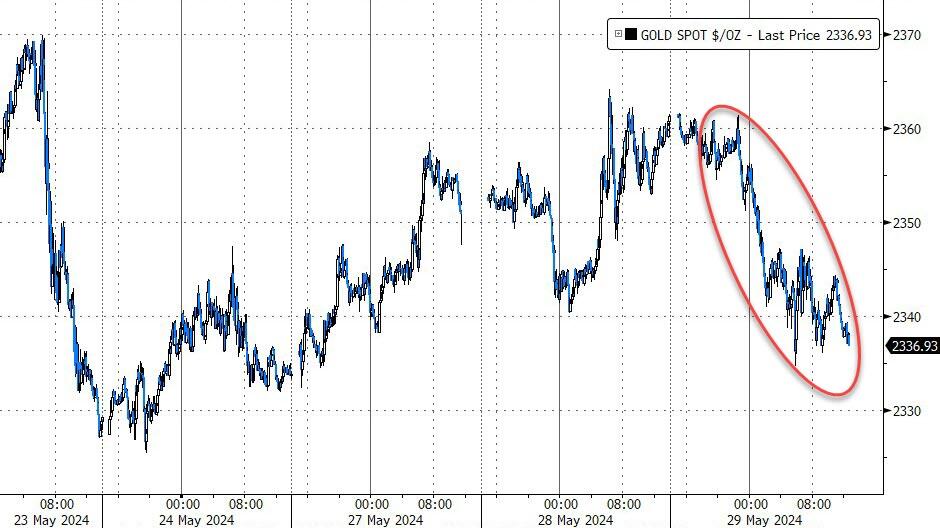
Surprisingly, the MAG7 stocks bucked the trend and headed higher. The dollar followed rates and cruised to its early May level, which triggered a sell-off in gold and crude oil. Bitcoin showed weakness as well and meandered back down to its $68k range.
Will the markets succumb to more weakness, or will they be able end the month of May with a bang to the upside? There are only two days left.
The Nasdaq powered to a new high today, and briefly crossed above its 17k milestone, thanks to Nvidia’s continued upward momentum. The tech-heavy index led the major indexes in a sluggish start to the last trading week of May.
All three major indexes look to close out a strong month after having scored new all-times at various points, despite the Dow pulling back today. Traders interpreted inflation data as “soft,” relentlessly clinging to hope that the Fed’s potential rate cuts might become reality sooner rather than later. Better than expected earnings, thanks to a low bar, lifted bullish sentiment.
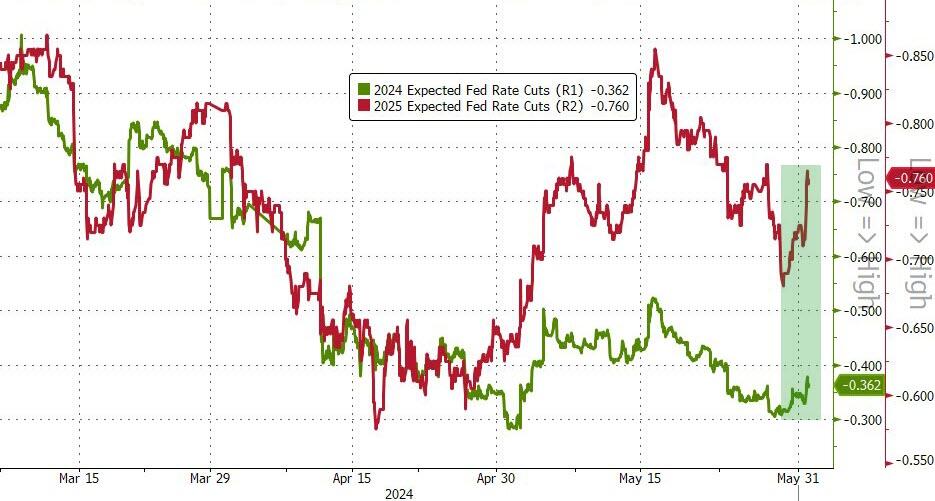
On the other hand, some strong economic data points and fresh concerns about consumers pulling back on spending has created a new wildcard, which likely has reigned in optimism for the direction of interest rates. Fed mouthpiece Kashkari did not help matters by adding that he wants to see “many more months” of data pointing to easing inflation before supporting a cut.
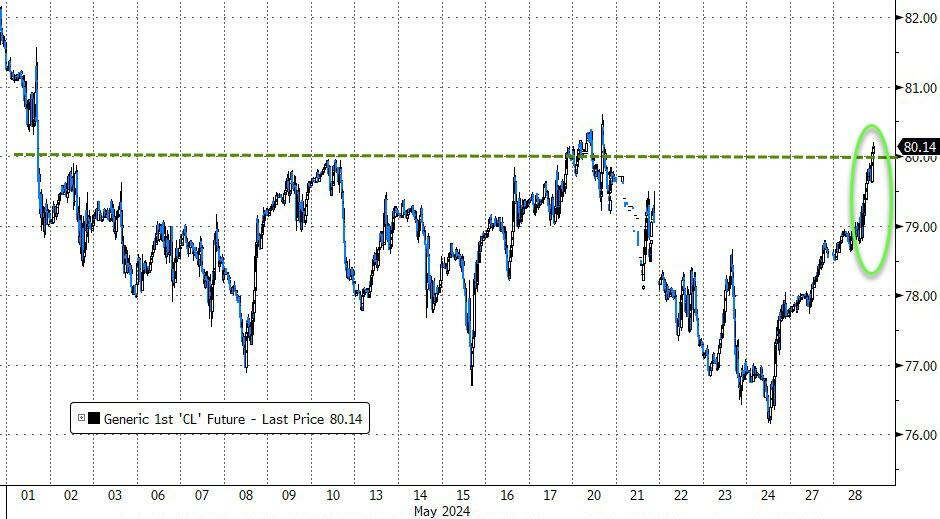
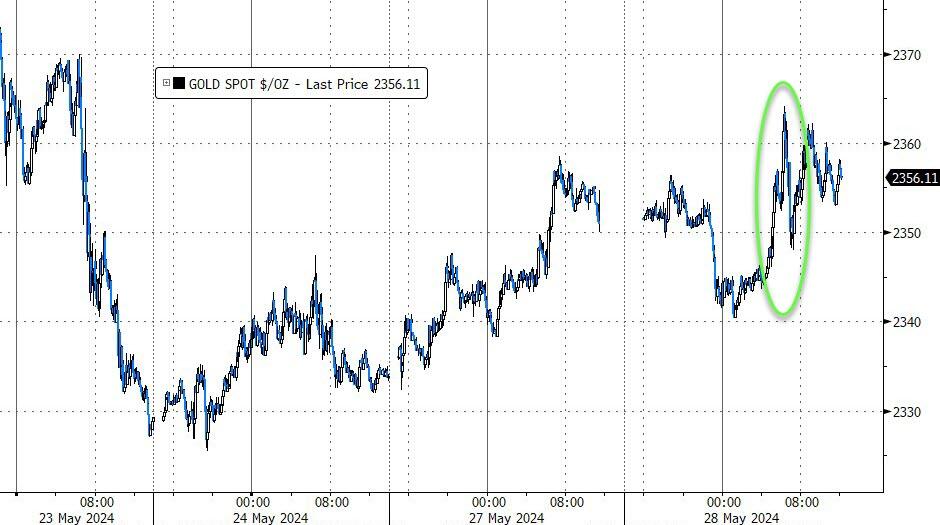
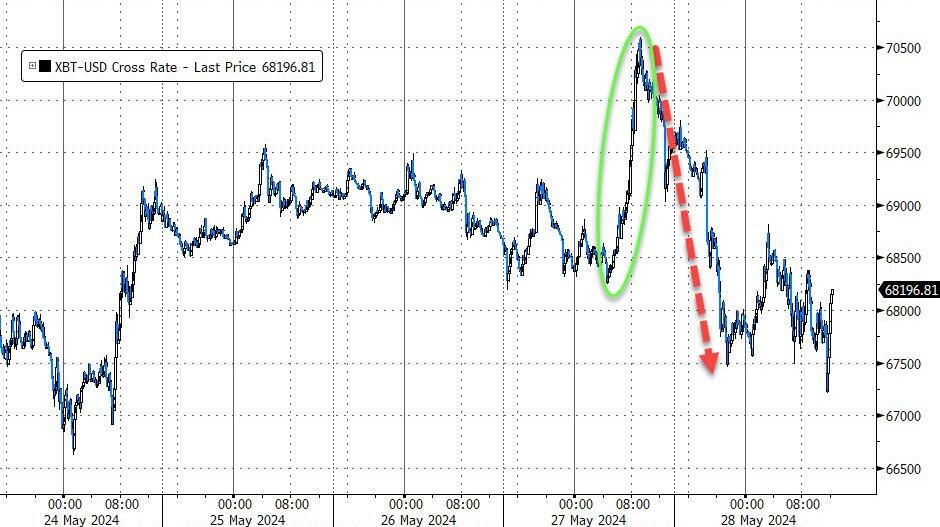
However, other asset classes moved higher as well. Oil prices jumped over 3% to close above $80, gold shot back above $2,350 and Bitcoin touched its $70.5k level before falling back.
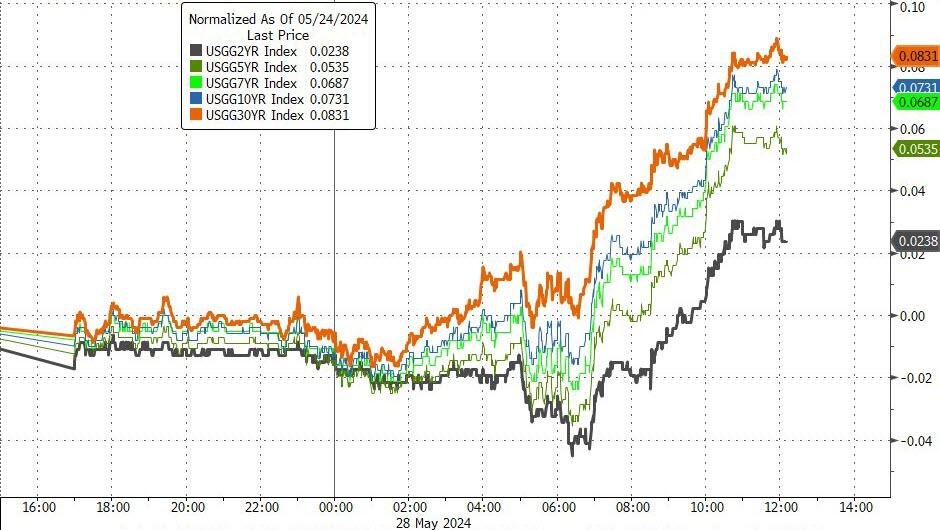
Bond yields headed higher, as some macro data showed signs of improvement, such as home prices and consumer confidence, but inflation expectations were rising. The dollar advanced and followed the direction of yields.
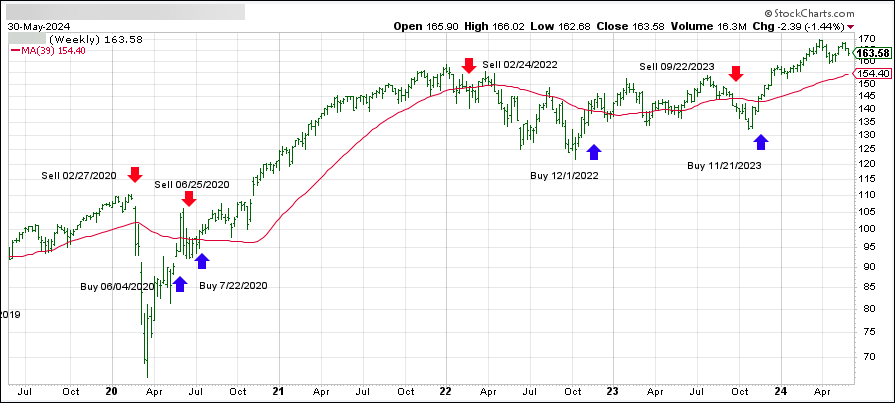
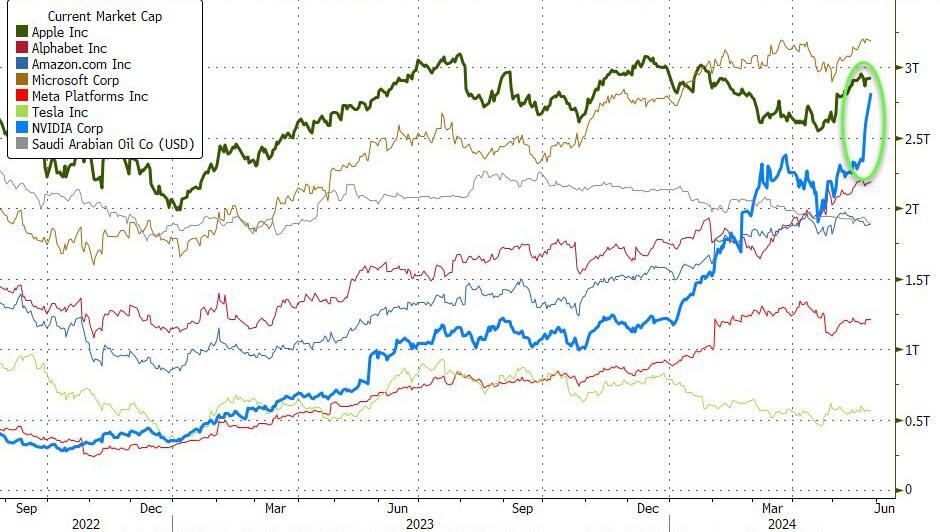
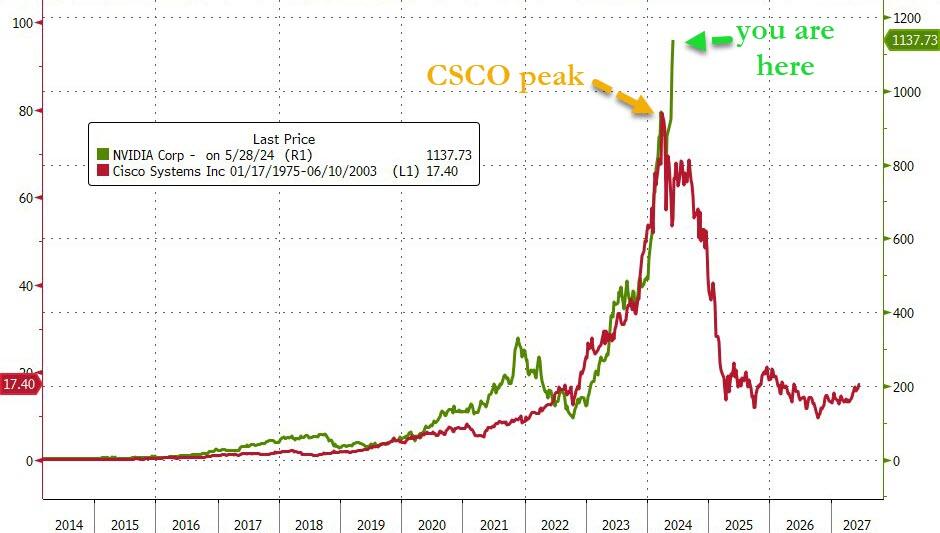
The comparison of Nvidia to Cisco Systems seems to have run its course, as this chart shows.
However, the question is: Can history still repeat itself but just from a higher level?