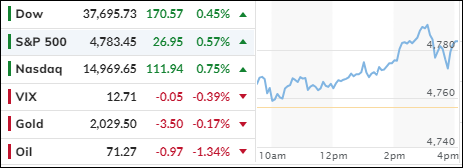
Traders pushed stocks higher today, as they waited for the latest U.S. inflation and earnings reports.
The consumer price index (cpi) for December, due tomorrow, is expected to show a 3.2% annual increase. Traders will scan the reports for hints on when the fed will start lowering rates.
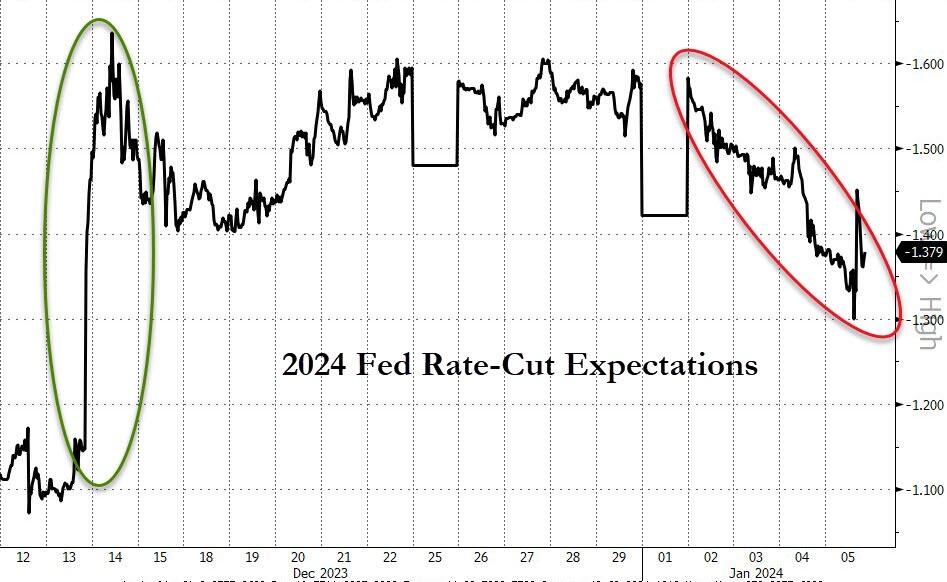
Those hopes have faded a bit lately, even though the chances are still above 60%. It seems like we had too much fun at the end of last year, when the Fed turned dovish, and now we have a headache, as some of its officials changed their tune.
That was the case today, when fed’s Williams said that they need to keep rates high ‘for some time’. That dragged the major indexes down and sent small caps into the red.
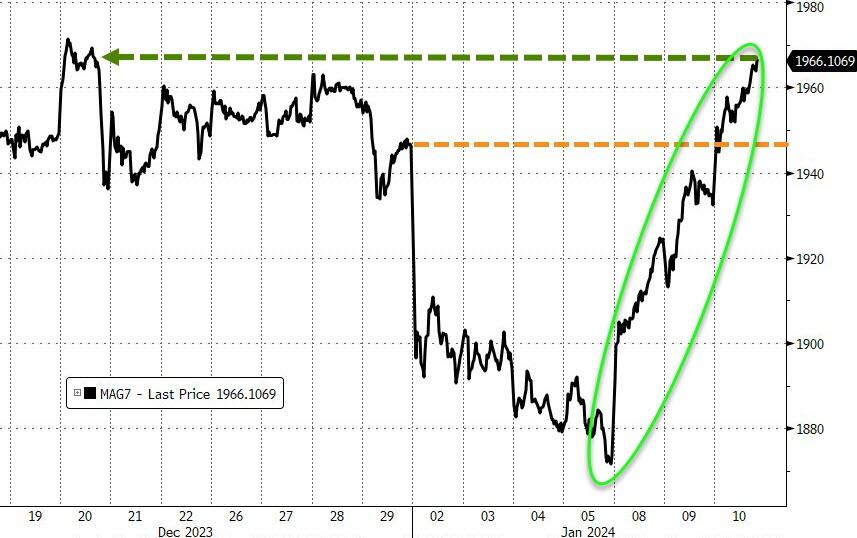
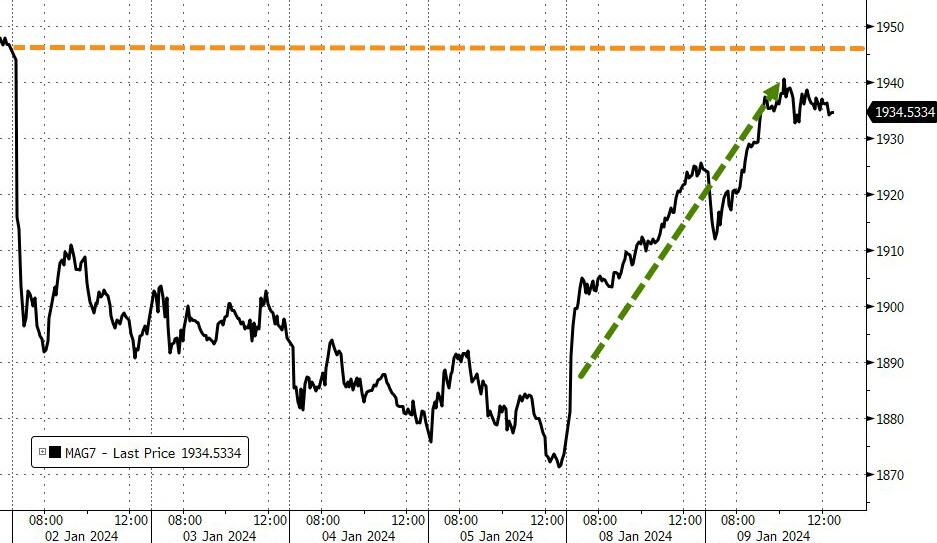
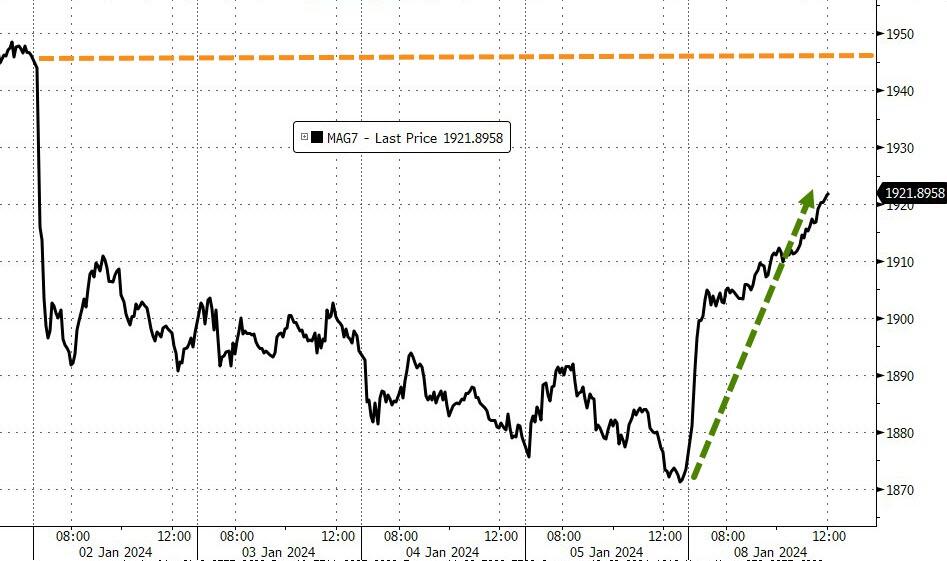
But a surprise approval of the bitcoin ETFs by the SEC gave the market a boost, and small caps recovered to break even. The MAG7 stocks kept their momentum, rising 5% in three days and turning positive for the year.
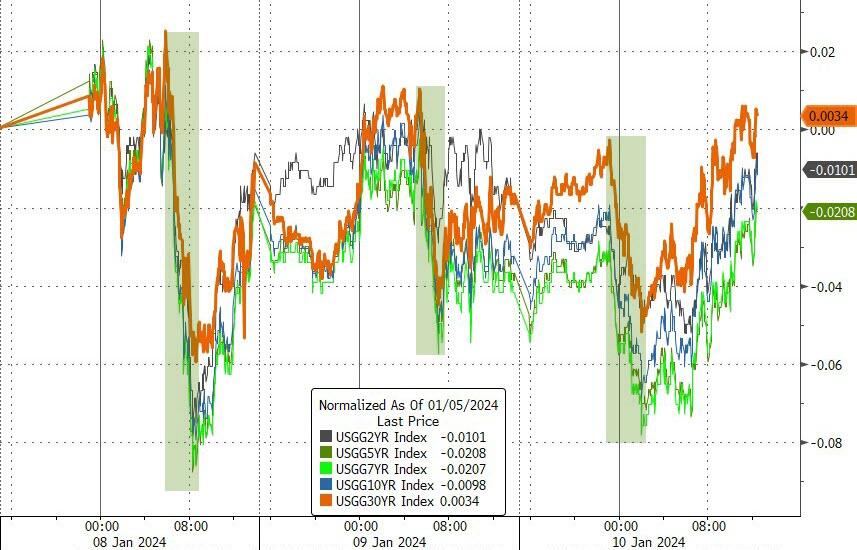
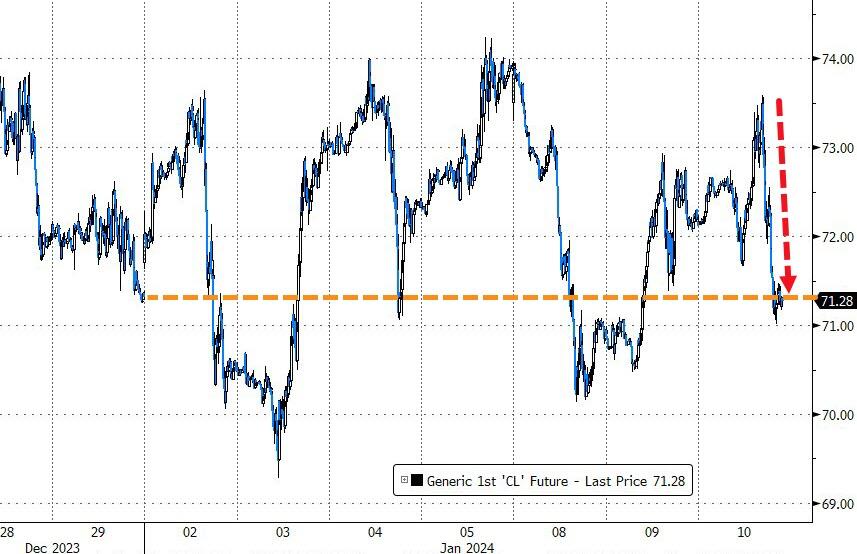
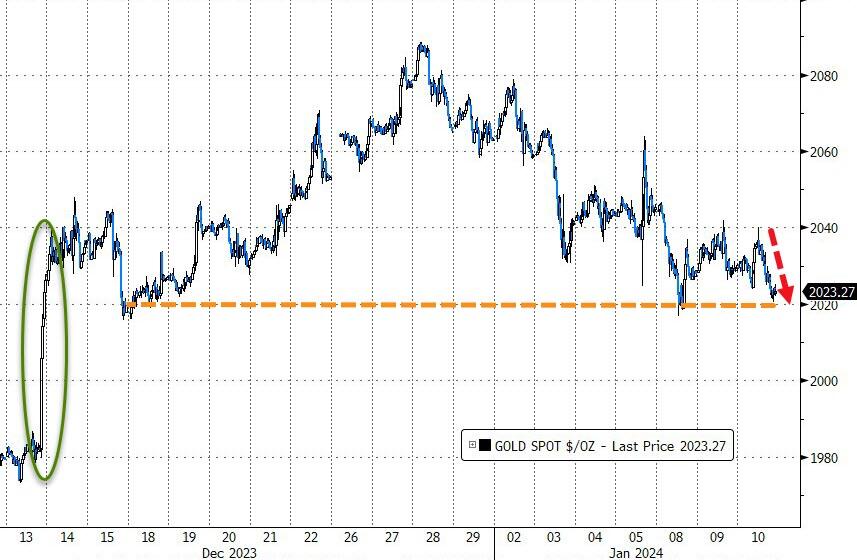
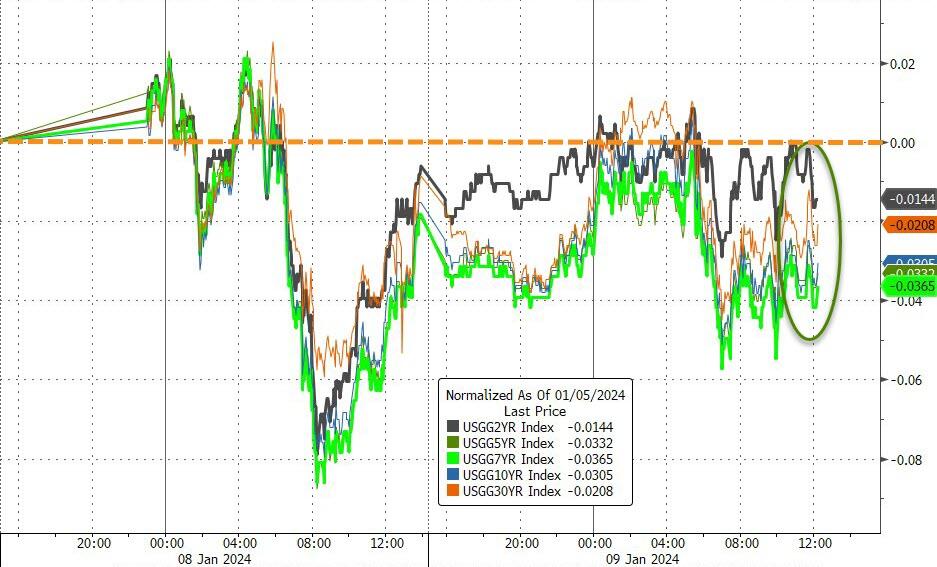
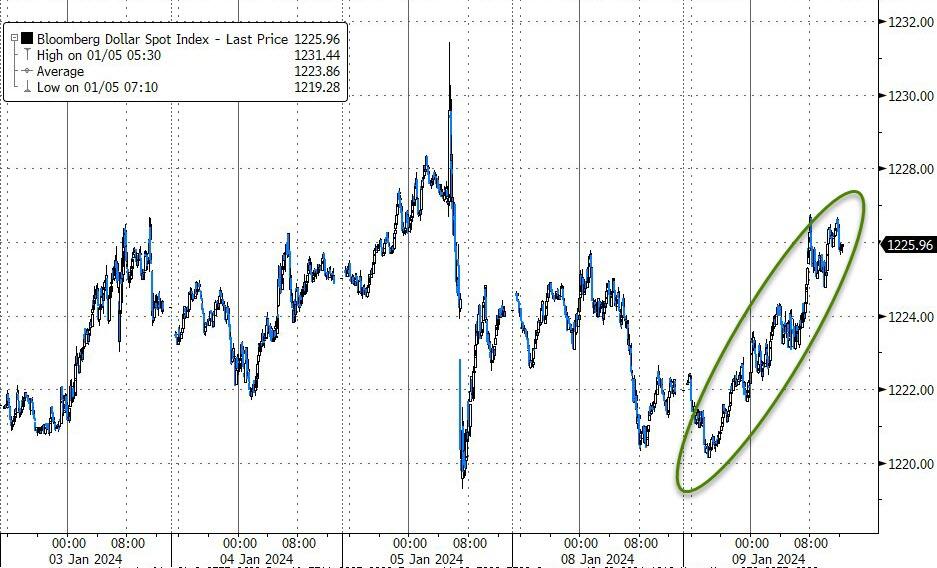
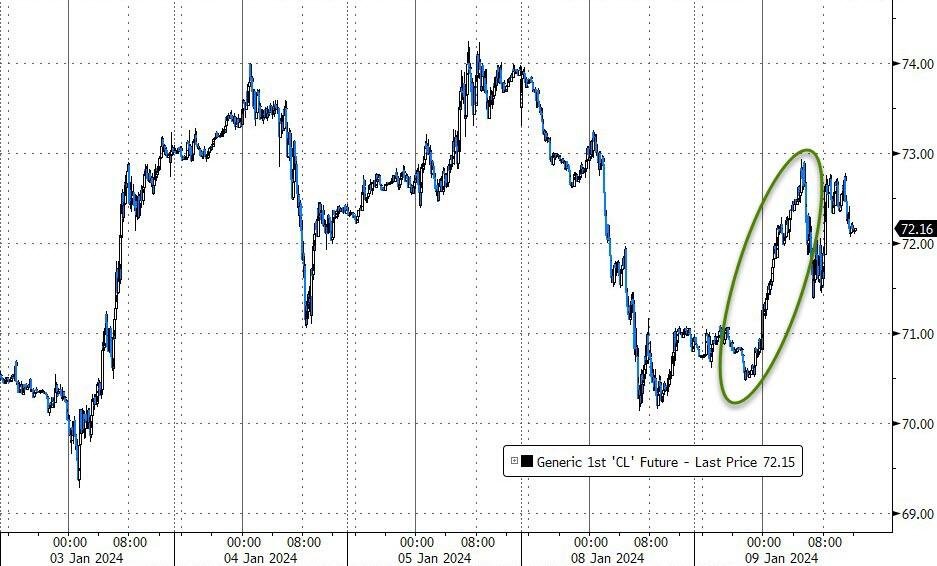
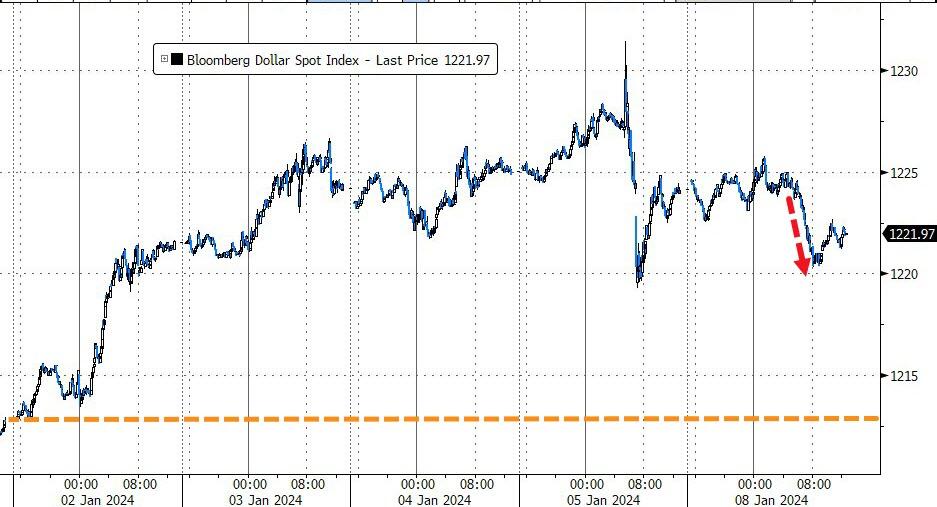
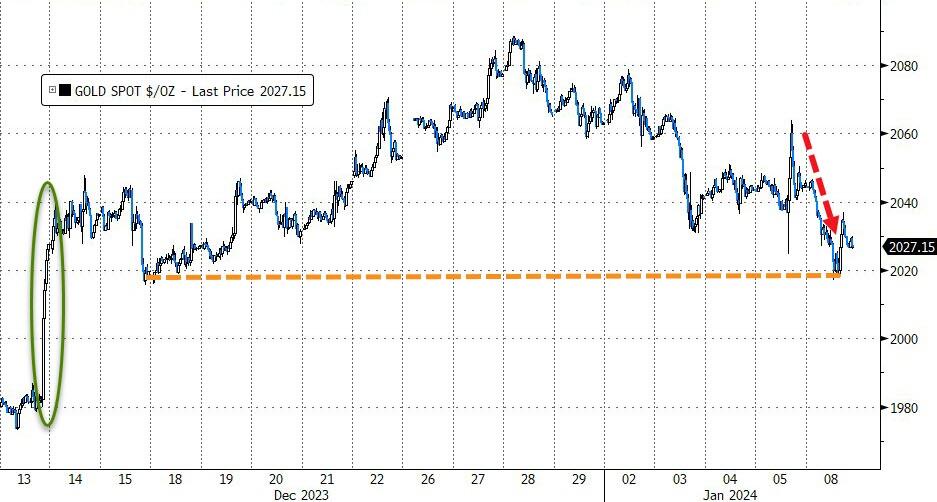
Bond yields edged higher, with prices swinging wildly during the day. The 10-year yield closed above 4% again. The dollar was steady, oil prices retreated from their highs, and gold fell to its support level.
Will the inflation report make or break the market tomorrow?
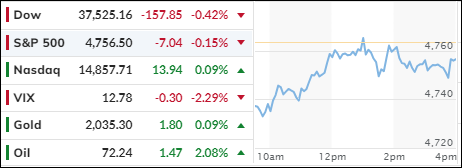
U.S. indexes had another rough day on Tuesday, but they managed to recover some of their losses by the end of the session.
Tech stocks, which had soared on Monday, gave back some of their gains as Unity Software announced a massive layoff, Netflix got downgraded by Citi, and Apple and Tesla slipped.
The only bright spot was the MAG7 stocks, which continued their comeback and are close to erasing their losses for the year.
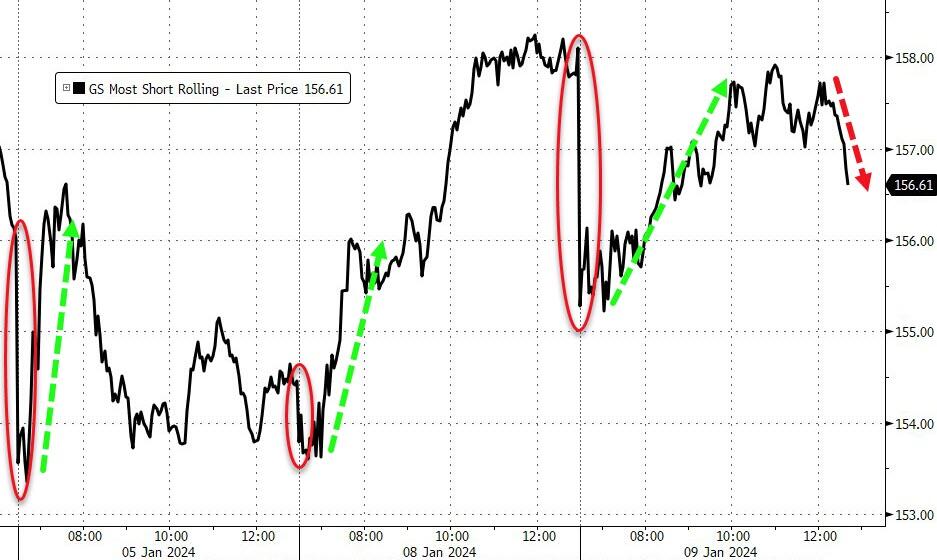
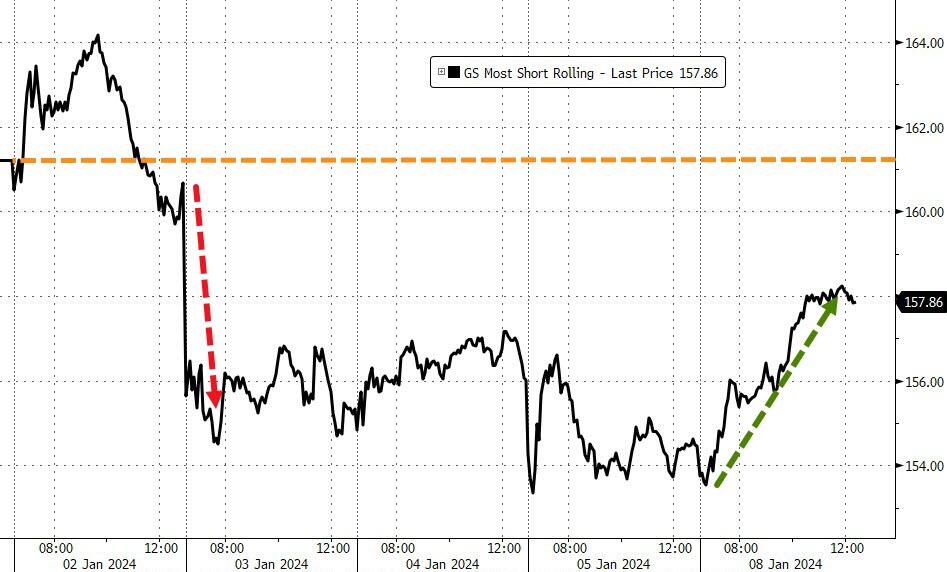
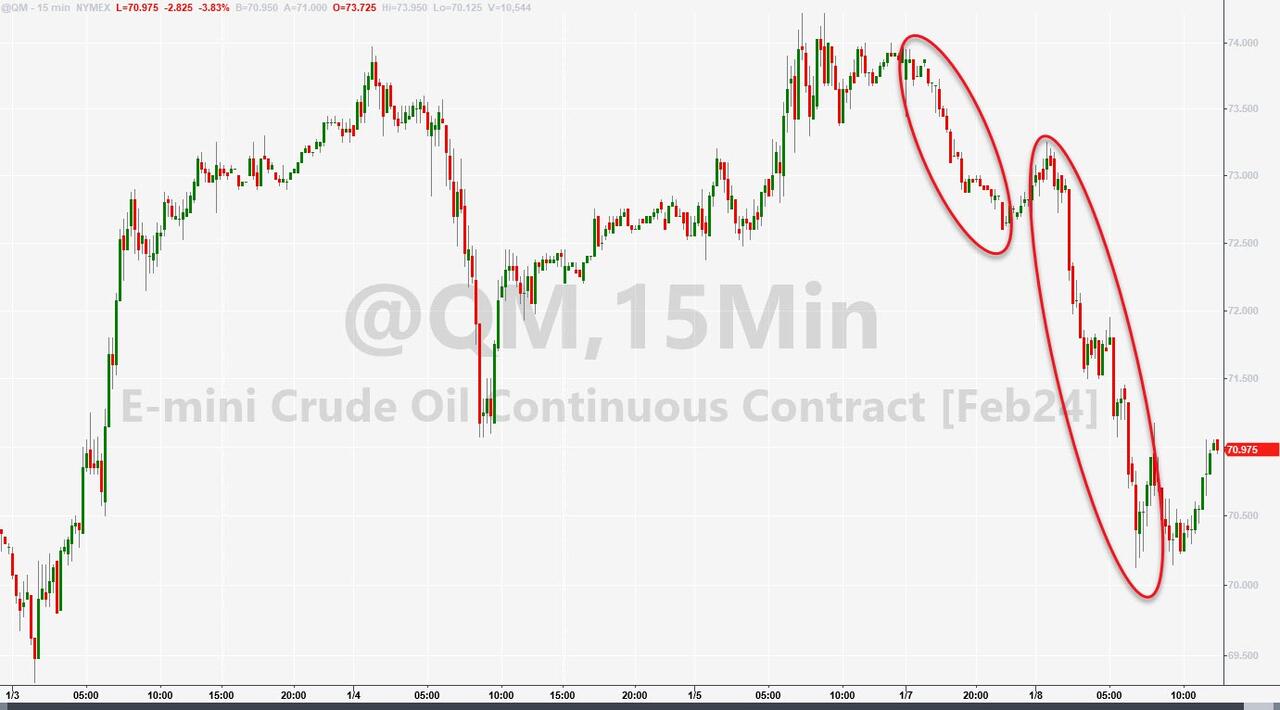
The most shorted stocks had a brief surge but fizzled out in the final hour. Gold had a modest increase, while bond yields held steady after a strong 3-year auction. The dollar rose slightly, and crude oil rebounded above $72 a barrel.
Traders will be watching the inflation data closely later this week, hoping to get some clues on the Fed’s rate cut plans.
Will they get the answers they seek, or will they be left scratching their heads?
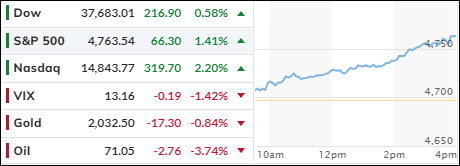
The tech sector led a rebound on Wall Street today, as investors snapped up bargains after a brutal week. The S&P 500 and Nasdaq Composite both gained ground, while the Dow lagged due to Boeing’s woes.
The rally in tech stocks came as bond yields eased, making the sector’s lofty valuations more attractive. Yields have been rising lately on expectations of higher inflation and a less dovish Fed.
This week, we’ll get more clues on the inflation front, with the CPI and PPI reports due on Thursday and Friday, respectively. Will they show that the Fed’s 2% target is still a pipe dream? Probably.
Speaking of the Fed, two of its officials gave mixed signals today on the outlook for monetary policy.
Logan hinted at the possibility of another rate hike, while Bostic projected a rate cut in the third quarter. They also disagreed on whether the Fed should slow down its balance sheet reduction. Confused? So am I.
The markets shrugged off the Fed chatter and focused on the positive. The MAG7 stocks, which have been underperforming this year, staged a comeback, helped by a short squeeze in the most hated names.
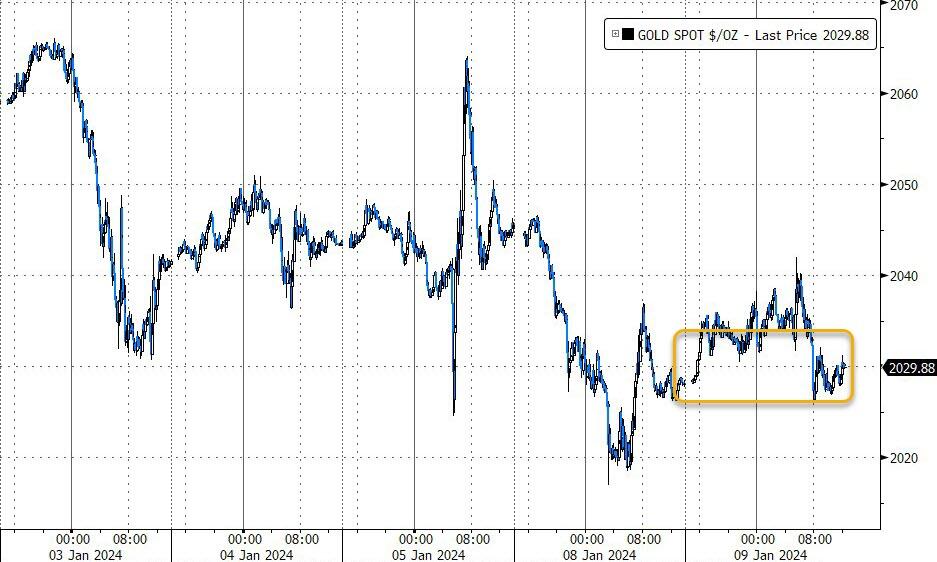
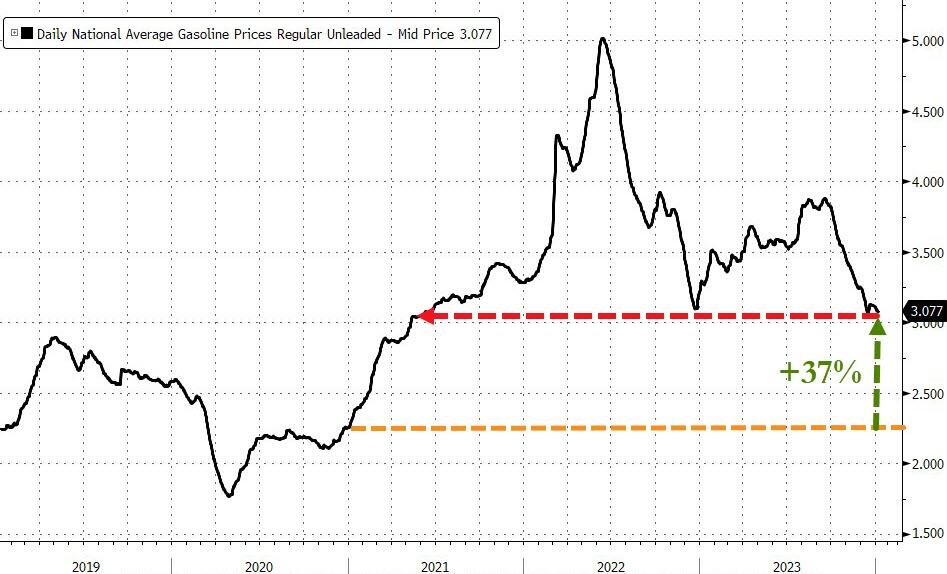
The dollar slipped a bit, but gold couldn’t capitalize on it. The yellow metal retreated from its recent highs but held above the $2,020 level. Crude oil, on the other hand, took a dive, dropping below $70 a barrel. That’s good news for drivers, who are enjoying the lowest gas prices since May 2021.
Do you want to know which ETFs are hot and which ones are not? Then you need my High-Volume ETF Cutline report. It tells you how close or far each of the 311 ETFs I follow is from its long-term trend line (39-week SMA). These are the ETFs that trade more than $5 million a day, so they are not some obscure funds that nobody cares about.
The report is split into two parts: The winners that are above their trend line (%M/A), and the losers that are below it. The yellow line is the line of shame that separates them. You can see how many ETFs are in each group and how they have changed since the last report (273 vs. 264 current).
MARKET MADNESS: STOCKS AND BONDS SWING WILDLY ON JOBS REPORT
[Chart courtesy of MarketWatch.com]
Moving the markets
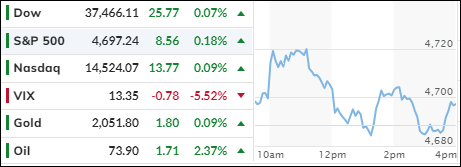
The stock market had another day of mixed signals, as investors tried to make sense of the latest economic news.
After a morning rally, the major indexes gave up most of their gains by the afternoon but managed to end the day slightly higher.
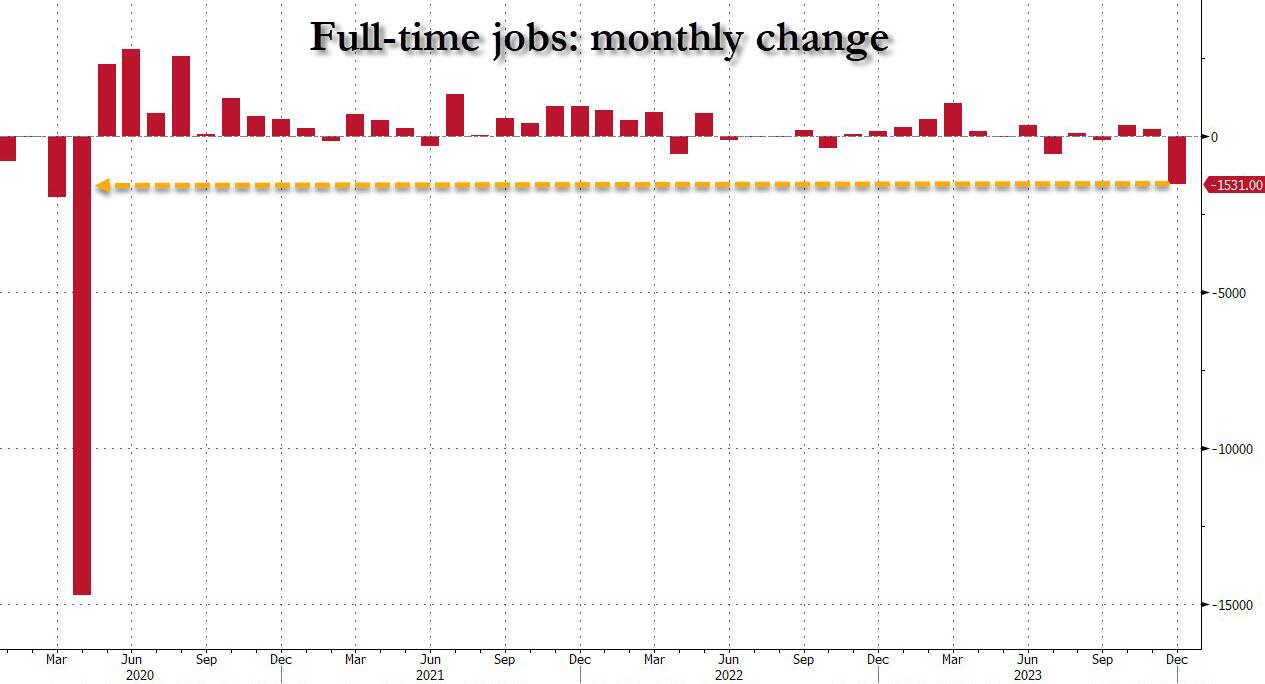
The main catalyst for the market mood swings was the December jobs report, which showed that the U.S. economy added 216,000 new jobs, beating the forecast of 170,000. That sounds like good news, right?
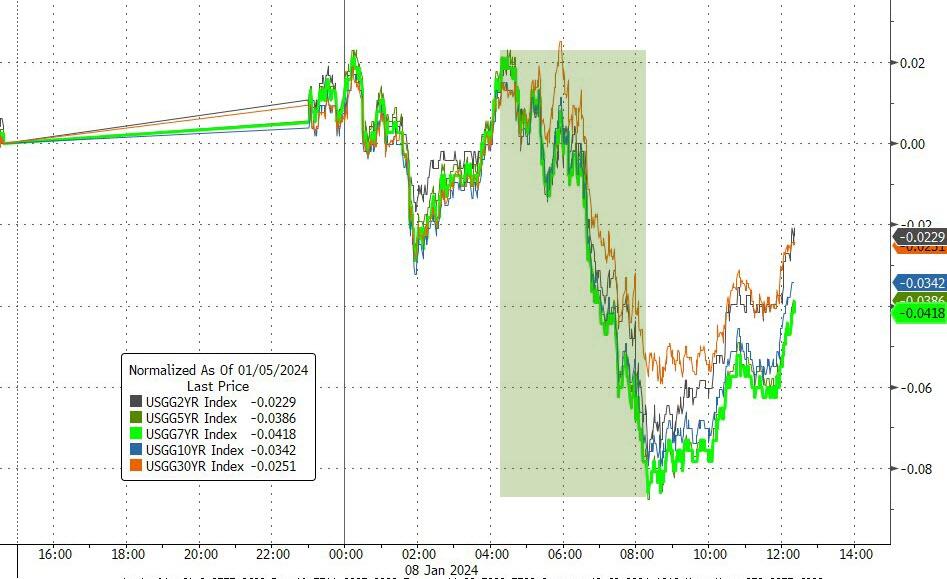
Well, not so fast. A closer look at the data revealed that full-time jobs plunged by a record 1.5 million, while part-time and multiple jobs soared to new highs. So much for the quality of work. The jobs report also sent bond yields on a wild ride, with the 10-year Treasury rate jumping to 4.06% before settling at 4.4%.
Higher yields mean higher borrowing costs, which could dampen the economic growth prospects. They also mean that the Fed might rethink its plans to cut interest rates, which the market has been counting on.
Before Friday, traders were betting that the Fed would slash rates as soon as March and as many as six times in 2024. Now, they are not so sure.
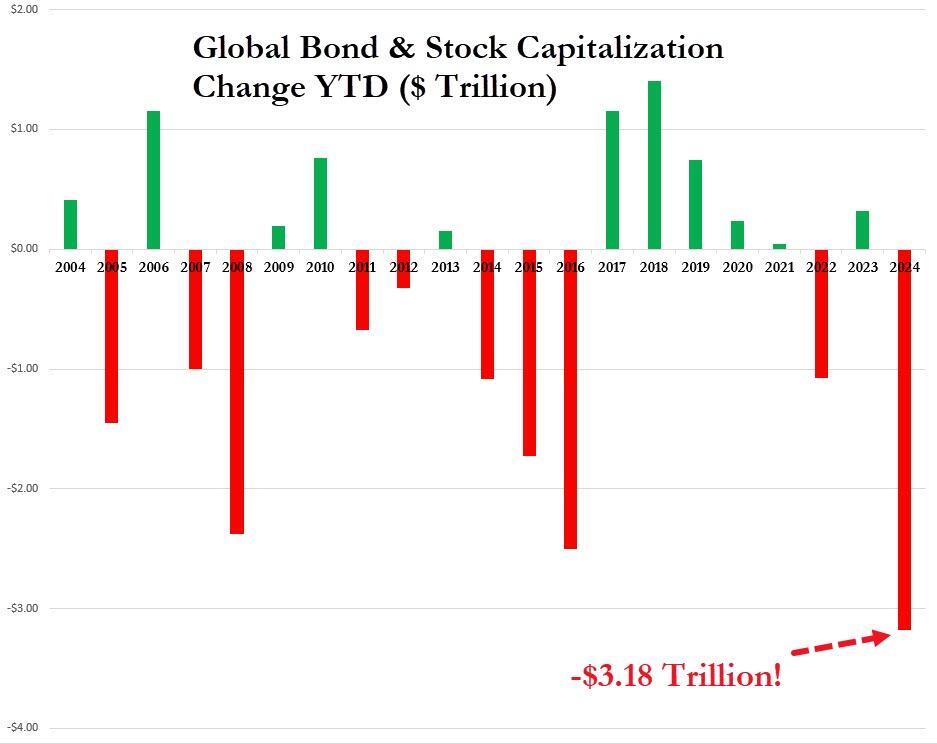
The market jitters were not limited to the U.S., as global stocks and bonds had their worst start to a year ever, losing over $3 trillion in value. That’s more than the GDP of France in case you were wondering.
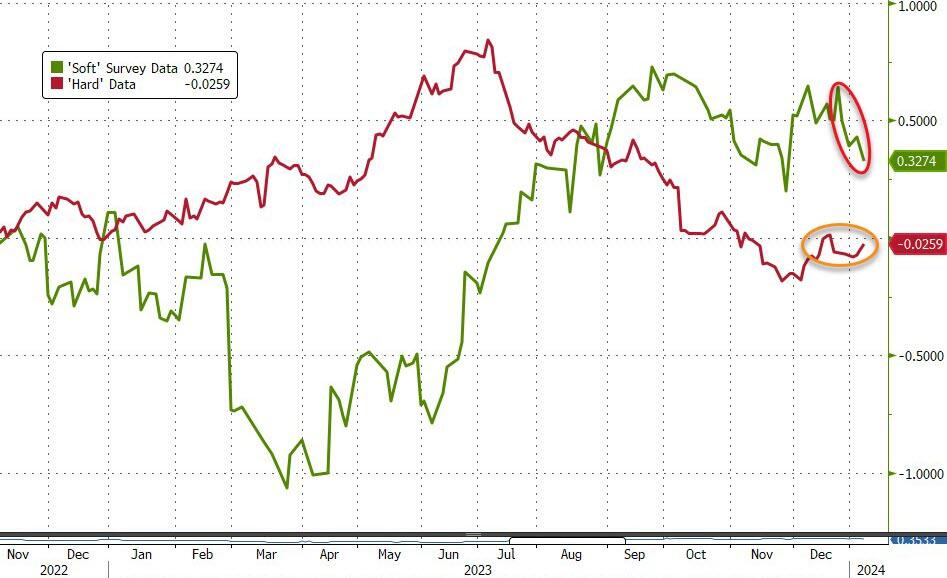
The bleak outlook was reflected in the ‘soft’ data, such as surveys and sentiment indicators, which showed a sharp decline in confidence and expectations. The ‘hard’ data, such as actual production and sales, were already gloomy, so the gap between them is narrowing.
The tech giants, known as the MAG7, felt the pain more than most, as they lost $400 billion in market cap in one week, wiping out all their gains from December.
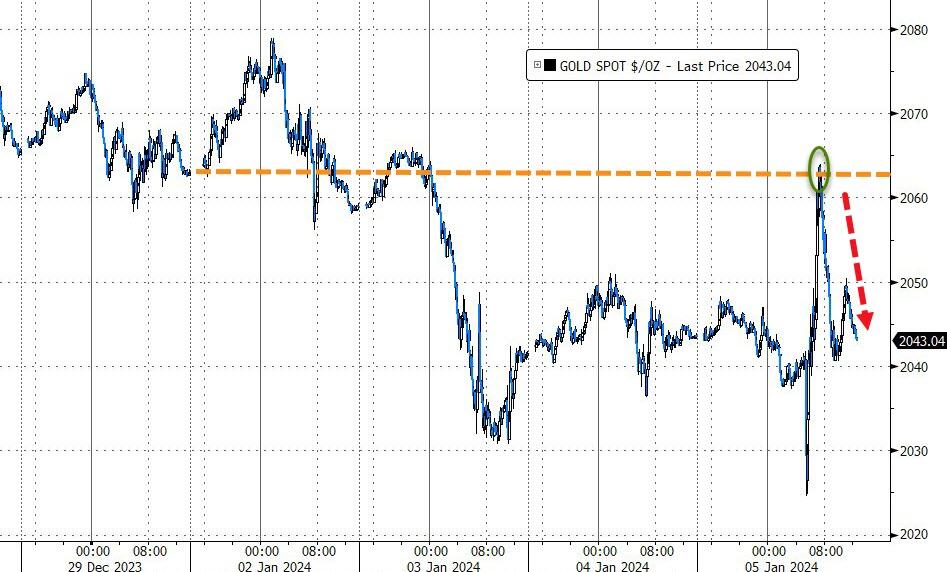
The dollar and gold also had a volatile day, as they reacted to the changing expectations of the Fed’s policy. The precious metal briefly turned positive, but then fell back.
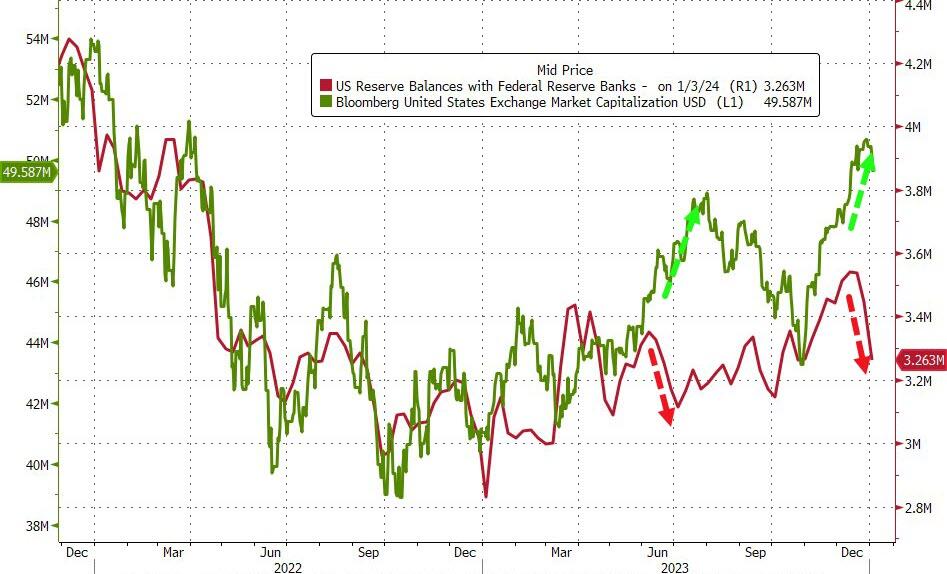
The market is clearly confused and uncertain about the direction of the economy and the Fed’s actions. One sign of this is the divergence between the Fed’s balance sheet, which is shrinking, and the market’s capitalization, which is growing. This chart shows the gap between them.
ETF Data updated through Thursday, January 4, 2024
How to use this StatSheet:
Out of the 1,800+ ETFs out there, I only pick the ones that trade over $5 million per day (HV ETFs), so you don’t get stuck with a lemon that nobody wants to buy or sell.
Trend Tracking Indexes (TTIs)
These are the main indicators that tell you when to buy or sell Domestic and International ETFs (section 1 and 2). They do that by comparing their position to their long-term M/A (Moving Average). If they cross above, and stay there, it’s a green light to buy. If they fall below, and keep going, it’s a red light to sell. And to make sure you don’t lose your shirt if things go south, I also use a 12% trailing stop loss on all positions in these categories.
All other investment areas don’t have a TTI and should be traded based on the position of each ETF relative to its own trend line (%M/A). That’s why I call them “Selective Buy.” In other words, if an ETF goes above its own trend line, you can buy it. But don’t forget to use a trailing sell stop of 12%, or less if you’re feeling nervous.
If some of these words sound like Greek to you, please check out the Glossary of Terms and new subscriber information in section 9.
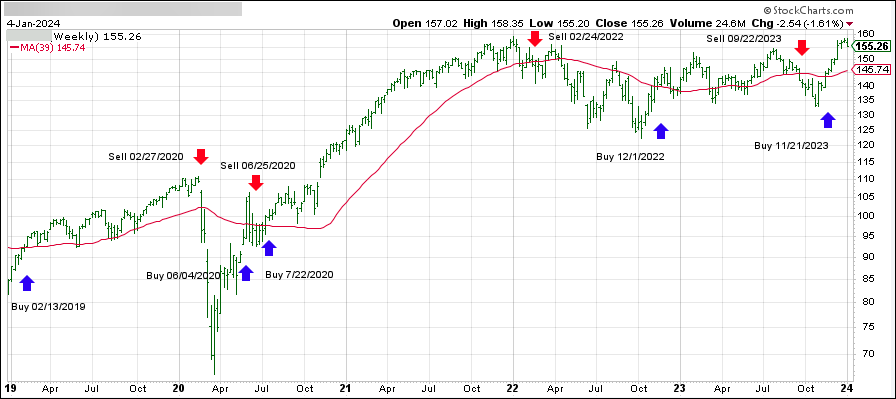
DOMESTIC EQUITY ETFs: BUY— since 11/21/2023
Click on chart to enlarge
This is our main compass, the Domestic Trend Tracking Index (TTI-green line in the above chart). It has broken above its long-term trend line (red) by +6.80% and is in “Buy” mode as posted.

