
ETF Tracker StatSheet
You can view the latest version here.
NO TREATS FOR THE BULLS: THE MARKETS ENDED SEPTEMBER AND Q3 IN THE RED
- Moving the markets
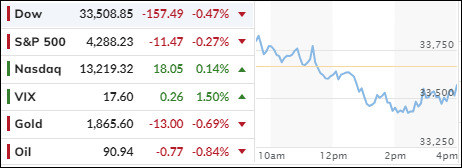
The markets started Friday on a high note, thanks to the latest inflation data that made investors feel optimistic. But the good mood didn’t last long, as the major indexes dumped their gains and ended the month and quarter in the red. Talk about a mood swing!
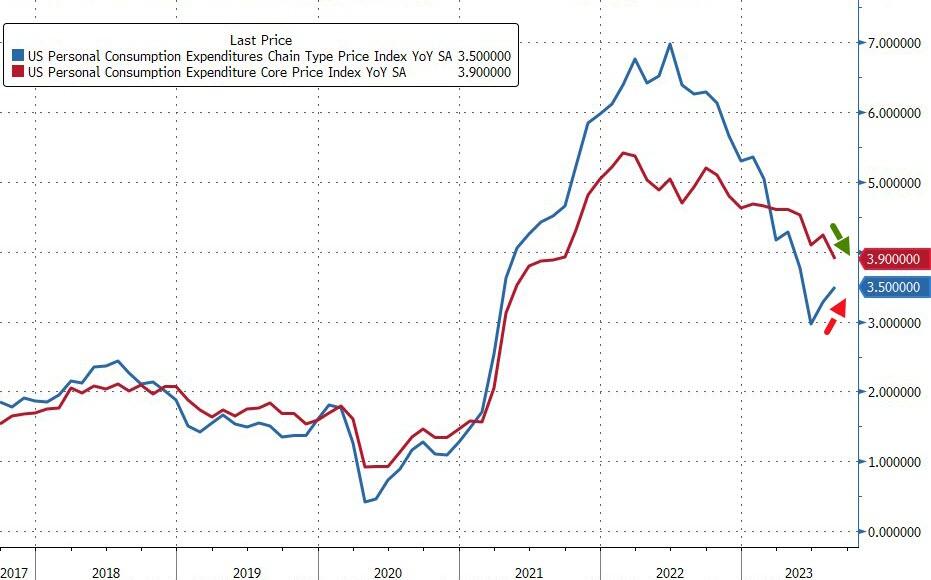
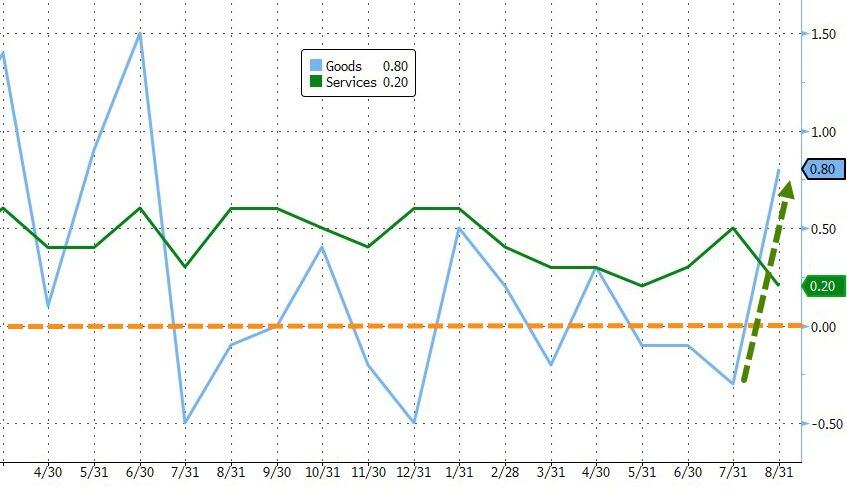
Friday’s personal consumption expenditures price index reading, which is the Fed’s favorite way to measure inflation, gave the market a boost. The core PCE, which excludes the prices of things that actually matter, like food and energy, rose 0.1% in August and 3.9% year over year. But after three months of deflation, the prices of goods came back with a bang and jumped in August (the highest increase since June 2022). Looks like someone had a growth spurt!
The market suffered big losses for the trading month and quarter, both of which ended today. The S&P 500 finished the month down 5% and the quarter lower by 3.6%. The Nasdaq Composite was off 5% in September, and down 3.3% for the quarter. Both had their worst quarters this year and since Q3 2022. Ouch!
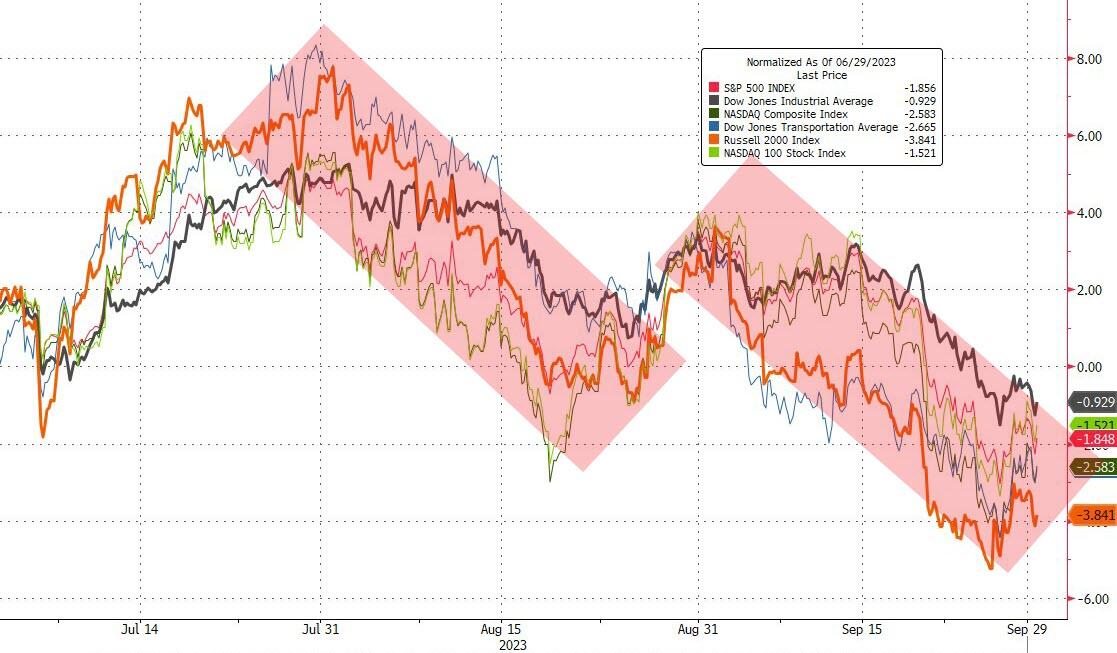
Stocks have fallen too much and too fast during this seasonally volatile time of the year, driven by a long list of worries. The market only a few months ago was worry free, believing that the Fed could land the plane smoothly. But now the market is freaking out, as traders question the economic outlook. And to make things worse, traders also feared a government shutdown this weekend, as House GOP leaders failed to pass a short-term spending bill today. Way to go, guys!
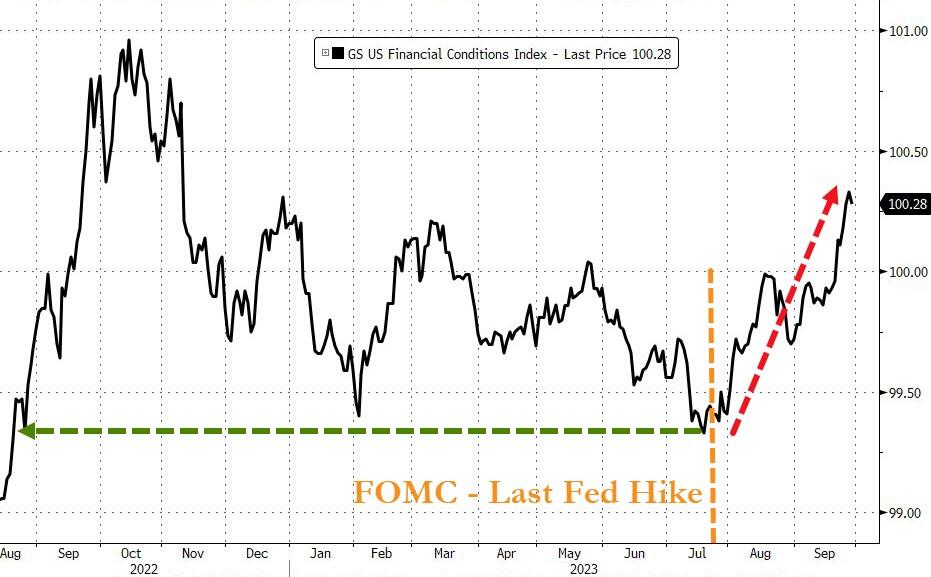
The past three months was the first quarter of tightening financial conditions since 2022, with September being the biggest monthly squeeze in a year. And why is that? It’s simple: the low came right after the “alleged” last Fed hike (July 26). I find that hilarious.
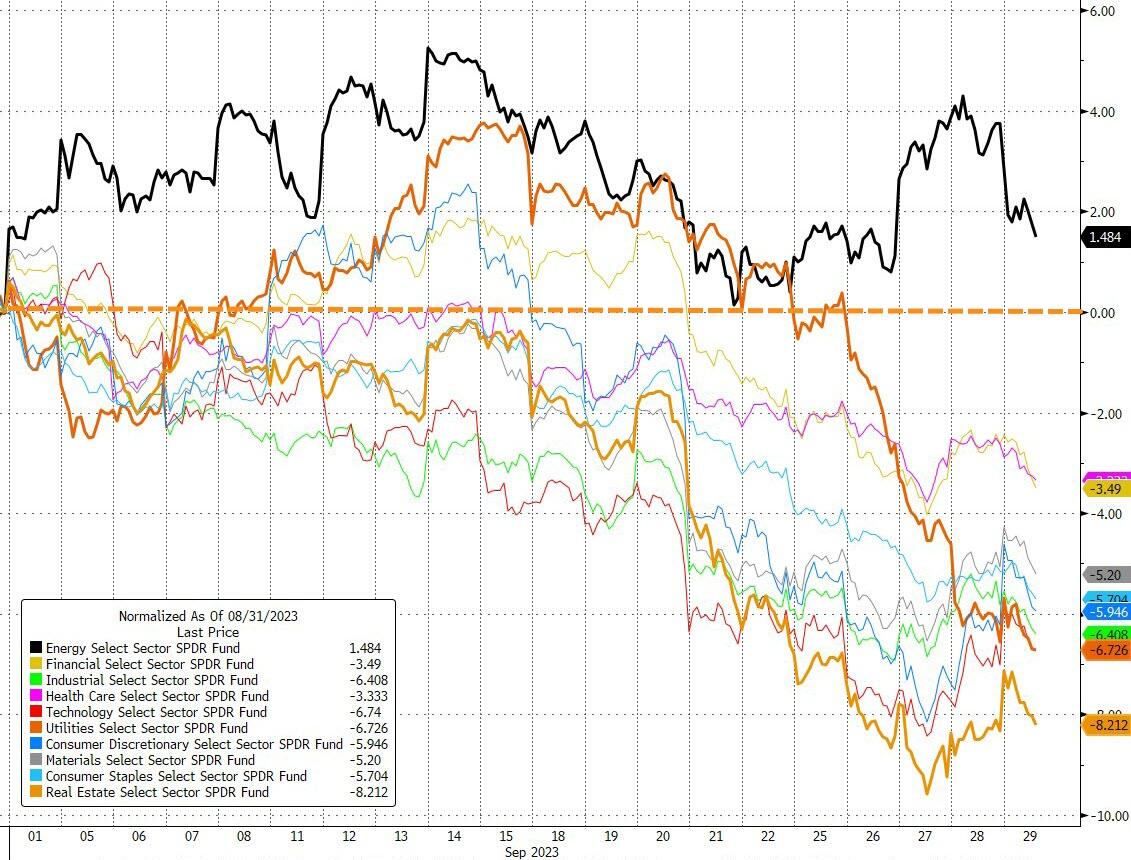
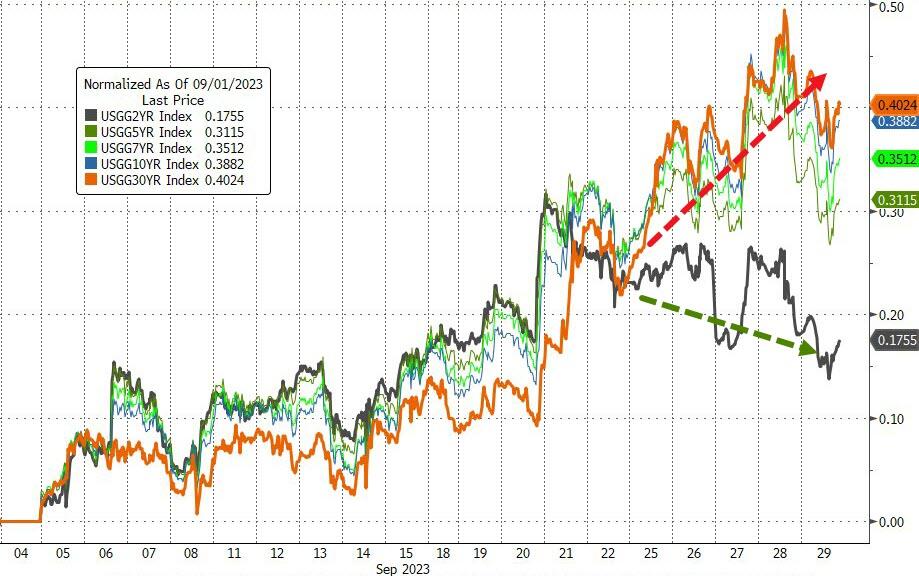
While Q3 was bad, September was even worse, with Energy being the only sector that stayed green. Every other sector got hammered. The bond market was a massacre, not just in the US but globally as well.
ZeroHedge summed it up like this:
- 5y US yield highest since 2007
- 10y US yield highest since 2007
- 30y US yield highest since 2010
- 10y German yield highest since 2011
- Japan 10y highest since 2013
- Japan 20y highest since 2014
- Japan 30y highest since 2013
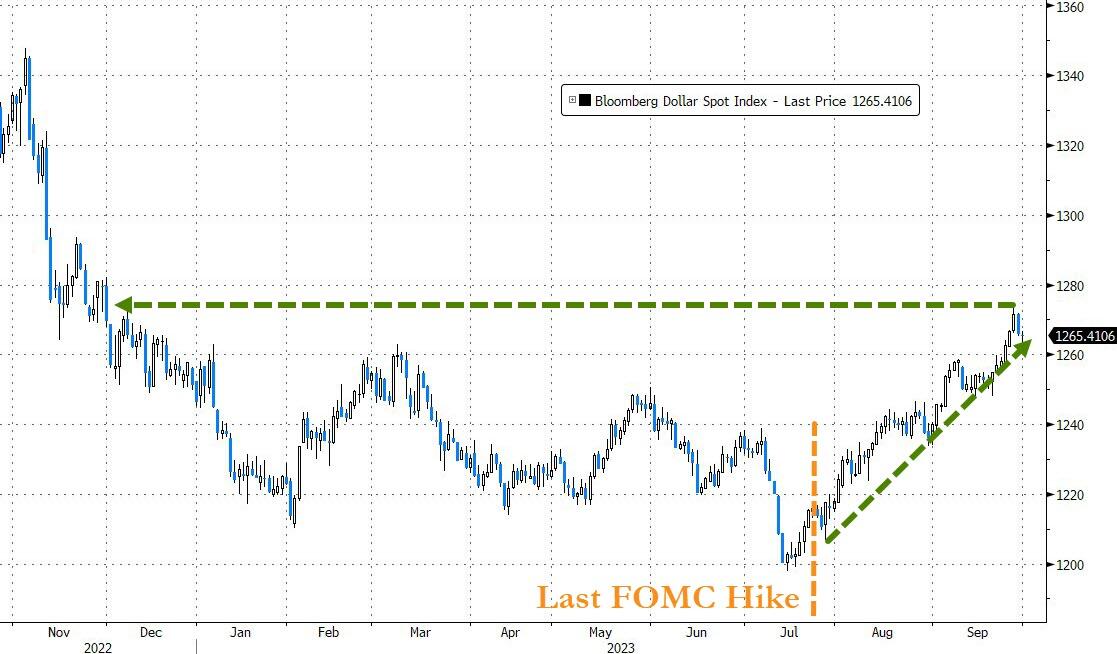
The dollar rallied for the second straight month in September to its highest close since Nov 2022. Q3 was the dollar’s first positive quarter since 2022.
Finally, the disconnect between real yields and the S&P 500’s P/E valuation came into the month at a noted extreme. And while the index dropped ~5%, real yields rose too. This chart explains it.
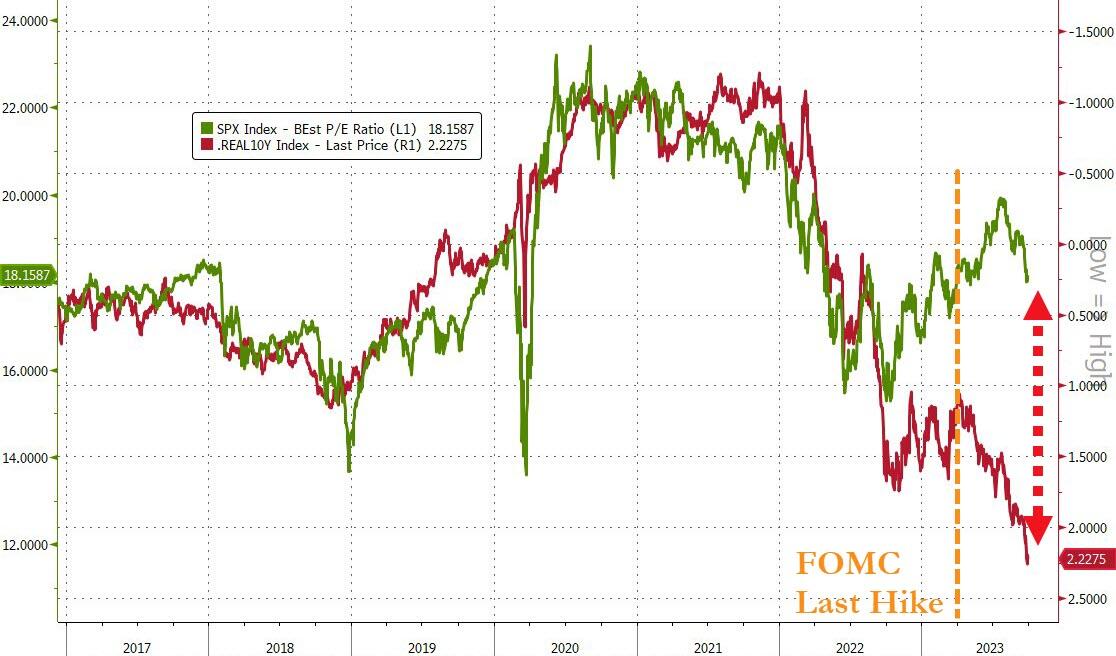
Will the bulls be able to turn things around as we enter red October? Or will they be spooked by more tricks than treats?
2. “Buy” Cycle (12/1/22 to 9/21/2023)
The current Domestic Buy cycle began on December 1, 2022, and concluded on September 21, 2023, at which time we liquidated our holdings in “broadly diversified domestic ETFs and mutual funds”.
Although our International TTI has experienced a slight dip below its long-term trend line, it was not significant enough to signal the end of that cycle. However, given the potential “Sell” on the horizon, I do not recommend considering this arena as an investment choice.
We have kept some selected sector funds. To make informed investment decisions based on your risk tolerance, you can refer to my Thursday StatSheet and Saturday’s “ETFs on the Cutline” report.
Considering the current turbulent times, it is prudent for conservative investors to remain in money market funds—not bond funds—on the sidelines.
3. Trend Tracking Indexes (TTIs)
The markets fluctuated throughout the day and closed with a small loss.
Our Domestic Trend Tracking index (TTI) fell further into negative territory, indicating a continued bearish trend. The international TTI also dropped slightly below the zero line, but I’m waiting for more evidence of a downward trend before ending that current “Buy” cycle.
This is how we closed 09/29/2023:
Domestic TTI: -2.61% below its M/A (prior close –2.30%)—Sell signal effective 9/22/2023.
International TTI: -0.36% below its M/A (prior close +0.11%)—Buy signal effective 12/1/2022.
All linked charts above are courtesy of Bloomberg via ZeroHedge.
———————————————————-
WOULD YOU LIKE TO HAVE YOUR INVESTMENTS PROFESSIONALLY MANAGED?
Do you have the time to follow our investment plans yourself? If you are a busy professional who would like to have his portfolio managed using our methodology, please contact me directly to get more details.
Contact Ulli