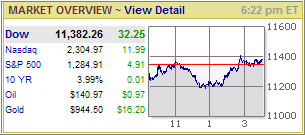
 By now you must have heard that the just ended month of June will go on record as the worst June since 1930. The major indexes declined sharply with the broad S&P; 500 surrendering some 8.6%.
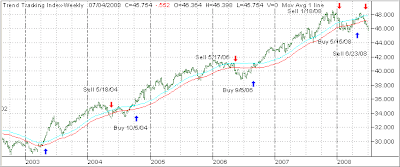
Half way trough the month, our domestic sell signal kicked in and pulled us to the sidelines before the markets fell off a cliff during the last couple of weeks. Our newly established hedged positions worked out well by gaining while the major averages were losing.
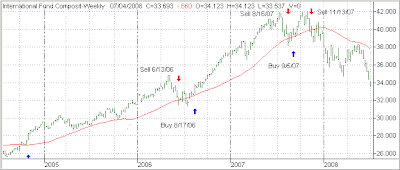
As of yesterday, and closing out the month, our Trend Tracking Indexes (TTIs) have remained below their long-term trend lines as follows:
Domestic TTI: -1.54%
International TTI: -10.15%
With a questionable earnings season upon us, along with constant disaster for financial stocks and ever climbing oil prices, what’s next? For a different viewpoint, Bill Fleckenstein wrote an interesting article called “The End of the Super Bubble.” Here are some highlights:
There is a budding realization that the housing bubble’s collapse will be more difficult than the masses and Wall Street had believed. You could see this last week as the market moved back toward the lowest levels since the collapse began last fall.
It’s now obvious that this is a problem not only for the consumer but for the financial system itself, which is in dire straits as it tries to deleverage, thereby compounding the problem.
…
For quite a while, many believed that because sovereign wealth funds were deemed to be flush with money, the banks and brokers could just grab some capital from overseas investors and cash-rich nations and go back to doing what they had done before. That has clearly turned out not to be the case.
However, leverage is quite capable of creating the illusion of liquidity. Thus what many had seen as excess liquidity was simply massive leverage, which is now being unwound. (The surfeit of savings, which is what “liquidity” alludes to, never existed.)
All of these problems trace their roots to Alan Greenspan’s years at the head of the Federal Reserve.
What began as small bailouts along the way ended with the blowoff of the stock bubble in March 2000. In an attempt to ease the effects of the bubble’s collapse, interest rates were taken to the absurdly low level of 1% and held there far too long. That engendered a housing bubble, which was nourished by the abdication of lending standards in the banking system — as securitization, spearheaded and championed by Greenspan himself, and deregulation of the banking system were thought to be the solutions to any imbalances.
Meanwhile, the aftermath of this housing/credit bubble is far different from that of the stock bubble. Now the lending institutions are swimming in bad debts. Homeowners have mortgages they can’t pay, just as the assets (houses) behind those debts are dropping in price.
As if that weren’t enough, consumers’ paychecks are eroding, thanks to galloping inflation created by the money printing that fomented the housing bubble (and by the credit that Greenspan’s replacement, Ben Bernanke, has subsequently thrown in to ameliorate the aftermath).
The truly sad part is that this outcome was foreseeable.It was possible to anticipate a catastrophe of such dimensions even when the housing boom was still in full swing. Unfortunately, the very institution that had the regulatory authority to supervise the banking system was the one leading the cheering — namely the Fed, in the form of Greenspan. (That was sort of like putting a bartender in charge of adjudicating disputes over breathalyzer readings.)
The collapse of the housing bubble is taking the economy with it and pressuring the stock market as well. Thus we will have all three markets feeding on each other as each deteriorates.
Unfortunately, the Fed is going to be faced with a Hobson’s choice: trying to respond to that triple threat while its hands are tied, to some degree, by inflation. When push comes to shove, the Fed will choose lowering interest rates over fighting inflation, but it won’t matter.
In his latest book, “The New Paradigm for Financial Markets: The Credit Crash of 2008 and What It Means,” George Soros makes the case that we are witnessing the end of a 25-year superbubble.
I certainly agree with his observation and would note that the time frame of this superbubble roughly approximates the career of Alan Greenspan, who in my opinion was responsible for its creation — and the enormous pain caused by its collapse.
I have to agree with Bill’s assessment, which pretty much throws a cloud on the future especially if you are looking for a place to put your money. I think that we’re still at a point where taking an outright short position could be hazardous to your financial health. Even though we’re below the long-term trend lines, violent blow off rallies ala 2000 could happen at anytime.
This is why I have done a lot of work designing simple hedge positions, which work well with mutual funds and ETFs (IRA and brokerage accounts) along with our Trend Tracking approach. It allows you to make money whether the markets rally or sink to lower levels. This type of a hedge smoothes out portfolio fluctuations and offers you continued market exposure, although much more conservatively.
Unfortunately, most 401k plans do not have the necessary fund choices available for hedging, so being on the sidelines in money market is your safest bet during these times of great uncertainty.


