

- Moving the market
Today’s better-than-expected CPI report gave the major indexes a positive start, with all of them opening higher and maintaining that trajectory throughout the session.
The Consumer Price Index increased by 0.2% for the month, resulting in an annual inflation rate of 2.8%, which is lower than the estimated 0.3% monthly increase and 2.9% annual rate.
The Core CPI, which excludes food and energy prices, also rose by 0.2% for the month and 3.1% over the past 12 months, both figures coming in below expectations.
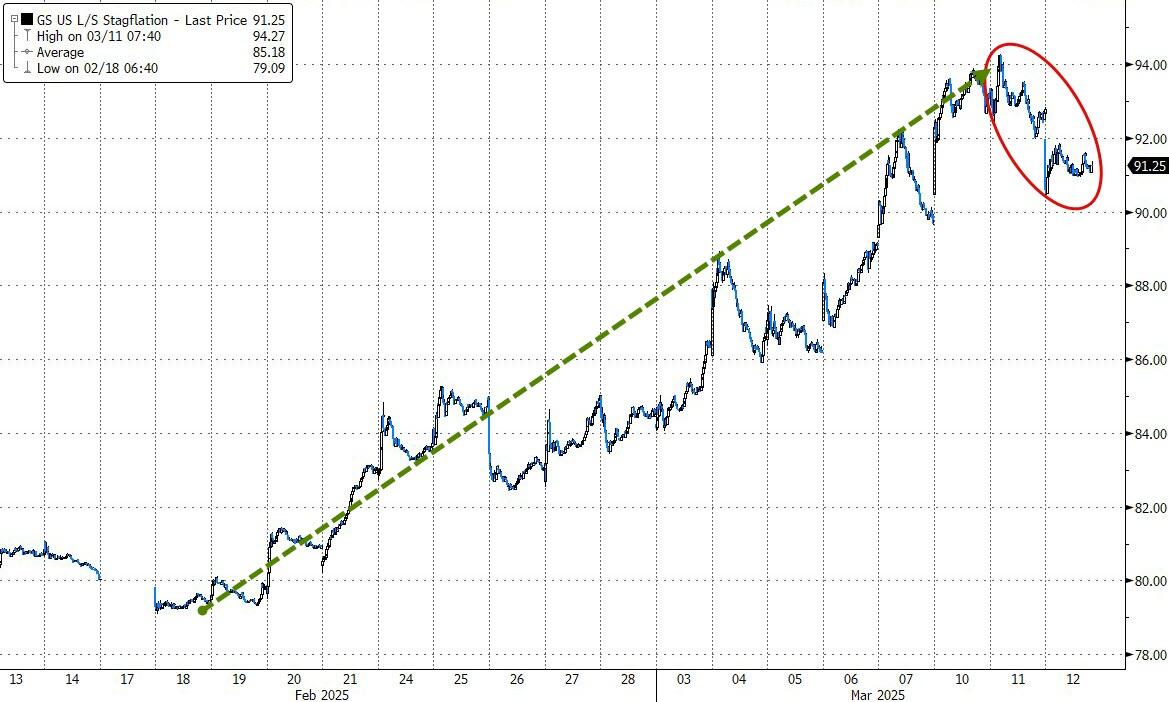
This data alleviated recent fears, at least temporarily, that Trump’s trade policies would lead to higher inflation and slower growth, potentially causing “stagflation.” Traders are now considering the possibility that this outcome might give the Federal Reserve some room to cut interest rates later this year.
Looking deeper, there is a notable divergence as the widely followed S&P 500 index is outperforming its equal-weight counterpart, indicating that today’s rally was not broad-based.
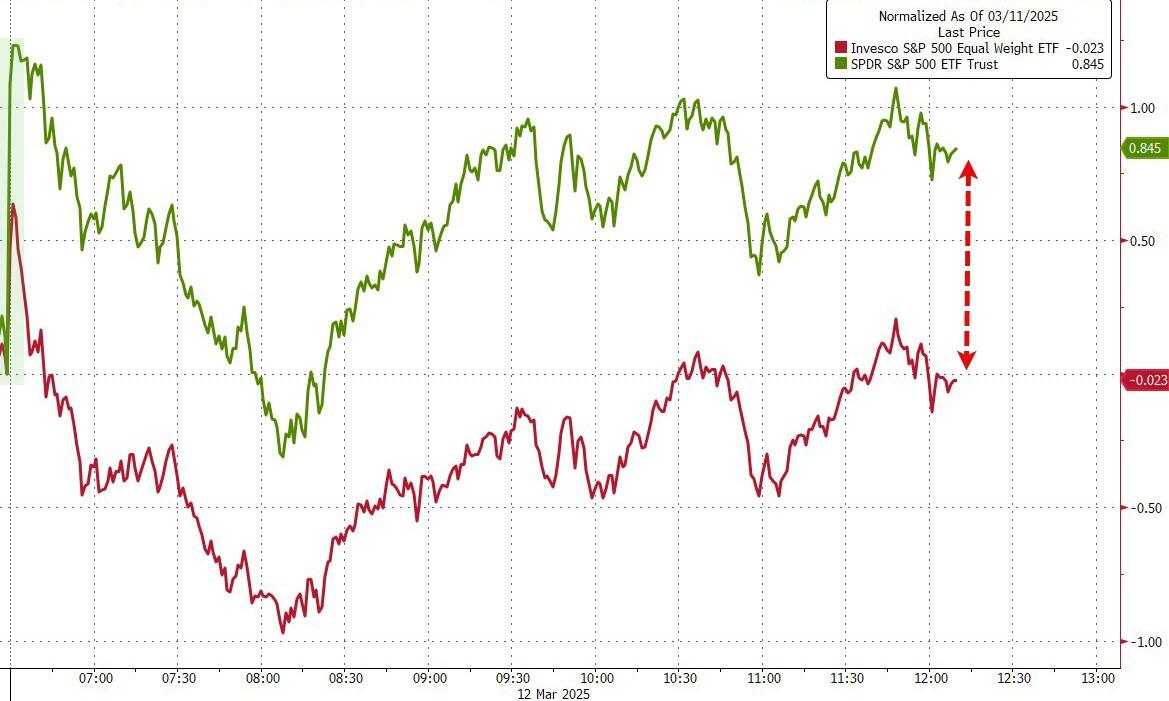
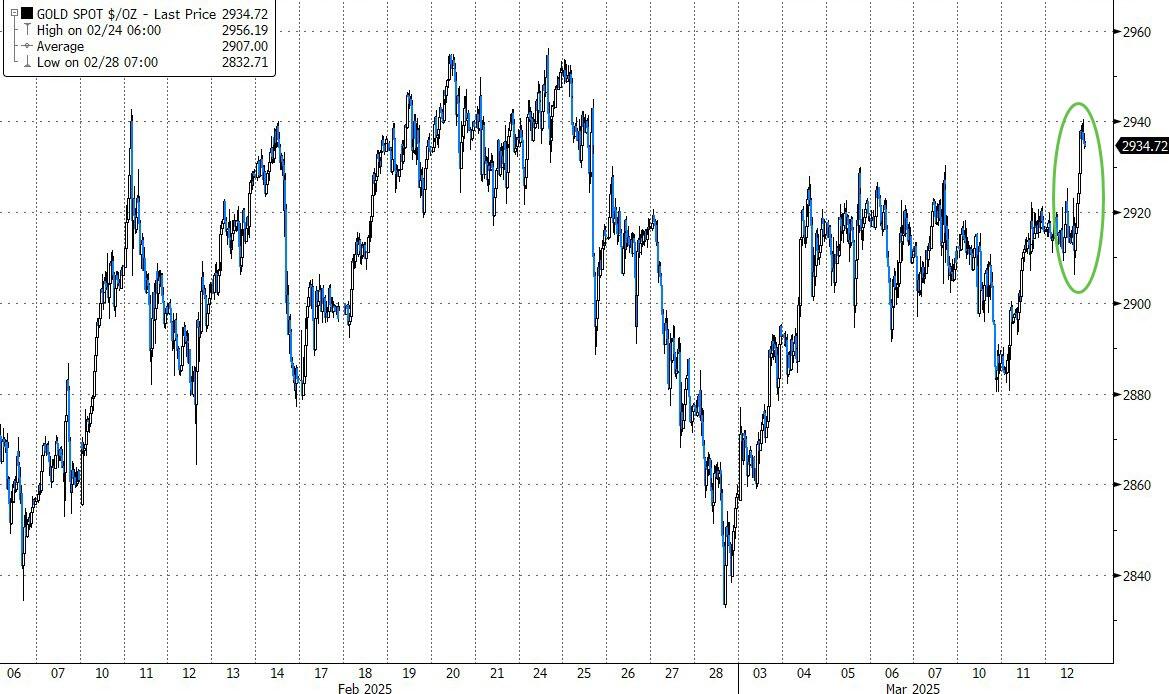
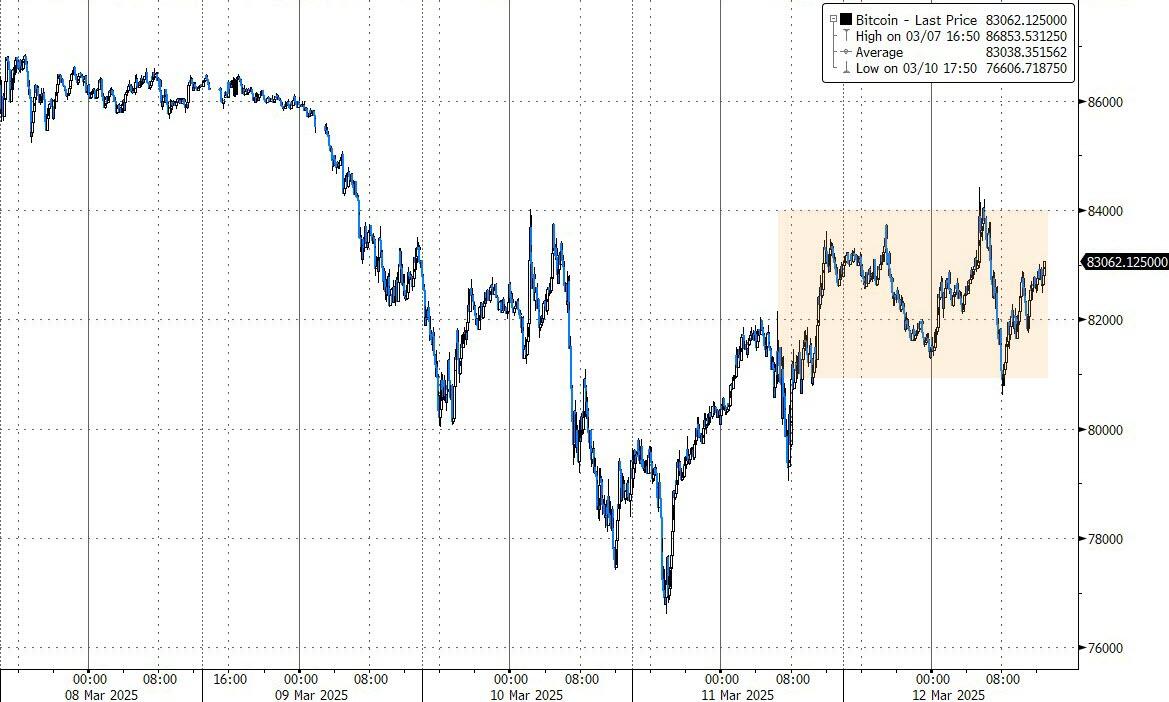
Bond yields edged higher, as did the dollar, but its weakness during afternoon trading pushed gold to near-record highs. Bitcoin remained rangebound and closed roughly unchanged.
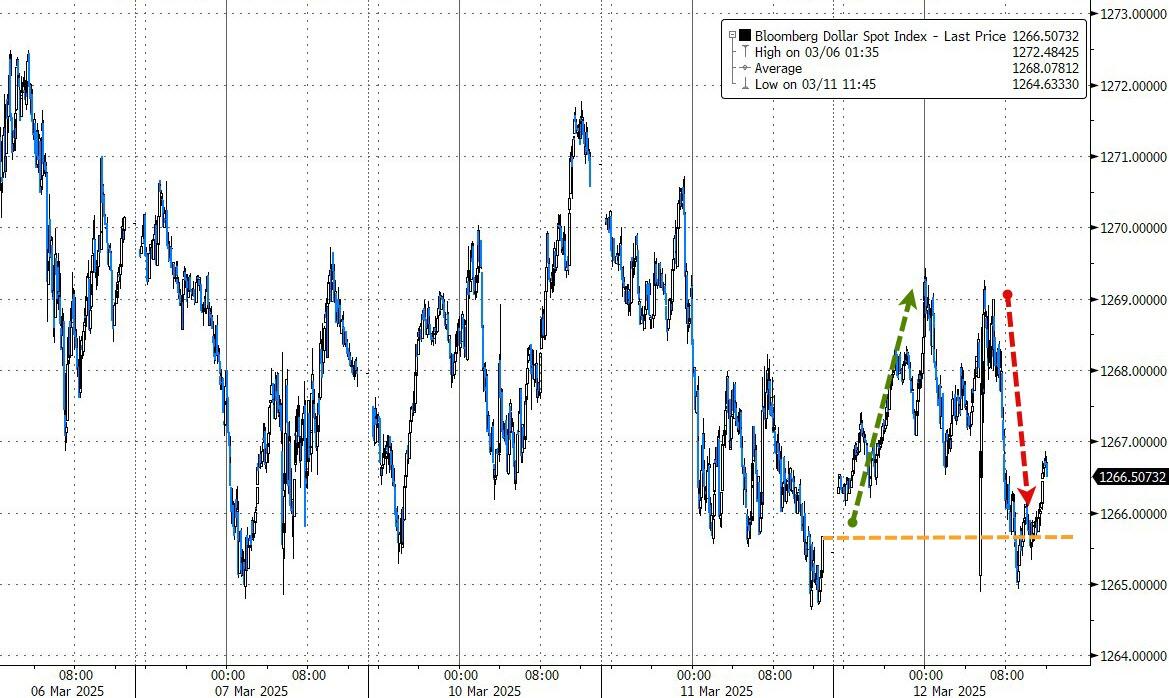
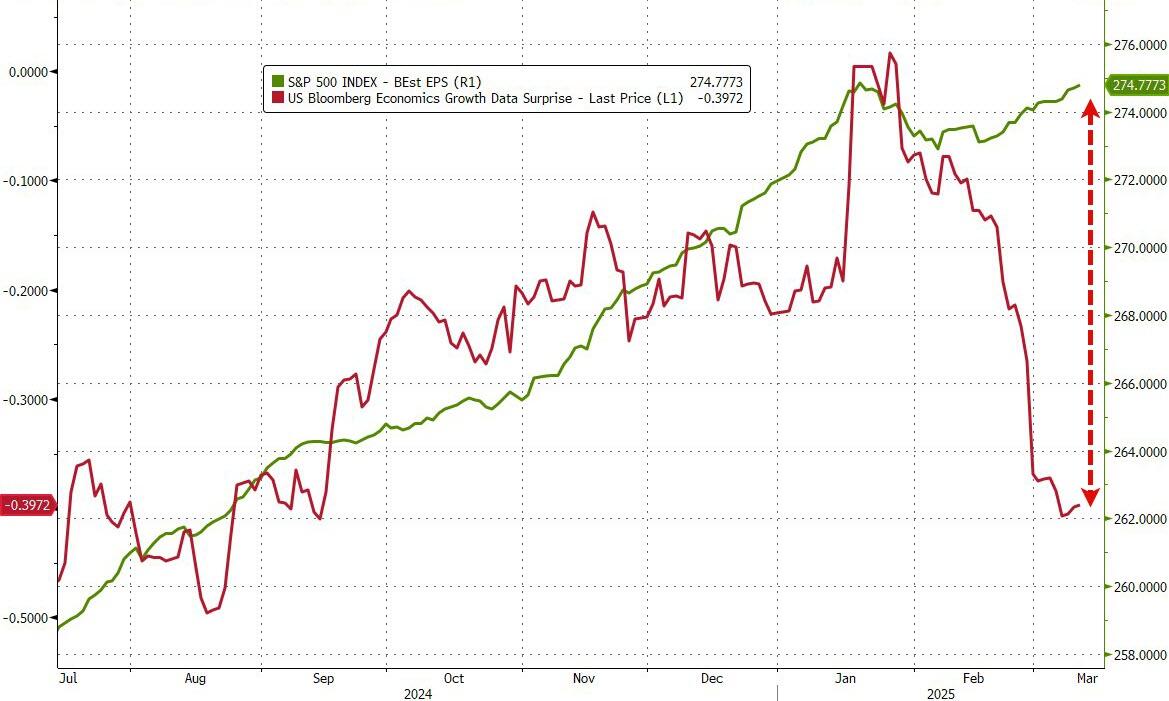
Another divergence that could threaten equities is the S&P 500’s apparent disconnect from economic data points.
2. Current “Buy” Cycles (effective 11/21/2023)
Our Trend Tracking Indexes (TTIs) have both crossed their trend lines with enough strength to trigger new “Buy” signals. That means, Tuesday, 11/21/2023, was the official date for these signals.
If you want to follow our strategy, you should first decide how much you want to invest based on your risk tolerance (percentage of allocation). Then, you should check my Thursday StatSheet and Saturday’s “ETFs on the Cutline” report for suitable ETFs to buy.
3. Trend Tracking Indexes (TTIs)
The major indexes experienced some volatility today, but the S&P 500 and Nasdaq managed to close in the green.
Interestingly, both indexes are moving in the opposite direction of my domestic TTI, which serves as a directional indicator for equities. This suggests that the market bounces are narrow and not broad-based. Typically, the TTI aligns with the overall direction of the major indexes, so this divergence is unusual.
Despite the TTI breaking below its trend line, our current domestic holdings are still gaining value. This situation is unlikely to last, but for now, we find ourselves in this peculiar scenario.
It’s only been three days since the TTI entered bear market territory, but we are approaching the point where I will consider ending this Buy cycle.
This is how we closed 03/12/2025:
Domestic TTI: -2.41% below its M/A (prior close -1.95%)—Buy signal effective 11/21/2023.
International TTI: +3.84% above its M/A (prior close +3.52%)—Buy signal effective 11/21/2023.
All linked charts above are courtesy of Bloomberg via ZeroHedge.
———————————————————-
WOULD YOU LIKE TO HAVE YOUR INVESTMENTS PROFESSIONALLY MANAGED?
Do you have the time to follow our investment plans yourself? If you are a busy professional who would like to have his portfolio managed using our methodology, please contact me directly to get more details.
Contact Ulli