

- Moving the market
Last week’s selling pressure continued this morning and intensified in the afternoon, dragging down the major indexes.
Traders were fixated on Trump’s comments about a possible economic slowdown and the potential for a recession following the implementation of US tariffs, indicating the economy is entering “a period of transition.”
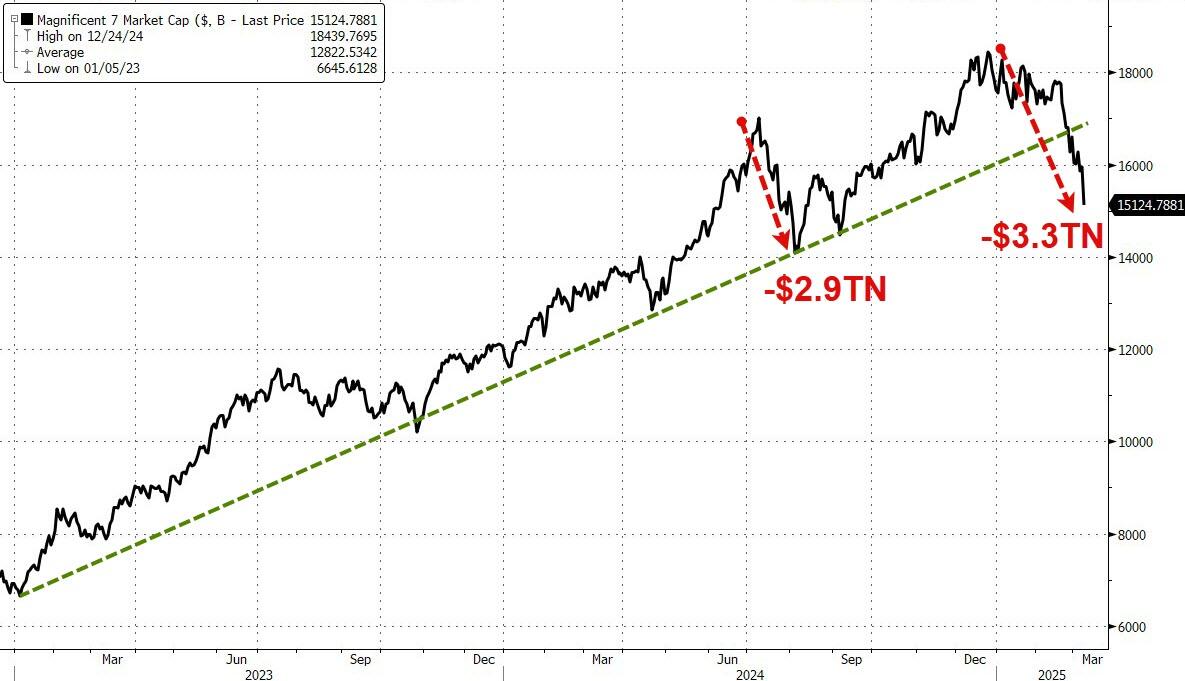
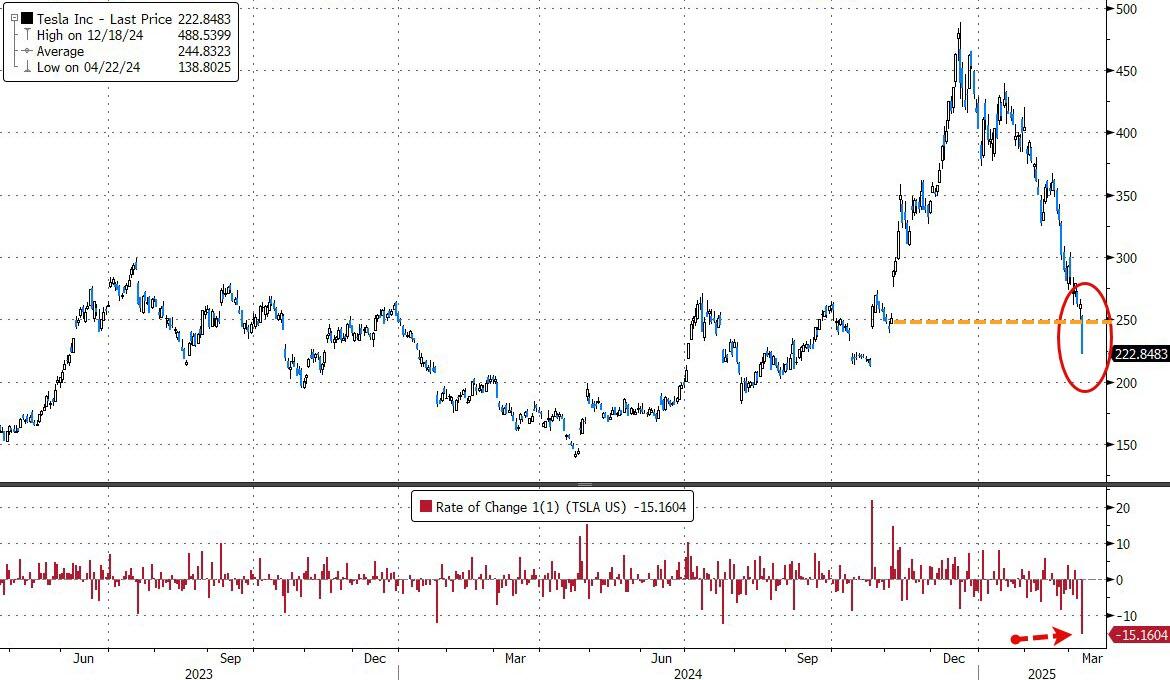
The tech-heavy Nasdaq was hit the hardest, with the Mag7 basket experiencing its largest overall market cap decline ever. Notable losses included Tesla (-15%), Alphabet (-4%), Nvidia (-5%), and Meta (-4%), with Meta erasing its 2025 gains.
The recession scenario has been looming over the markets for some time, as tariffs can drive prices higher, increasing inflationary trends and causing the Fed to hesitate on much-anticipated rate cuts. These rate cuts are crucial drivers of any bull market.
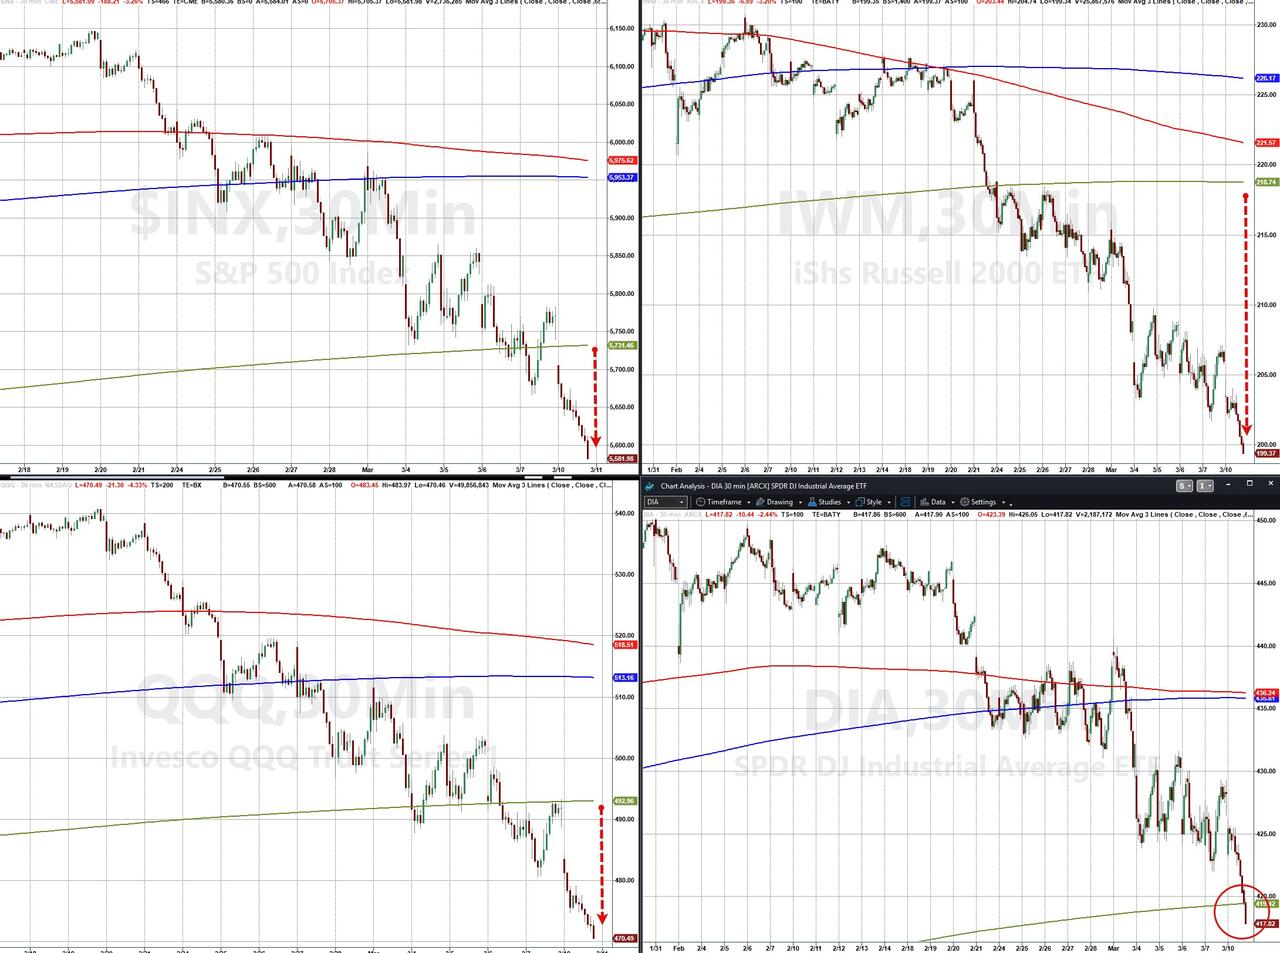
Critical data points are on the agenda this week, highlighted by Wednesday’s CPI and Thursday’s PPI reports. While the major indexes managed a small bounce into the close, the damage was done, with all technical support levels broken. The Nasdaq led the decline, registering its biggest daily drop since September 2022.
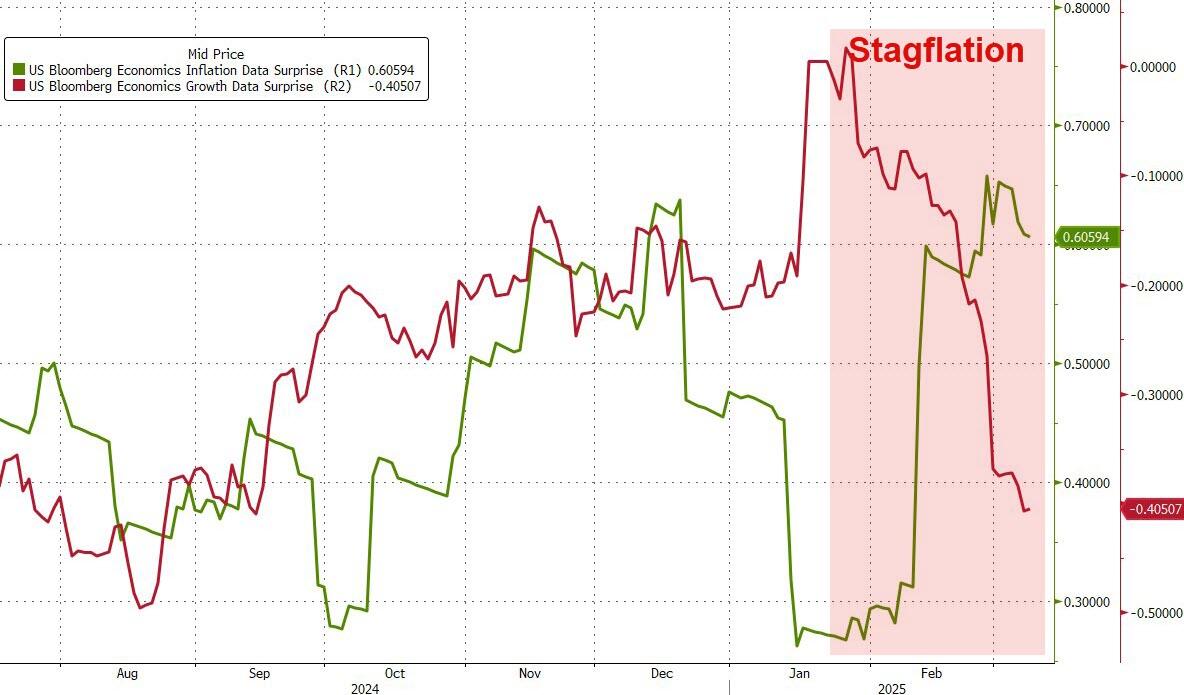
As ZH pointed out, the Fed is unlikely to intervene, as the issue is not just a lack of growth but the reemergence of inflation, bringing “Stagflation” back to the forefront.
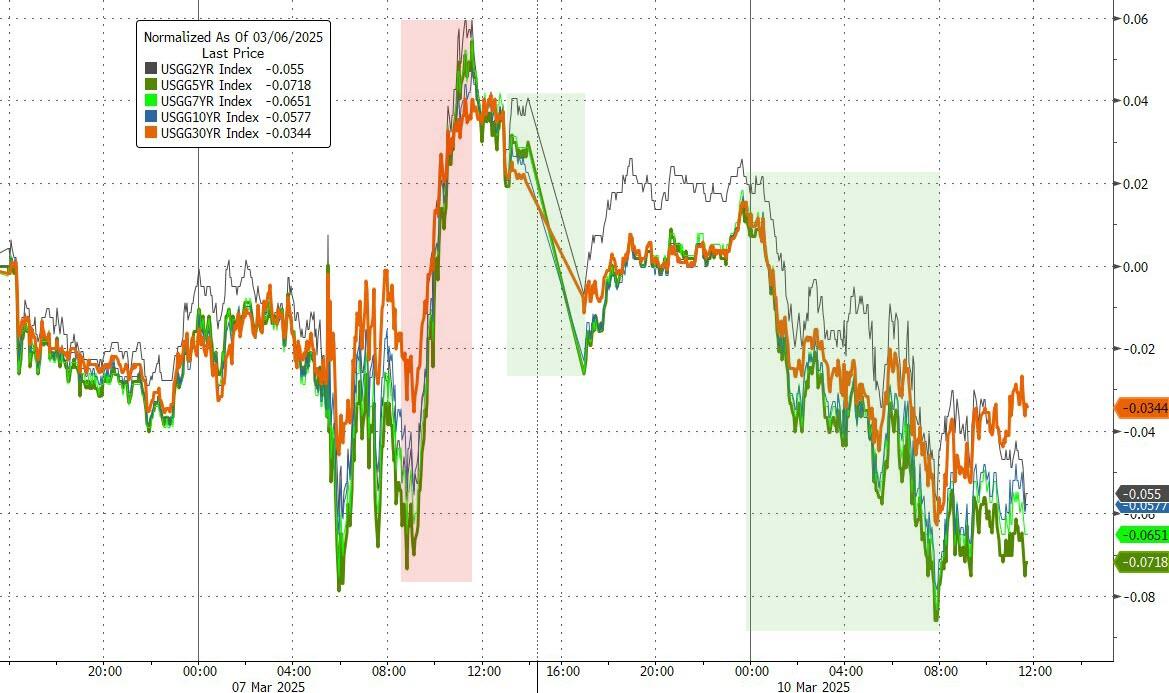
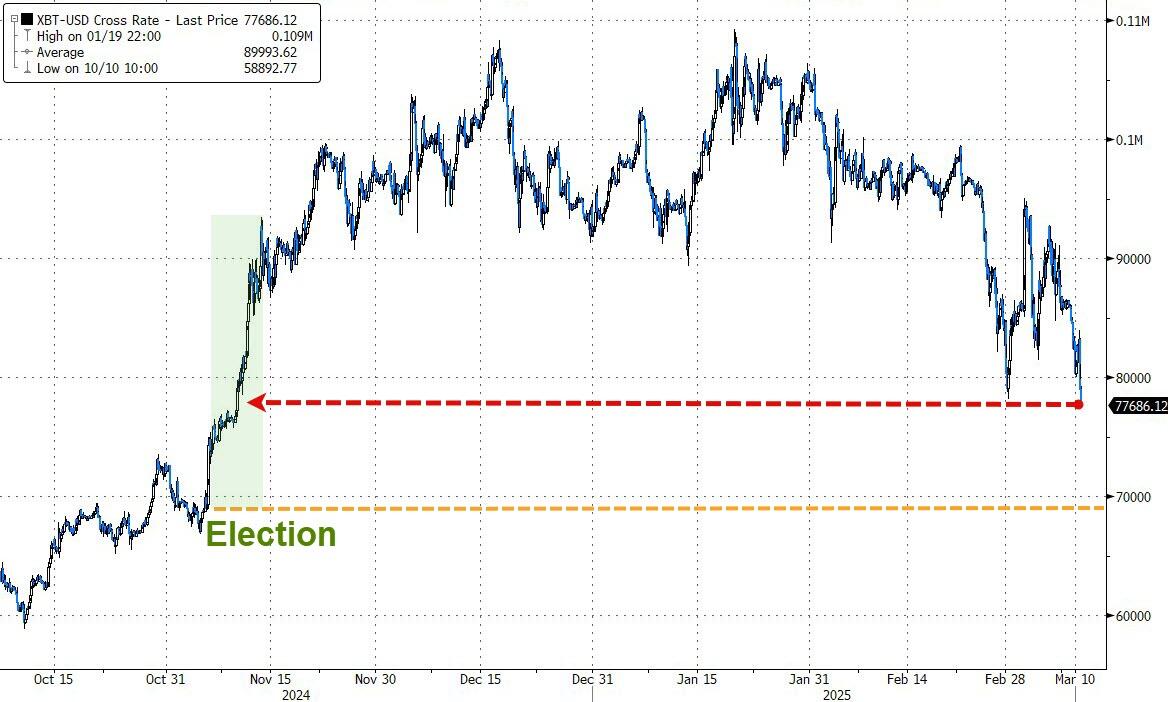
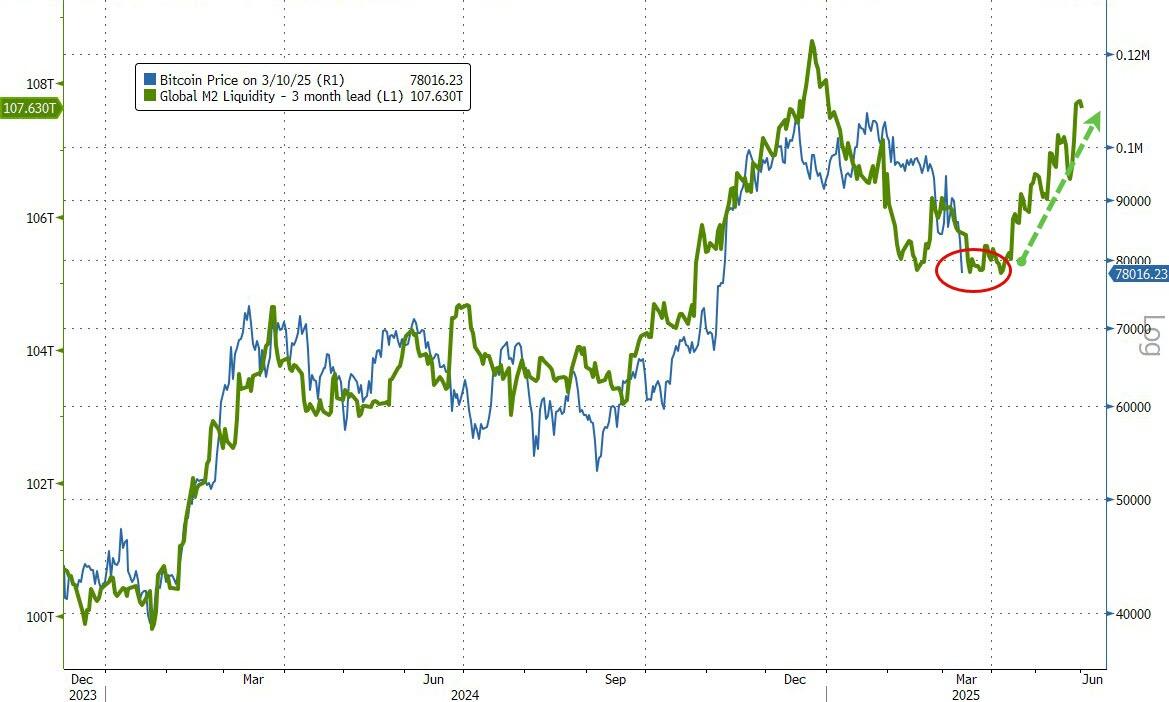
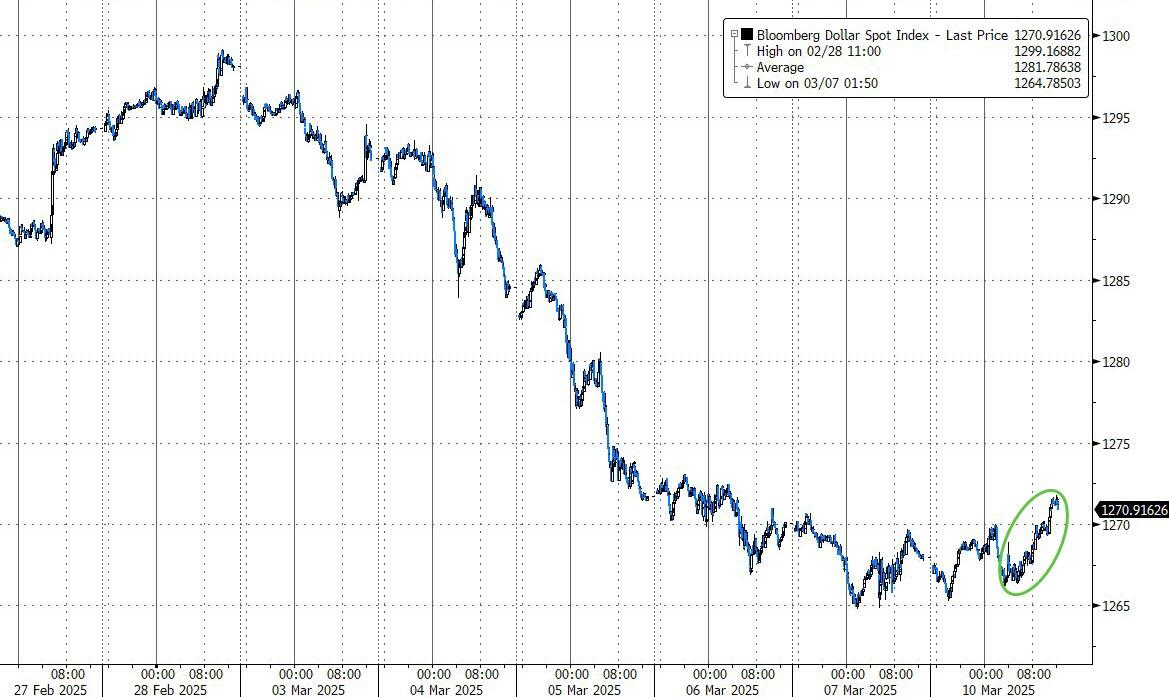
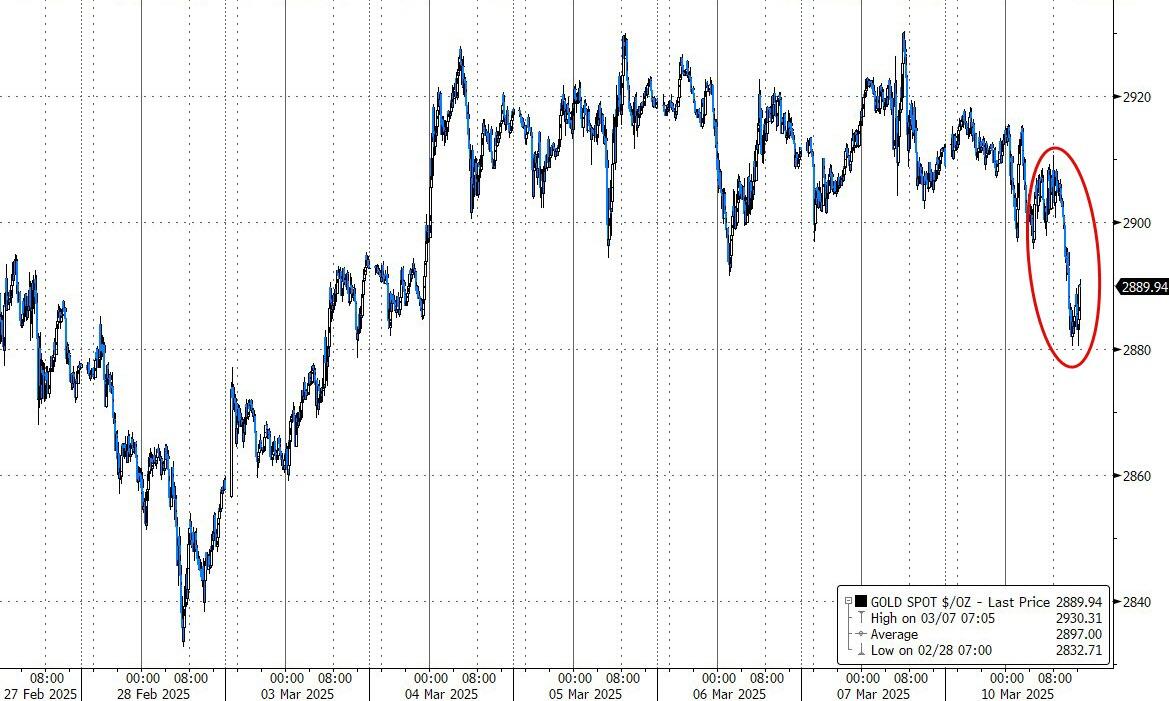
Bond yields tumbled, Bitcoin headed lower and appears to be in sync with global liquidity, which could lead to the next leg higher if history is any indication. The dollar edged higher, while gold dropped slightly below its $2,900 level.
Our main directional indicator, the TTI, also dipped below its long-term trend line, signaling a shift from bullish to bearish sentiment. For more details, please see section 3 below.
2. Current “Buy” Cycles (effective 11/21/2023)
Our Trend Tracking Indexes (TTIs) have both crossed their trend lines with enough strength to trigger new “Buy” signals. That means, Tuesday, 11/21/2023, was the official date for these signals.
If you want to follow our strategy, you should first decide how much you want to invest based on your risk tolerance (percentage of allocation). Then, you should check my Thursday StatSheet and Saturday’s “ETFs on the Cutline” report for suitable ETFs to buy.
3. Trend Tracking Indexes (TTIs)
Equities opened in the red and continued to decline throughout the session, though they managed to close above their day’s lows.
Despite this slight recovery, all major indexes broke through their support levels. Our domestic TTI also dipped into bearish territory, albeit by a modest -0.62%.
As mentioned previously, I prefer to see sustained movement below this threshold before issuing a comprehensive “Sell” signal for “broadly diversified domestic equity ETFs and mutual funds.” This approach helps avoid a potential whip-saw effect, where a “sell” signal is quickly followed by a “buy” signal due to a sudden price rebound.
In my advisory practice, I have already reduced some clients’ more volatile positions over the past week, as their trailing sell stops were triggered.
This is how we closed 03/10/2025:
Domestic TTI: -0.62% below its M/A (prior close +0.80%)—Buy signal effective 11/21/2023.
International TTI: +4.68% above its M/A (prior close +6.42%)—Buy signal effective 11/21/2023.
All linked charts above are courtesy of Bloomberg via ZeroHedge.
———————————————————-
WOULD YOU LIKE TO HAVE YOUR INVESTMENTS PROFESSIONALLY MANAGED?
Do you have the time to follow our investment plans yourself? If you are a busy professional who would like to have his portfolio managed using our methodology, please contact me directly to get more details.
Contact Ulli