Special No Load Fund/ETF Tracker Update For 8/16/2007

Ulli Uncategorized Contact

Many people like to travel to places like Las Vegas for life changing experiences or to live on the edge—at least for a few days. If you have that tendency as well, you were in luck this week. All you had to do is turn on the financial markets and you would have gotten more than your monies worth of excitement.

Especially today proved again that using intra day stop loss points is simply not a good idea as I posted about before. The Dow was down over 340 points at one time but a last hour rally along with short covering turned this potential disaster day into a non-event, if you go by closing figures.

Even in my post this morning, I could not see a recovery from my vantage point. Well, that tells you that assumptions should simply not be made. I also mentioned that the closing of the gap can sometimes signal a turn in market direction. While it’s too early to tell, it now appears to be at least a possibility.

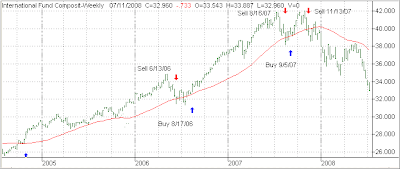
Today’s effect on our Trend Tracking Indexes (TTIs) was very small, but the domestic TTI moved back into positive territory, while the international TTI headed further south:

Domestic TTI: +0.23%
International TTI: -1.91%

As announced yesterday, I sold my last international holding, but will hang on to my remaining domestic positions subject to my sell stop or the domestic TTI’s further move below its long term trend line; whichever occurs first.

If you’ve sent me an e-mail, you’re not the only one. It will take me a few days to catch up, so please be patient.

No Load Fund/ETF Technical Analysis: The Gap Is Closed

Ulli Uncategorized Contact

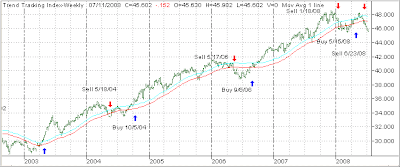
In a previous post, I had mentioned the fact that breakaway gaps, that occur on charts as a result of overly confident investing behavior, will be always be closed. That simply means a market pullback will correct prices to the downside. Here’s an enlarged version of the Trend Tracking Index (TTI) chart:


You will note that the gap (red arrow), which was created earlier in the year, has now been closed due to market weakness over the past couple of weeks. As I also pointed out at that time, this event may very well coincide with the TTI breaking through its long-term trend line, which is exactly what happened.

This puts us at a crossroads. I have seen charts, where the closing of the gap signaled a turn around in the trend back to the upside, and I’ve seen charts where heading further south was the direction of choice. In other words, no one knows for sure.

Since the TTI only broke through its trend line to the downside by -0.10% (as of 8/15/07), I will wait for further confirmation based on market activity before pulling the all-out Sell trigger and heading for the sidelines. In the meantime, I will follow my sell stop points and eliminate only those positions that have been affected.

After I wrote the above and checked today’s market, it appears that we will definitely have an all-out sell signal, unless some (unlikely) miracle turnaround pulls the major indexes out of the doldrums.

Special No Load Fund/ETF Tracker Update For 8/15/2007: Sell International Funds/ETFs

Ulli Uncategorized Contact

Yesterday’s sell off continued today in the face of a rally attempt that ended up giving the bears the upper hand.

As of today, the Trend Tracking Indexes (TTIs) are positioned in regards to their long-term trend lines as follows:

Domestic TTI: -0.10%
International TTI: -1.30%

The domestic TTI barely crossed to the downside, so the risk of a reversal back to positive territory certainly exists. I will therefore continue selling only those remaining domestic equity funds/ETFs that have dropped through their sell stop points, but will hold off with an all-out Sell until the TTI confirms its position by staying below the trend line over the next day or two.

The story is different with the International TTI, which has clearly broken through to the downside by -1.30%. This signals a Sell for all broadly diversified international equity funds, and I will liquidate the one remaining position I still have.

Should market action warrant a daily update, I will do so and hope to have it posted by 4 pm PST.

Mutual Fund/ETF Investing: Learning From The Past

Ulli Uncategorized Contact

Motley Fool featured a variety of topics in last week’s “Weekly Fund Wrap-Up.”

One of them addressed Janus Capital’s recent financial comeback. It hasn’t been front page news but Janus had suffered years of fund outflows after investors left in droves. Why? During the bear market, Janus was hit hard with losing billions of dollars in assets.

To be clear, they really lost billions of dollars of clients’ (your) money by being invested in growth companies during a bear market. Yes, they are the modern model of Buy-and Hold.

The beef I still have with them is that, when the after-hour trading scandal broke a few years ago, they were the first ones to distort the facts by supporting that timing in general causes all kinds of problems and should not be allowed when it comes to mutual fund trading. Additionally, they promoted minimum holding periods to force investors to stay with a fund family.

How do I know?

I was a Janus shareholder at the time and received communication from the president of Janus about market timing, which totally distorted the facts of the real problems uncovered in the after-hours trading scandal. That one-sided, self serving approach did not sit well with me, and I sent a letter of complaint to Attorney General Spitzer who was making a name for himself by trying to clean up Wall Street.

Why bring it up now? My point is that the Janus Company and their funds maybe on their way back towards the spotlight (because investors have short memories), but don’t be fooled into complacency; when the next bear market strikes, it will be deja vous all over again.

Special No Load Fund/ETF Tracker Update For 8/14/2007

Ulli Uncategorized Contact

Another steep sell off has moved our Trend Tracking Indexes (TTIs) within striking distance of an all out Sell signal.

As of today, the TTIs are positioned in regards to their long-term trend lines as follows:

Domestic TTI: +0.87%
International TTI: +0.34%

Over the past few weeks, I have been liquidating those holdings that have triggered our sell stop points, and I will eliminate a few more tomorrow. My guess is that by the time we receive an all out Sell signal, we will have moved most of our assets to the safety of the money market accounts.

With the subprime fallout taking more prisoners almost daily, interest sensitive instruments like tax-free ETFs have been shook up as well. It seems that there currently is no orientation that is exempt from catching the down draft. I have started and will continue to liquidate those positions that have performed the worst.

If necessary, I will post more updates after the close of the market on a daily basis.

No Load Mutual Fund/ETF Investing: Staying With The Top Performers

Ulli Uncategorized Contact

A recent article in the WSJ talked about the fact that larger stocks are finally starting to take the lead in regards to performance when compared to small cap stocks.

“Megacaps,” with a stock market value of at least $50 billion, have picked up speed this year through July. For that period, the Russell 1000 Index, which includes the largest 1000 U.S. stocks, had gained 3.9% compared to a decline of 0.8% of the Russell 2000 Index.

While this maybe news to many investors, it shouldn’t be to you, if you follow our weekly StatSheet. There you can easily spot those orientations with are performing better than others. The article fails to point out that Mid-Cap Growth stocks purchased via ETFs have been near the top of the list and have outperformed most large caps.

My point is that making the latest StatSheet your weekly companion can pay big dividends when it comes to spotting trends. It does not mean, however, that you should constantly adjust your portfolio. What it does mean, is that you should adjust your holdings when an orientation is obviously slipping towards the bottom of the list.