
- Moving the markets
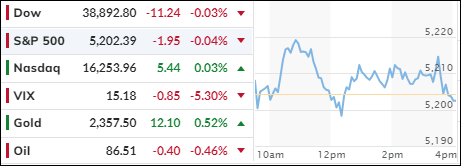
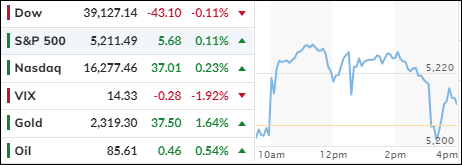
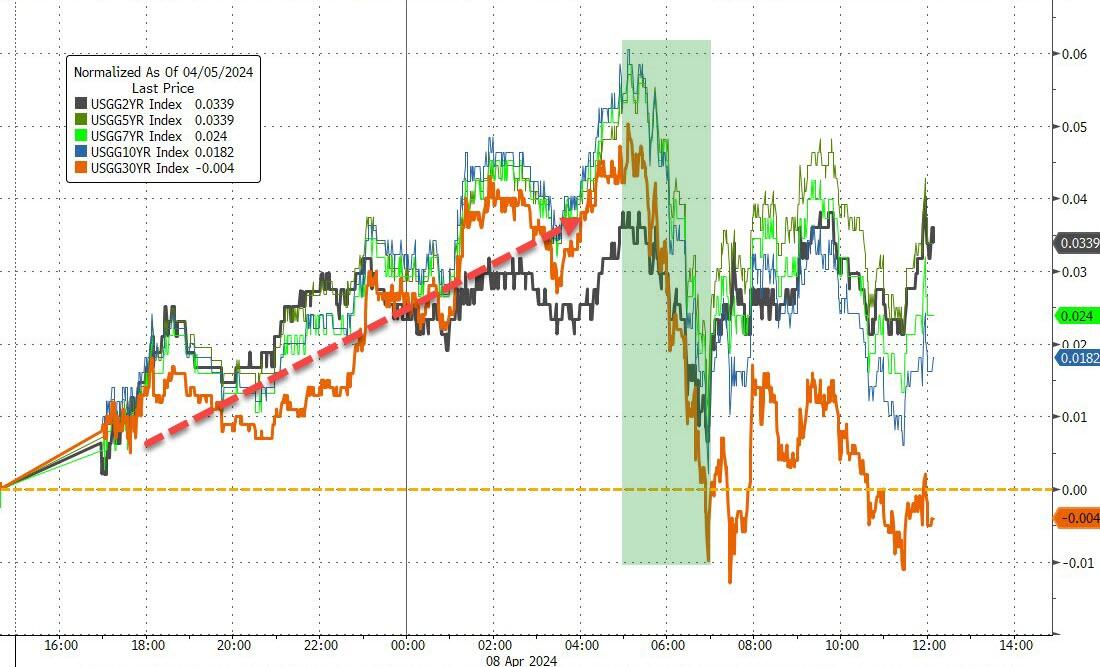
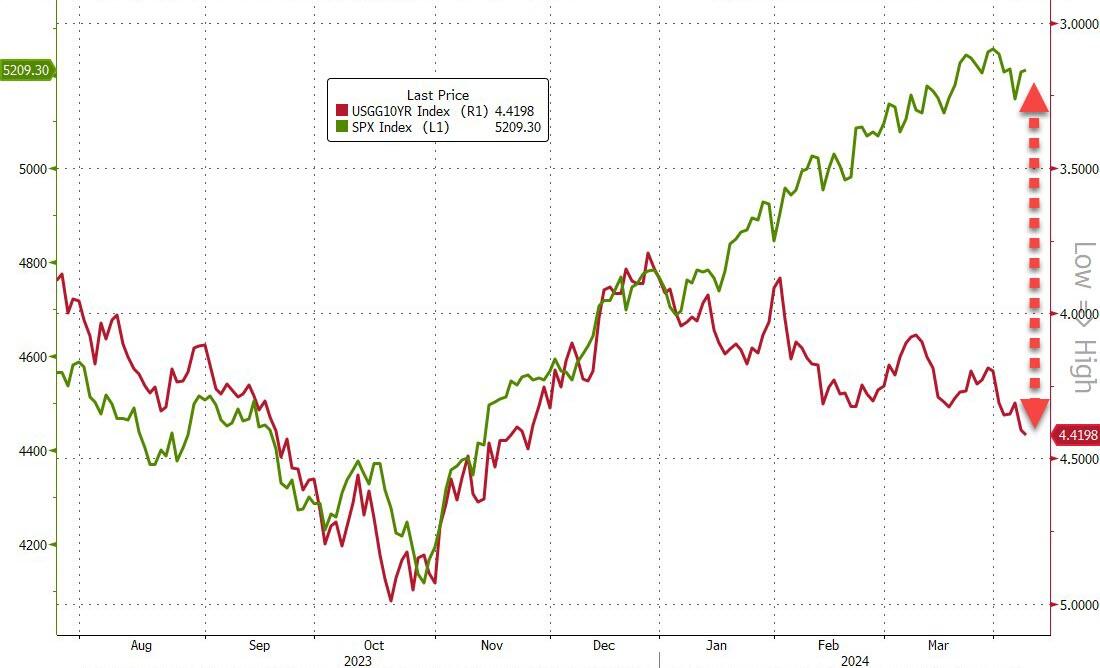
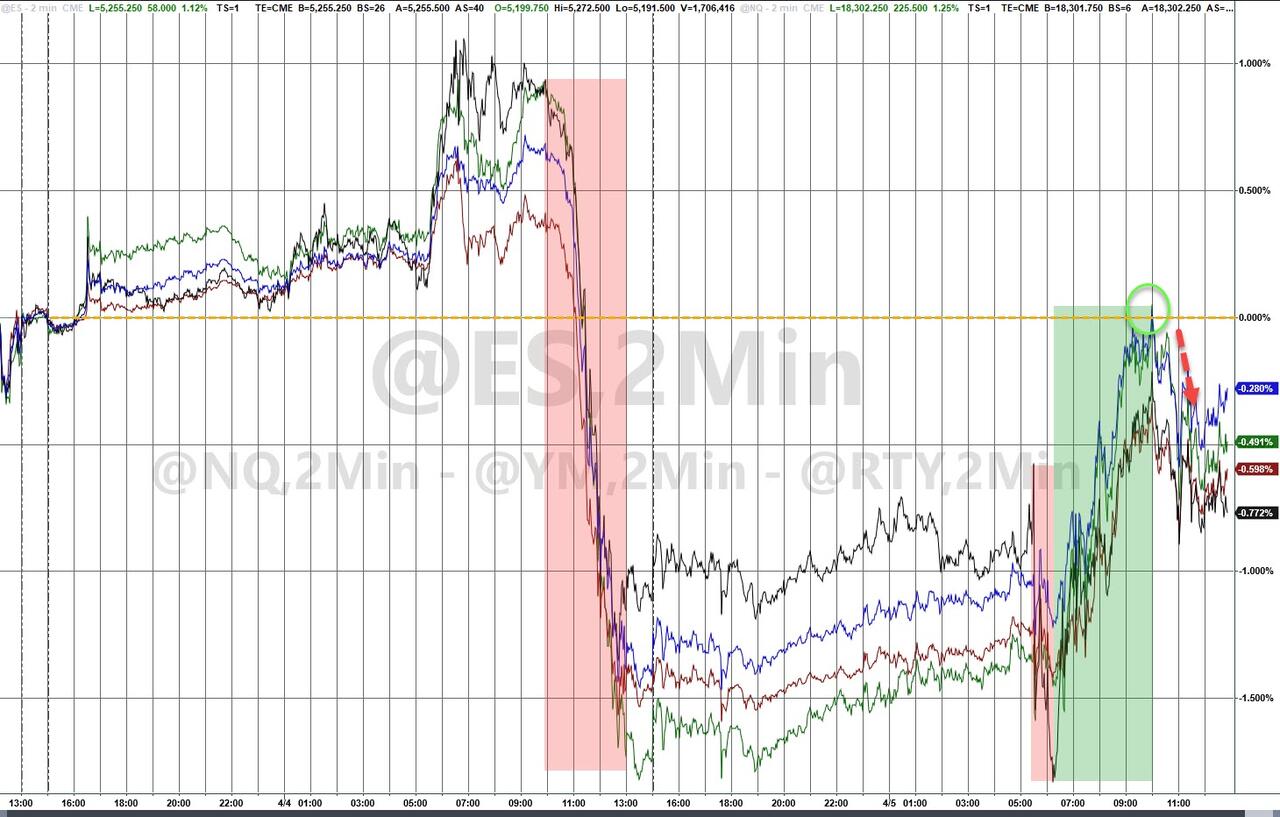
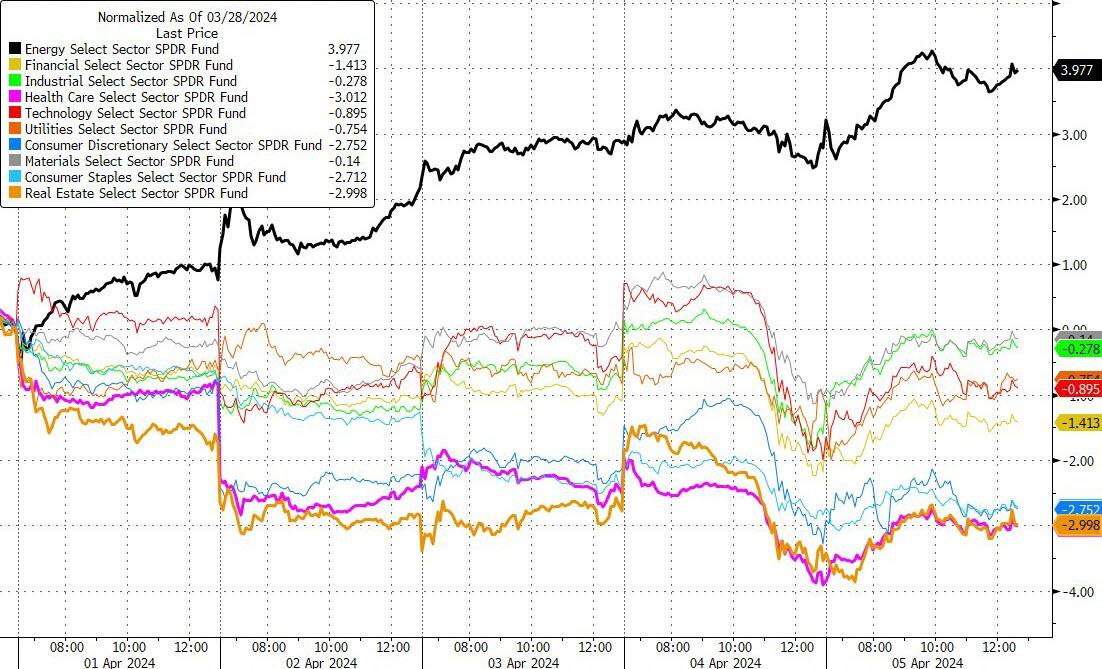
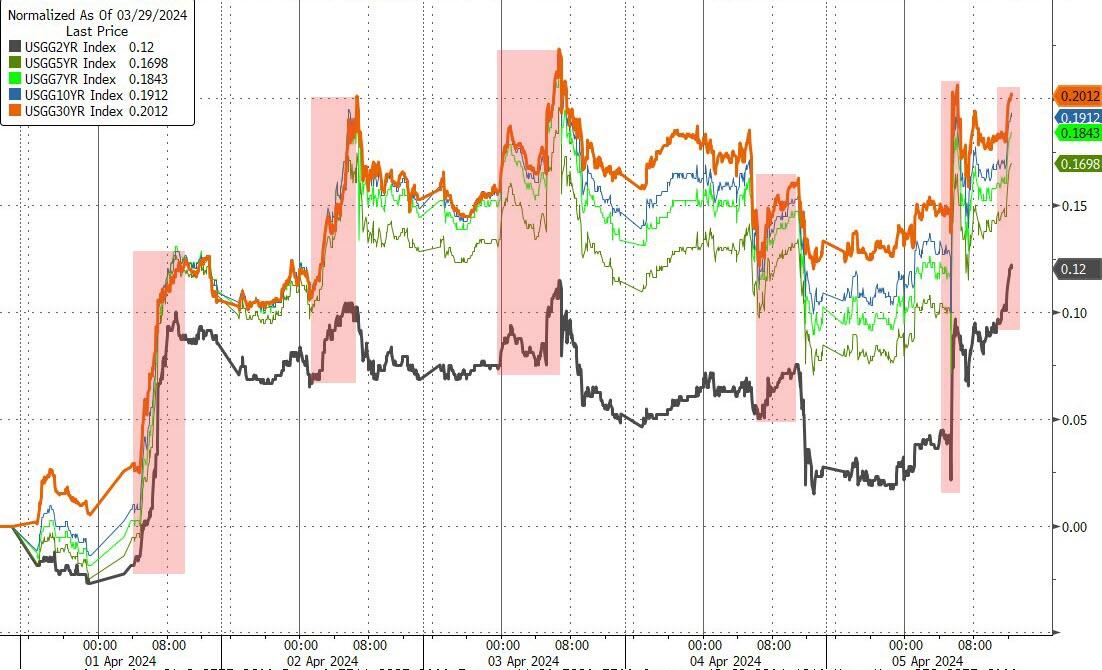
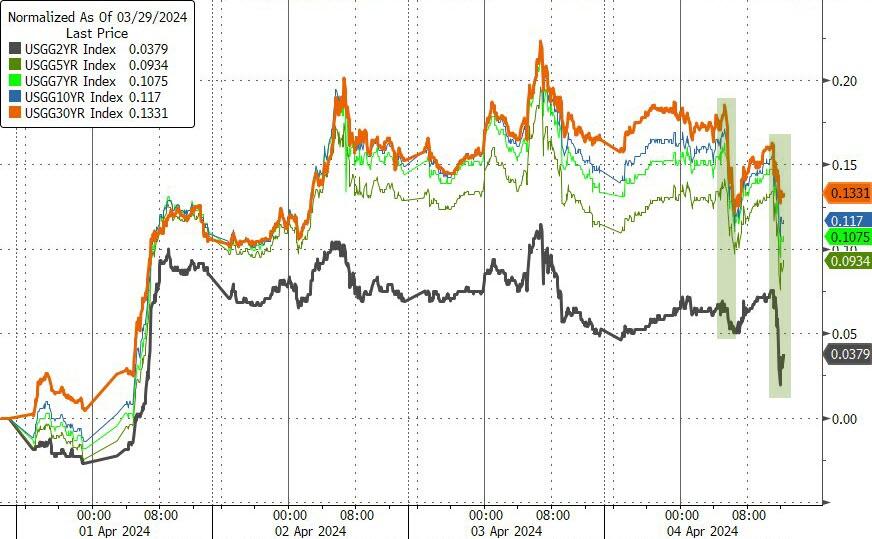
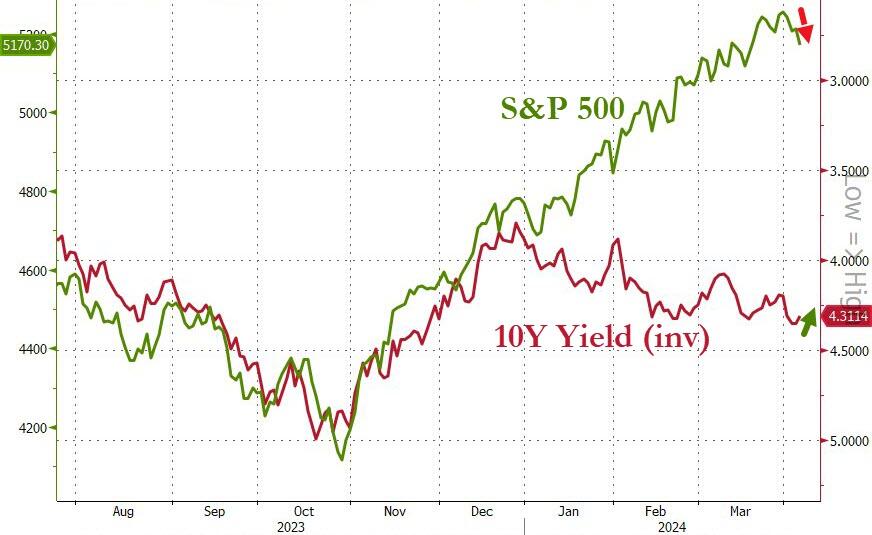
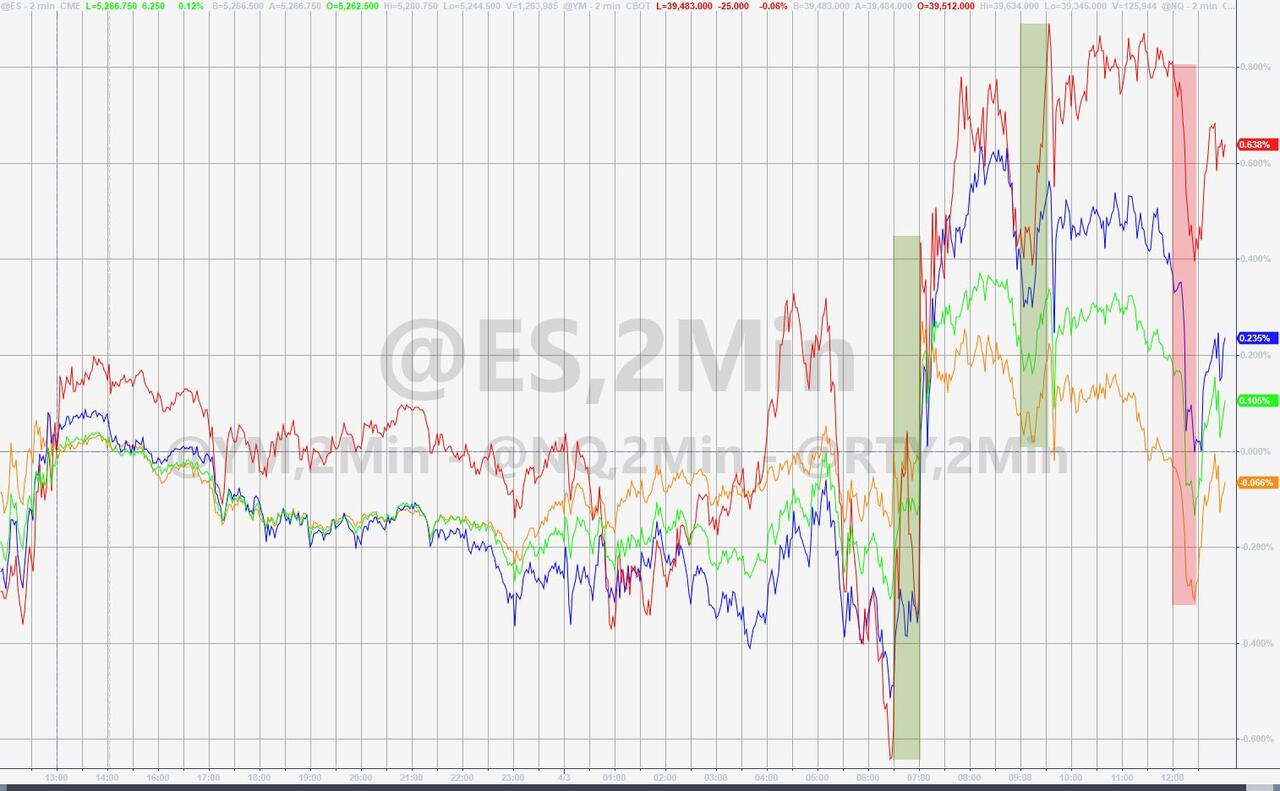
In today’s trading session, stock performance remained static as traders sought stability after last week’s downturn. Despite a general uptick in the market, the rise in Treasury yields, particularly the benchmark 10-year yield which ascended by 5 basis points to 4.426%, tempered broader gains.
The Dow Jones Industrial Average recorded its poorest weekly showing since March 2023, while the S&P 500 saw its steepest weekly decline since the start of the year, nearly 1%.
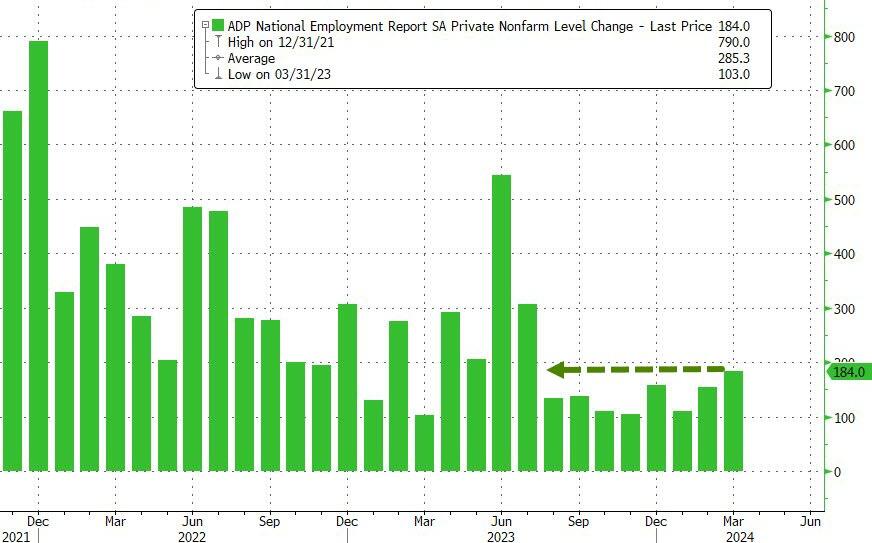
However, the markets concluded the previous week on an upbeat note, buoyed by a jobs report that surpassed expectations. The increase in part-time employment has fueled optimism for sustained economic strength and the potential for continued corporate earnings growth, despite the prospect of enduring higher interest rates.
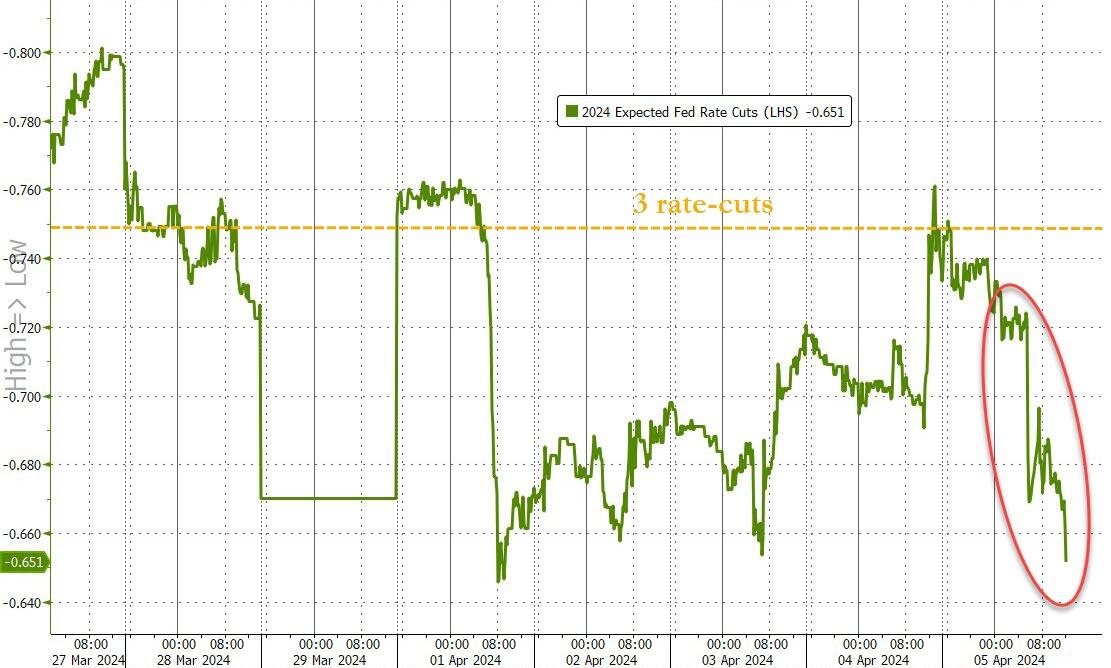
Investors remain hopeful, interpreting negative news as potentially beneficial for the stock market, with expectations of interest rate cuts later in the year.
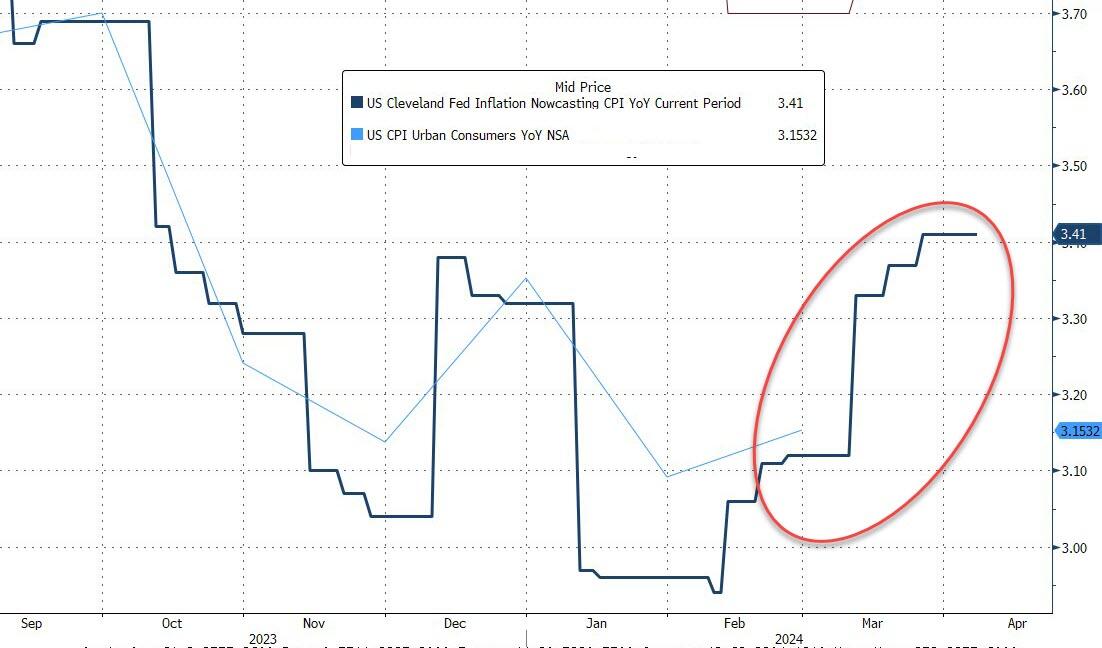
This sentiment is underpinned by anticipation for the Federal Reserve’s upcoming release of the March consumer and producer price indexes, which are pivotal indicators of the Fed’s success in combating inflation. Economists are forecasting a 0.3% rise in the CPI for the past month and a 3.5% increase on an annual basis.
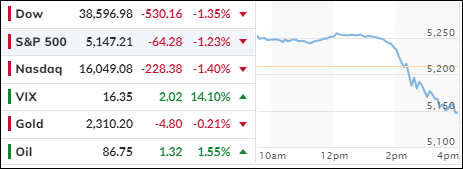
As the market braces for the potential impact of the CPI, PPI, and the release of the FOMC minutes, stocks have shown little movement, while bond yields have inched upward.
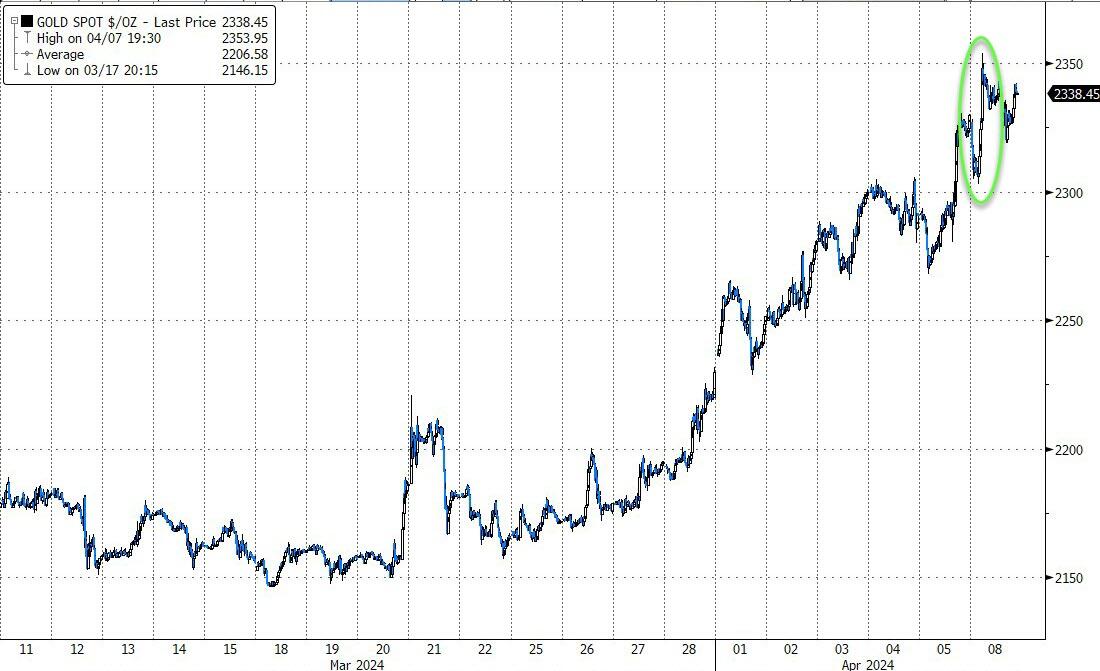
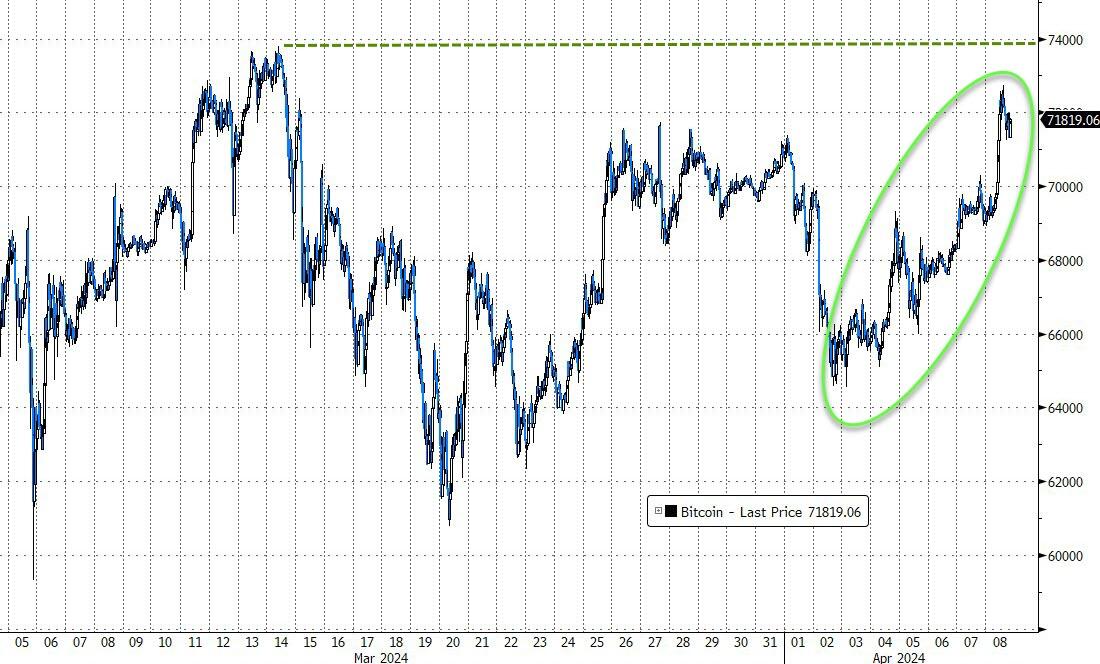
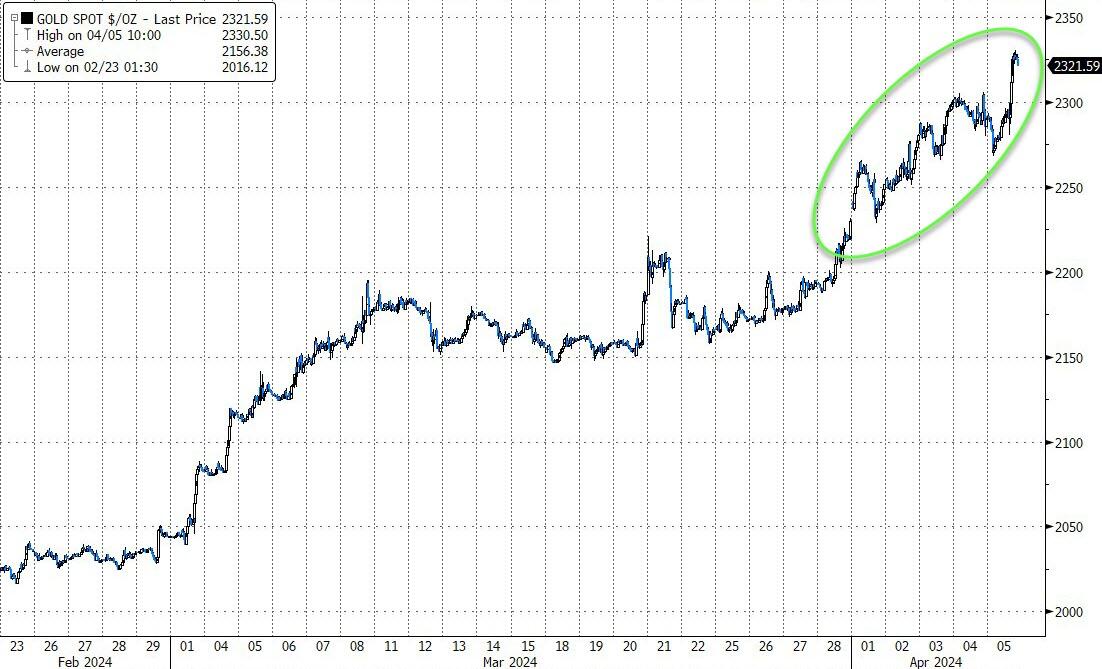
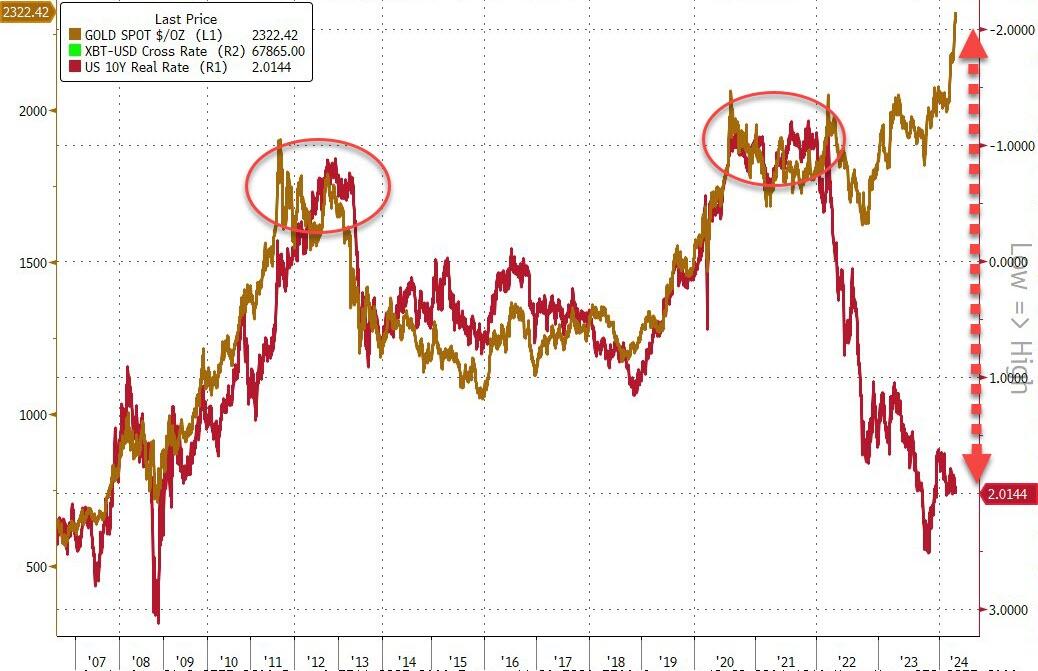
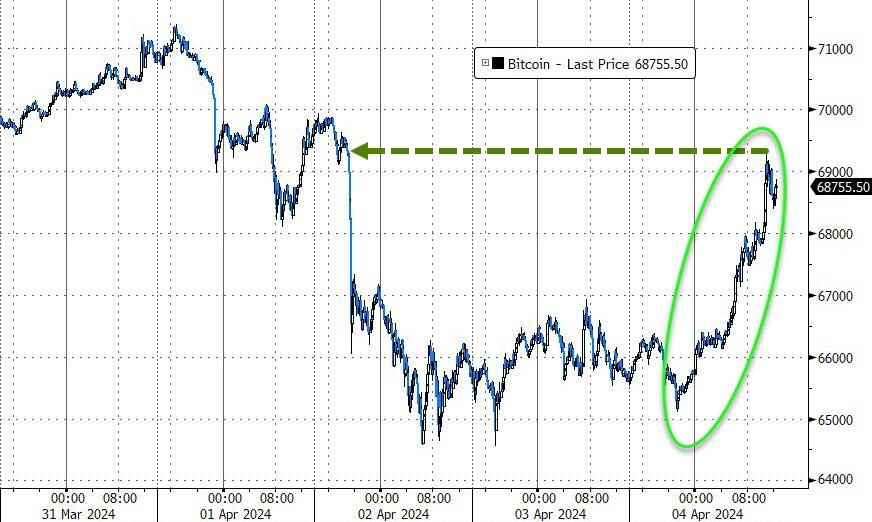
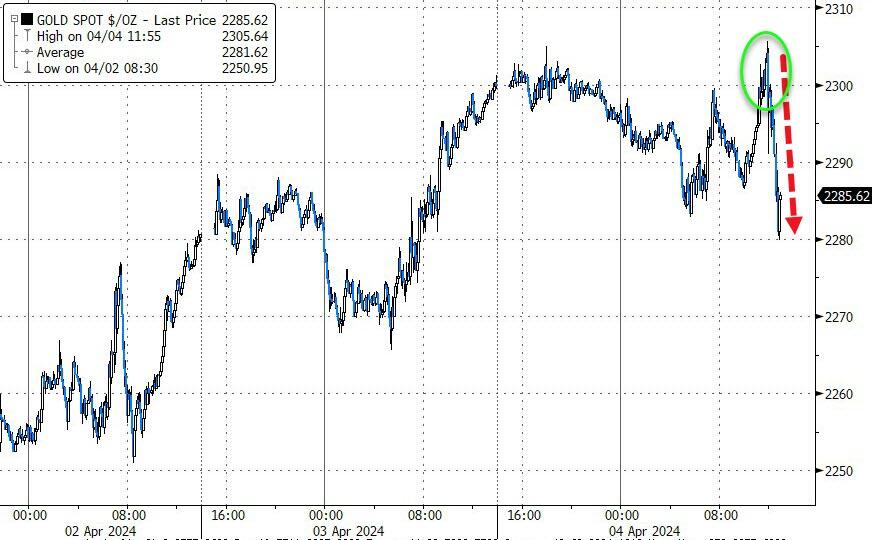
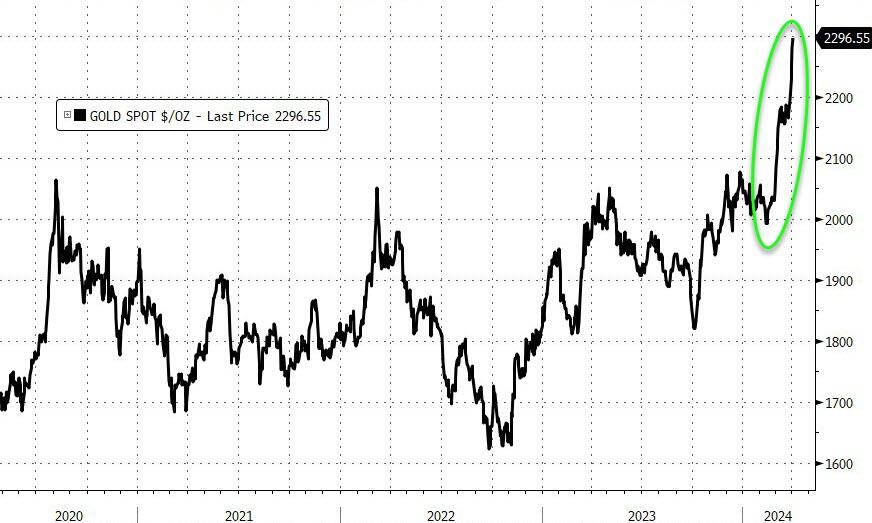
Amidst geopolitical unrest and concerns over a potential Federal Reserve policy misstep, both bitcoin and gold have experienced significant gains.
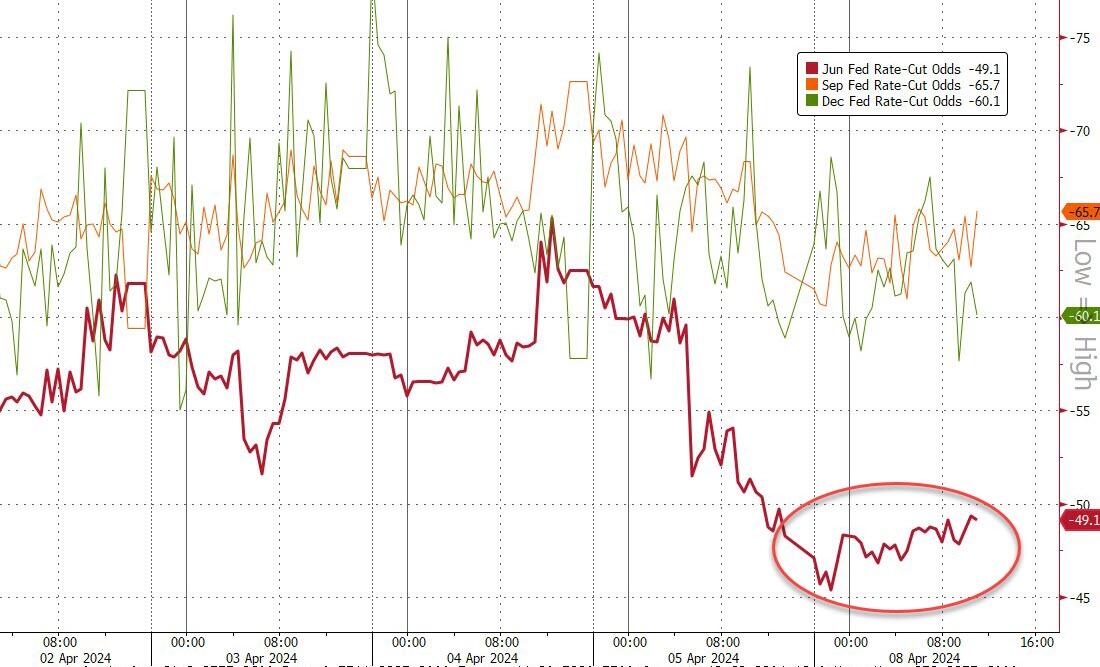
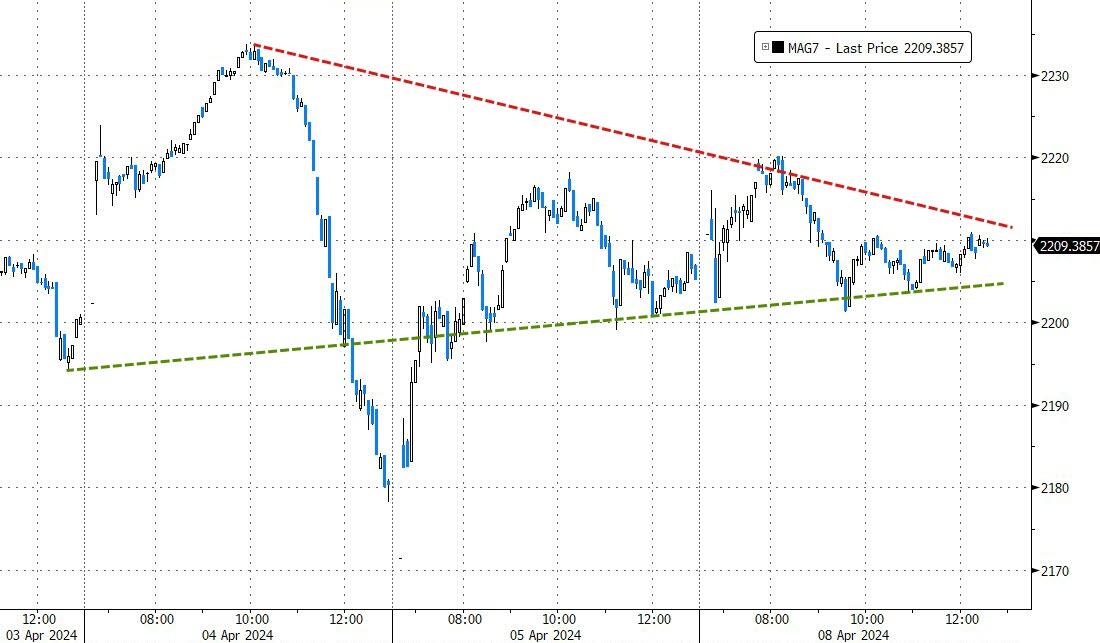
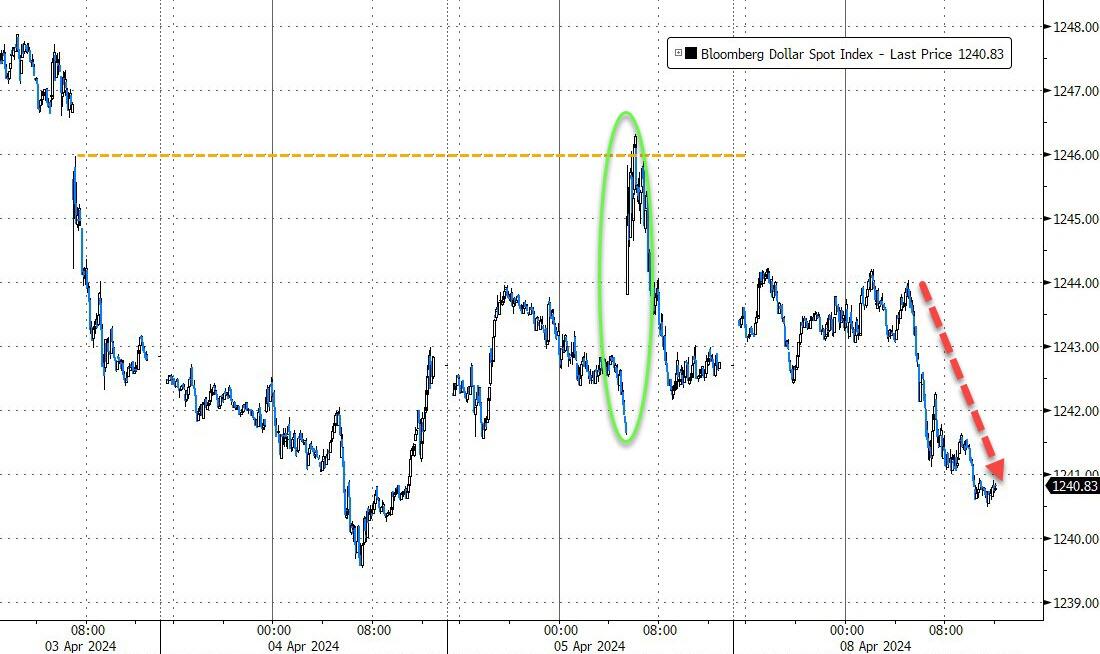
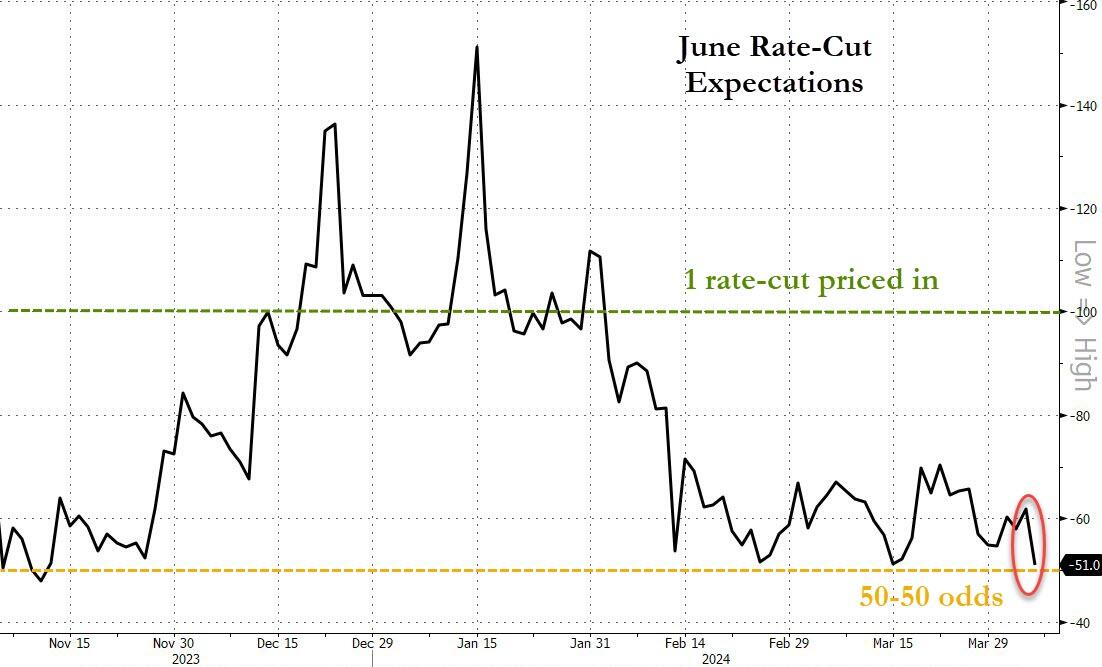
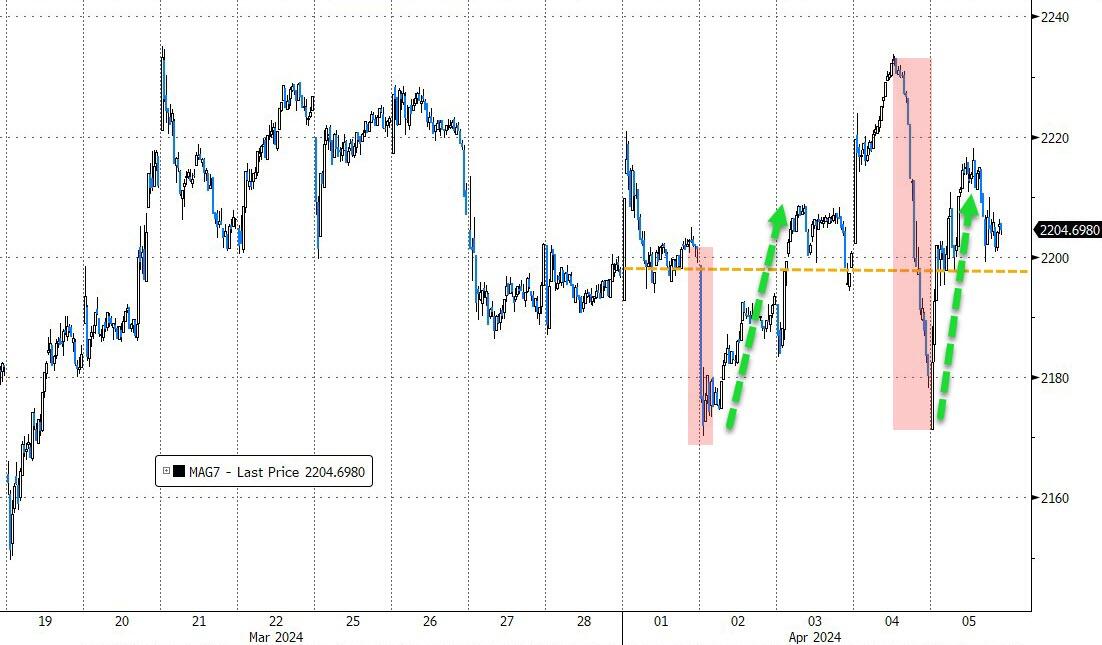
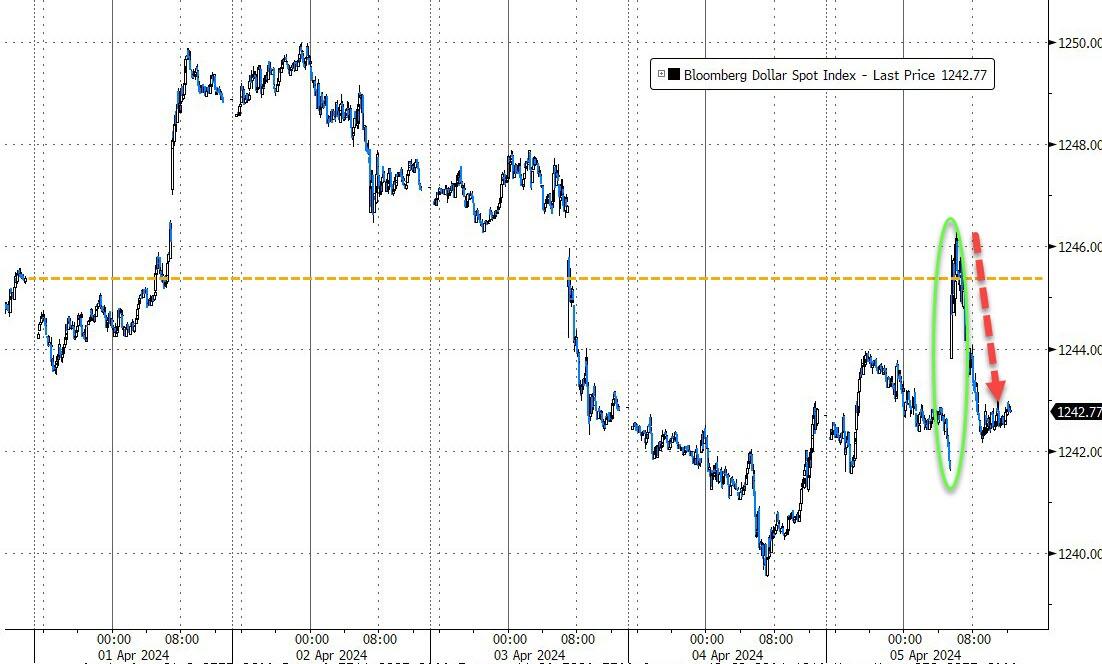
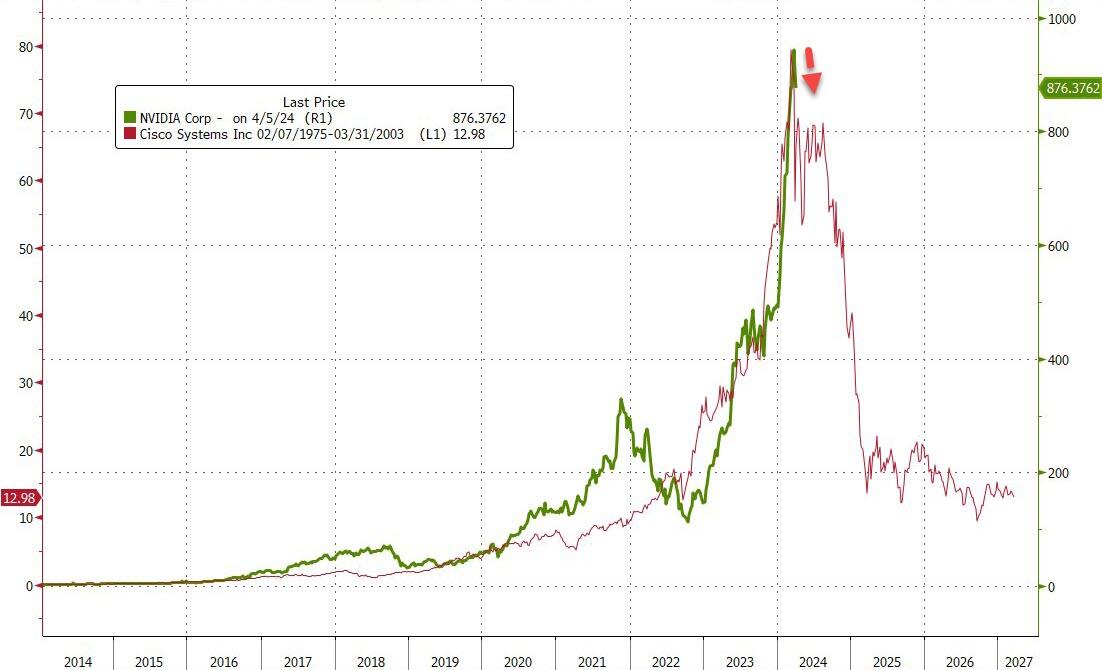
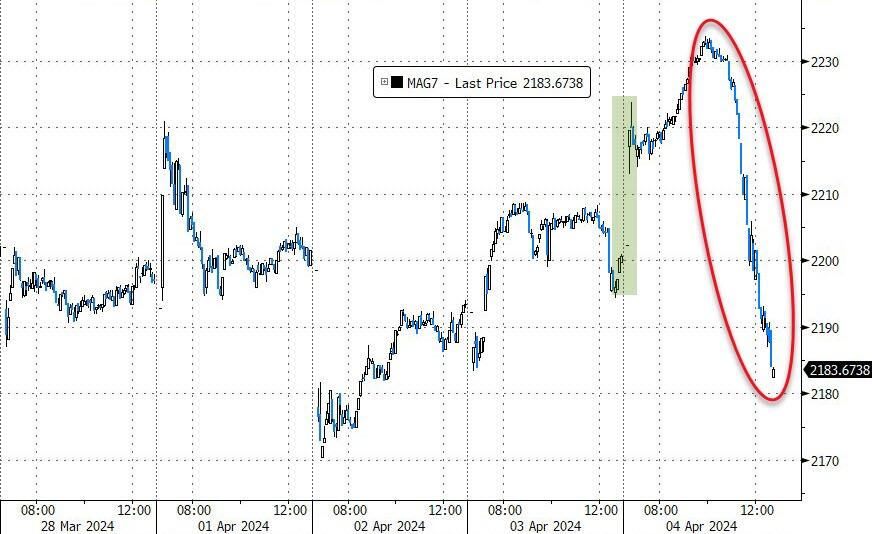
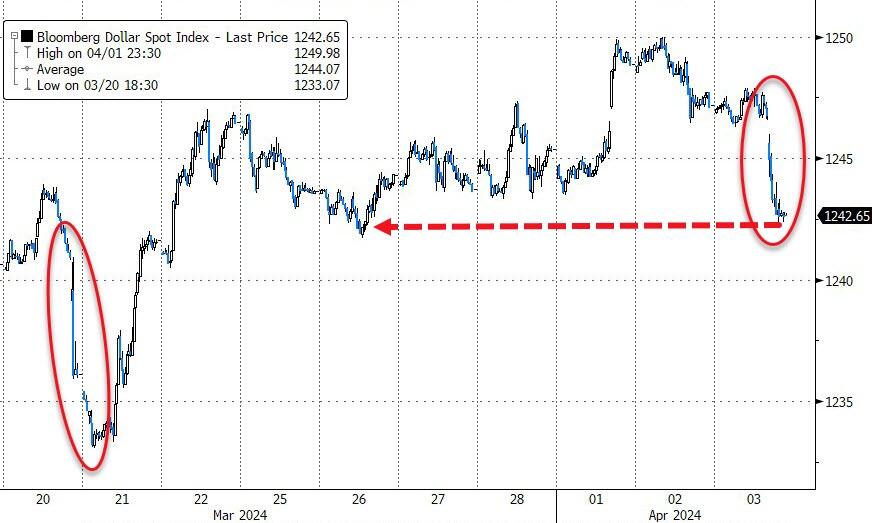
However, the likelihood of a rate cut in June has dipped below 50%, and major stock groups like the MAG7 have stalled. The dollar experienced an initial surge but subsequently declined, and bitcoin approached its record high of $73k before retreating.
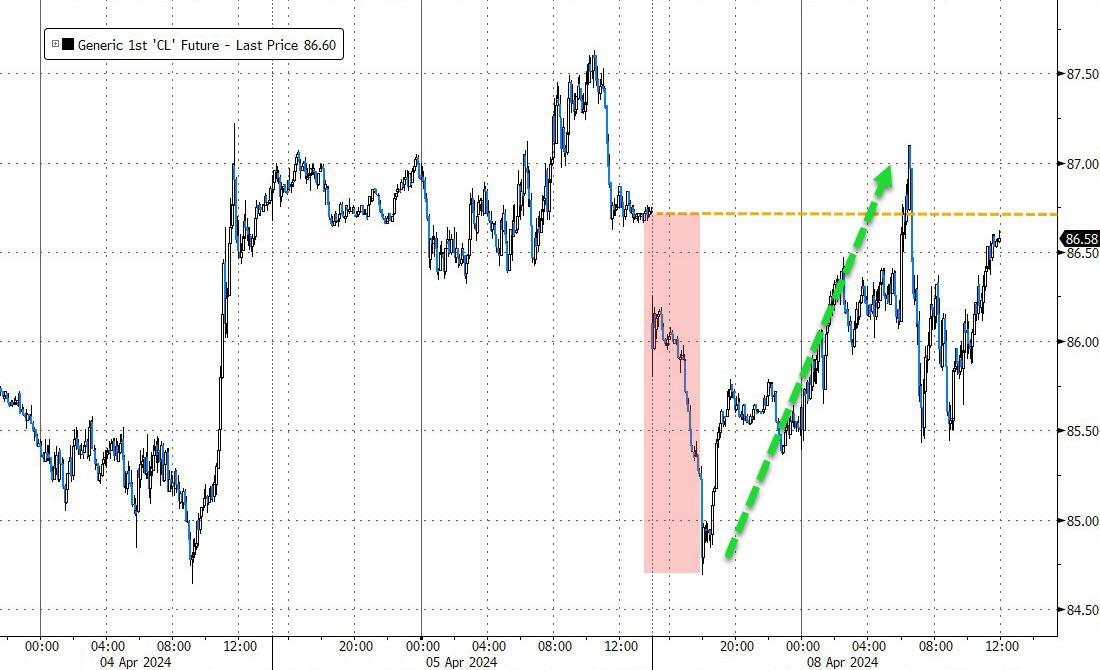
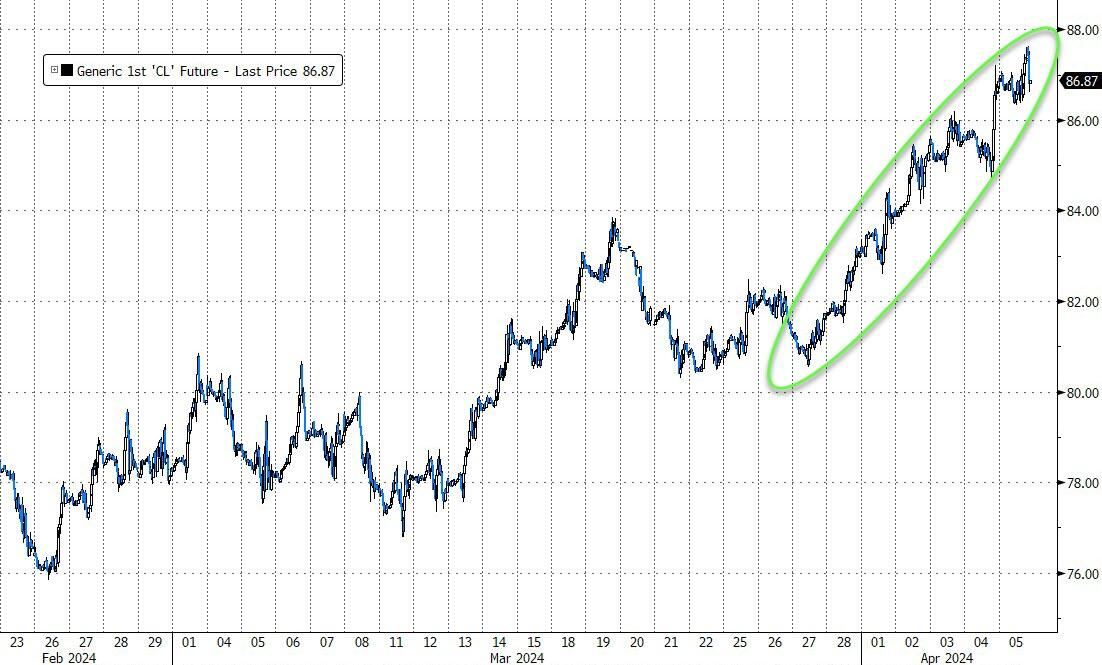
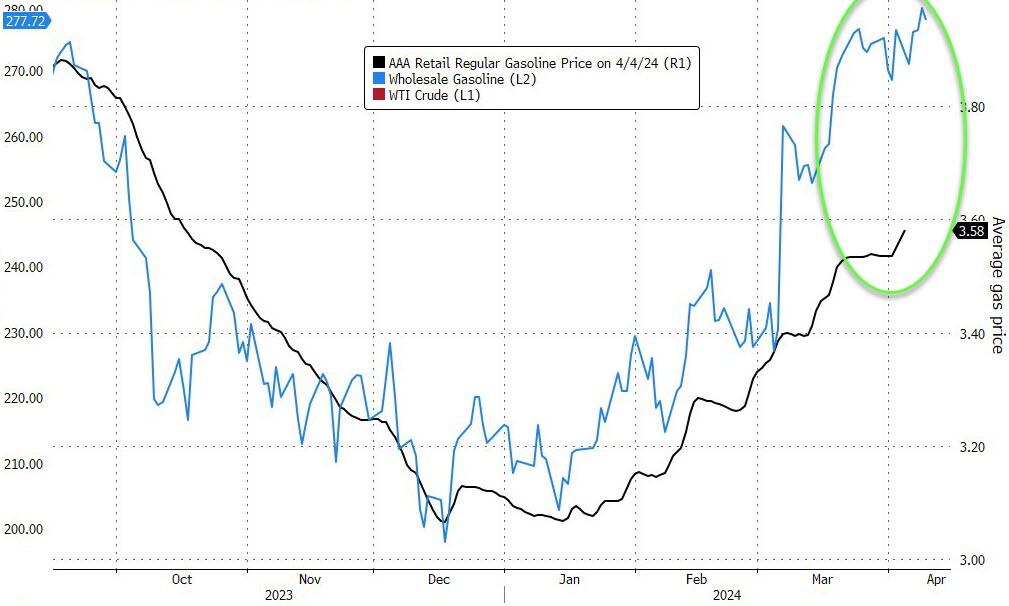
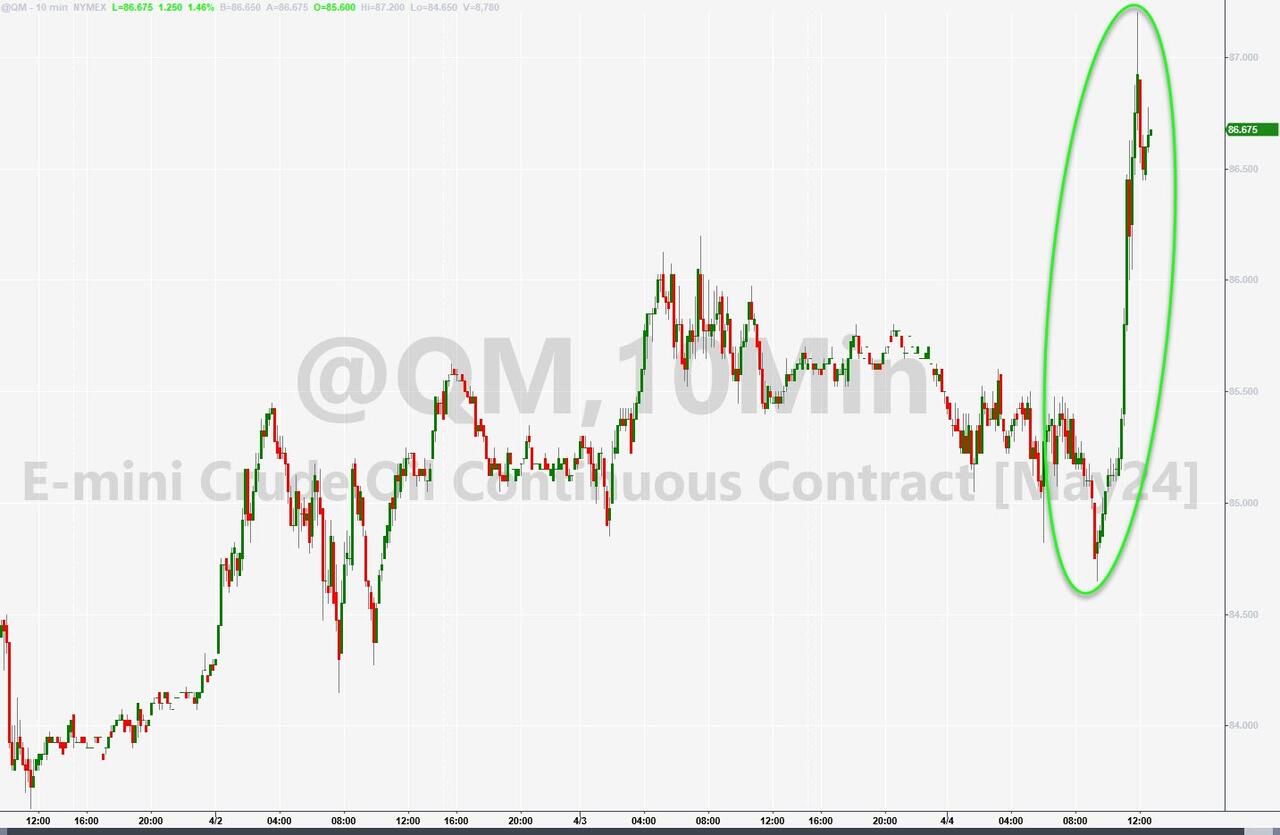
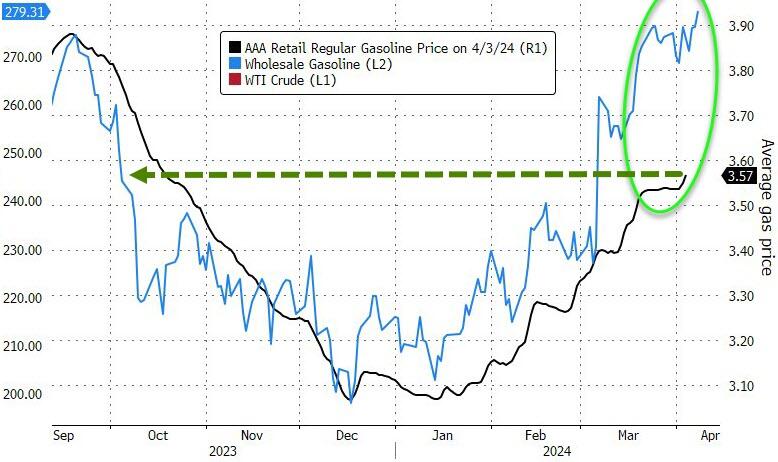
Oil prices initially dropped following reports of Israel’s troop withdrawal from Gaza, only to rebound after the announcement of a limited withdrawal and subsequent attack on Rafah.
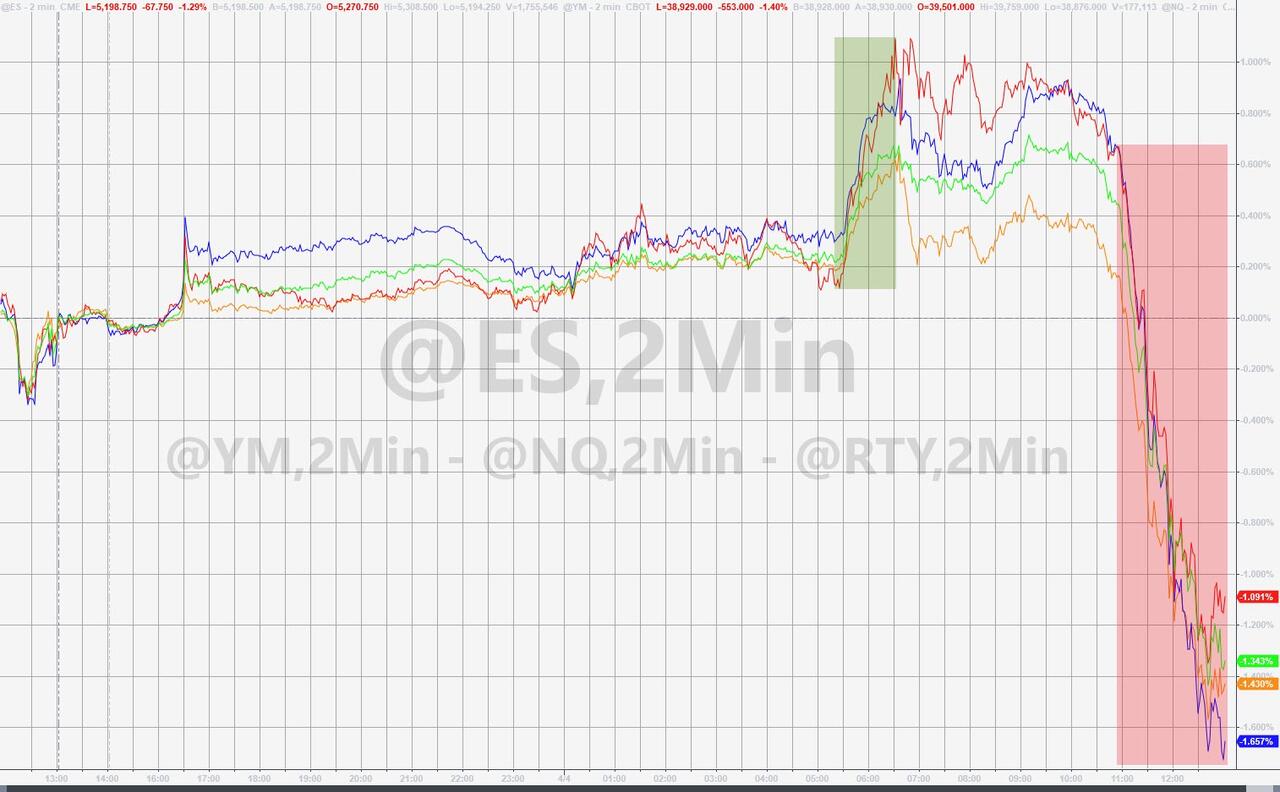
With bond yields climbing yet not influencing the S&P 500’s trajectory, all eyes are on the Federal Reserve.
Will the Fed’s minutes reveal the future course of monetary policy this Wednesday?
Read More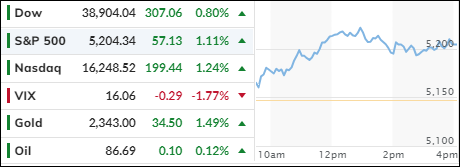
