No Load Fund/ETF Tracker updated through 6/10/2010

Ulli Uncategorized Contact

My latest No Load Fund/ETF Tracker has been posted at:

http://www.successful-investment.com/newsletter-archive.php

In a reversal from the prior week, the major indexes gained for a change.

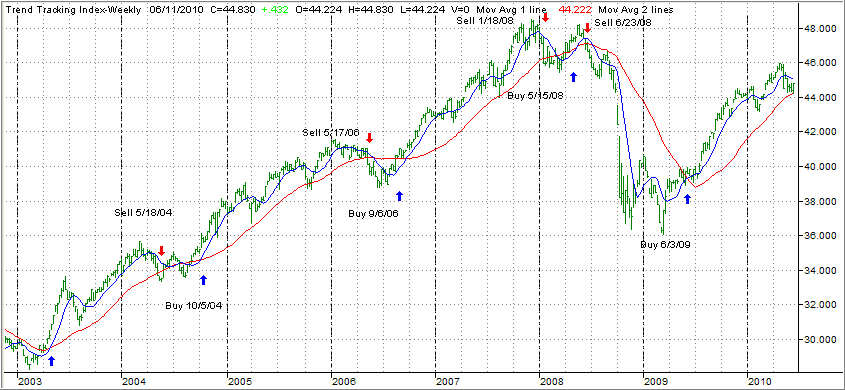
Our Trend Tracking Index (TTI) for domestic funds/ETFs remains above its trend line (red) by +1.38% (last week +0.52%) keeping the current buy signal intact. The effective date was June 3, 2009.


The international index has now broken below its long-term trend line by -2.83% (last week -5.12%). A Sell Signal was triggered effective May 7, 2010. We are no longer holding any positions in that arena.


[Click on charts to enlarge]

For more details, and the latest market commentary, as well as the updated No load Fund/ETF StatSheet, please see the above link.

Rebound Failure

Ulli Uncategorized Contact


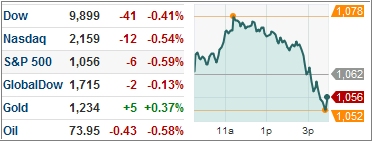
[chart courtesy of marketwatch.com]

Yesterday, we saw a repeat of sizzle and fizzle in the market as a solid rebound rally had the Dow up by some 125 points and back over the 10,000 level.

As has been the case more often than not lately, the activity during last trading hour took the starch right out of the momentum and down we went with the major indexes closing in negative territory. This was certainly a disappointing outcome for those hoping that we may have turned the bearish corner two days ago.

Even the cautious but upbeat comments by Fed chairman Bernanke could not support the waning momentum. External news from the European Union and general uneasiness about the global economy seemed to be simply too strong to overcome the meager internal reports from the beige book and consumer and business spending.

Our domestic Trend Tracking Index (TTI) reversed course from the prior day and moved closer to its long term trend line. As of yesterday, it still hovers +0.21% “above” it keeping us in bullish territory.

Barring a sudden grand solution to all what ails the global economies, it’s just a matter of time before the domestic TTI breaks below its line.

Once it does, we will become outright bearish. Since we are so close to that point, I will keep you posted on a daily basis, as I have been, via this blog as many readers have indicated that this break will be their ultimate indicator to get out of all domestic equity positions.

Buying Time

Ulli Uncategorized Contact


It was nip and tuck for a while as the major indexes plunged right after yesterday’s opening. The subsequent rebound attempt held for a change and buying during the last 30 minute lifted the averages (except the Nasdaq) out of the doldrums.

As discussed on Monday, the S&P; 500 bounced off its 1,040 support level twice; an encouraging sign for many traders. The euro gained helping metals and energy prices to move up as well.

After all the recent selling some kind of rebound was overdue, but it certainly does not guarantee a new bottom is in. To me, it merely means that we have bought some time as the 1,040 level is certain to be tested again.

For right now, however, a domestic sell signal did not materialize as the domestic TTI moved slightly higher and is still positioned above its long term trend line— although by only a very meager +0.46%.

Honing In On Bear Market Territory

Ulli Uncategorized Contact


When the intra-day mini crash of 1,000 points in the Dow occurred on May 6, most investors thought of it as an aberration and did not consider the possibility that we might actually revisit that price level.

Here we are 30 days later, and we have broken through it decisively. Yesterday’s rally attempt was wiped out during the last 30 minutes of trading, and the major indexes closed at their lows for the day.

Our international Trend Tracking Index (TTI) has been stuck in bear market territory since 5/7/10 (currently at -5.94%), while the domestic TTI has been hanging on by staying above the trend line. At times it has come within striking distance of succumbing to bearish forces before the bulls managed to save the day.

Yesterday’s sell off pulled the domestic TTI again to within +0.12% of moving into bearish territory; close, but no cigar. Another down day similar to yesterday, and we will surely be heading below the line.

If you followed and executed my recommended sell stop discipline, you should have sold your domestic equity holdings some time ago, so, when the actual sell signal occurs, it is merely a formality confirming the already established downward trend.

If you have a small equity position left you wish to hold for whatever reason, you may want to consider hedging it once we have actually broken below the trend line for the domestic TTI.

In our managed accounts, we actually have such a (conservative) mutual fund that covers some equities, bonds, gold, silver and currencies. Due to the size of the holding, and the fact that we are still partially within the 90-day redemption period, I may hedge it for the time being to guard against sudden further down moves.

Market technicians are trying to figure out whether we are near a bottom or not. The 1,040 level of the S&P; 500 offers the nearest support by being part of a long-term trend line since last July.

However, with the European debt crisis only being in the first inning or so, nothing would surprise me on the downside. We could take out that 1,040 level before breakfast today and be back in no man’s land.

Right now, we are still in that range where establishing new long positions doesn’t make any sense while it’s too early (and risky) to get involved in outright short ones. Be patient and wait for the market to give a better indication as to where we’re headed next.

Should You Buy Oil Now?

Ulli Uncategorized Contact

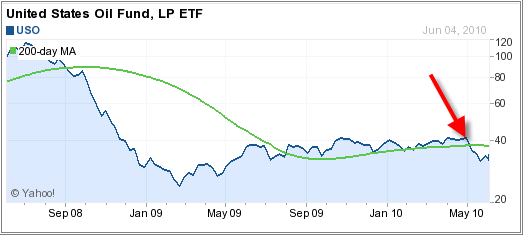
Several readers have emailed wondering whether oil would be a good buy at this level. The most obvious reason has been the devastating oil spill with all its implications. Let’s take a look at a 2-year chart of oil as represented by USO, the heavily traded ETF:


As you can see, oil has gone nowhere in the past year and has pretty much traded slightly above its long-term trend line before breaking it sharply to the downside late in April 2010 (red arrow).
Last Friday alone, USO dropped 4.61% and now resides below its long term trend line by -13.84%. Year to date, it’s down almost 17% and all of its momentum numbers are negative.

Apparently, many readers were of the opinion that oil should rally in view of the current oil spill. The reason that this did not happen, and the opposite occurred, is that oil prices fluctuate based on supply and demand in regards to economic activity.

The European debt crisis has again raised fears of a double-dip recession causing oil and energy products to head south. Look at the chart again. You can clearly see that this is what happened in September 2008, as the recession took hold, USO broke through its long-term trend line and those who held on suffered steep losses.

Given the fact that a resumption of the recession is a real possibility during the second half of this year, oil could head even lower. So, when would it be a buy?

I would consider it once it moves back above its long term trend line. At that point, at least you would have some assurance, although not a guarantee, that upward momentum has been restored. In the meantime, stay away from it as bottom fishing could be hazardous to your financial health.

Disclosure: No positions in USO

Sunday Musings: 5 Star Mutual Fund Ratings

Ulli Uncategorized Contact

In the new world of ETFs, it seems almost archaic to talk about Morningstar’s mutual fund ratings. But with many investors still being stuck in 401ks with only mutual funds a choice, it’s still a valid topic.

MarketWatch reports that “Five-star mutual funds don’t live up to their past:”

Tim Courtney decided he’d had enough. In meeting after meeting this year, he and his colleagues at Burns Advisory Group had recommended mutual funds to prospective clients, only to be hit with the same response almost every time: Why are you telling me to invest in a three-star rated fund?

That sums up the way many investors allocate money to funds — look at products that have four- or five-star ratings from investment researcher Morningstar Inc., take that as an imprimatur of quality and hope for the best. Such decisions are perhaps even more common in volatile markets, when anxious investors view top-ranked funds as somehow better-equipped to handle adversity.

Five-star funds in particular seem to have their own allure. Even in 2008’s brutal market, when the other star-rated funds saw net outflows ranging from $111 billion for three-star funds to $14 billion for four-star funds, five-star funds enjoyed $67.5 billion in net inflows.

The trouble is that investors seem to forget that star ratings look backward based on a fund’s past performance, and studies have shown the ratings have no predictive value.

“Having to get over that hurdle [explaining how star ratings shouldn’t influence choices], every time we recommended a fund that wasn’t five-star, is something we have to do time and time again,” said Courtney, chief investment officer of Burns Advisory, which manages about $300 million and advises about $150 million of 401(k) assets.

So Courtney and his colleagues went back to Dec. 31, 1999 and studied the subsequent 10-year performance of five-star funds. What he found might convince investors to kick their star-rating habit.

Of the 248 stock funds with five-star ratings at the start of the period, just four still kept that rank after 10 years. The 218 domestic stock funds with the rating typically lagged their category averages over the period — not just the benchmarks, but other mutual funds. The exceptions were 30 foreign large-cap funds, which had a 10-year annualized return of 1.44% compared with their category average of 1.32%.

In other words, it’s not just that five-star funds don’t, on average, continue to lead their peers, but they actually do worse in subsequent years.

There is much more to this article; if the subject interests you, be sure to read the entire link.

Personally, I have never seen the value of that rating system; I have found that if you wait long enough, your favorite 5-star fund may end up in the 2-star category and vice versa.

Using these ratings, investors get lulled into a false sense of security by believing that highly rated funds will hold up well in all types of market conditions. That false belief has turned into a very expensive lesson as the bear markets of 2001 and 2008 have clearly demonstrated.

I don’t care what rating a mutual fund has, whether it’s no load or load with high or low annual expenses; it will get clobbered when a bear market strikes—period. Only by being out of the market altogether during lengthy downturns can you avoid a serious portfolio haircut.

Sure, if you have assets in a 401k plan, you could use the ratings system to make your choices at the beginning of a bullish period, as long as you’re aware of the shortcomings once that trend comes to an end.

Better yet, use the 401k section of my StatSheet to verify that your selected 5-star fund is showing indeed upward momentum to justify a purchase.

The bottom line is that whether mutual funds or ETFs are on your equity menu, you need to recognize that neither will protect your principal during lengthy downward trends (unless they’re bear market funds). If you haven’t learned this valuable lesson from history, you’re doomed to repeat it.