Sunday Musings: Disconnect

Ulli Uncategorized Contact

Emerging markets, the leader of the past, have been holding up relatively well since the Egyptian crisis has erupted as MarketWatch reports:

For emerging markets investors, the unrest in Egypt has been unsettling, to say the least. But the steep losses in Egypt’s now-shuttered stock market barely have affected the returns of emerging-markets mutual funds and exchange-traded funds.

The Egypt market’s 21% slide year-to-date is painful, but Egypt represents about 0.38% of the MSCI Emerging Markets Index (Egypt is not a so-called frontier market, according to MSCI). The emerging-market benchmark is down about 1.4% so far this year. What is Egypt’s contribution to that loss? About eight basis points, or 0.08%.

Of course, the political storm engulfing Egypt is taking aim at other countries in the Middle East and Africa, so fund and ETF investors may be in for more shocks. But this is the price of risk that emerging-markets investors pay in exchange for the promise of extraordinary returns. Only now that risk is extraordinarily high.

Sure, while the effect of the Egyptian uprising has been limited in scope so far, there seems to have been some directional change in the emerging markets since the beginning of this year, which happened even before Egypt entered the picture.

Here’s a 6 months chart showing the S&P; 500 vs. the emerging markets ETF (VWO):


As you can see, since the Fed’s Quantitative Easing initiative (QE-2), which was enacted the beginning of November, VWO has been very volatile and seem to have disconnected from the domestic market, as represented by SPY, since January 2011.

You could argue that this was one of those unintended consequences of QE-2 as was the rise in interest rates. While the S&P; 500 has been on a straight upward path, VWO has headed south and has come off its high by -4.58% as of 2/3/11.

It’s too early to tell whether the major trend of the emerging markets has indeed come to an end, but you should be prepared to exit in case things get worse. Remember, for country funds/ETFs, I recommend the use of a 10% trailing sell stop.

I have written about known and unknown uncertainties. Egypt was definitely an unknown and unexpected one with more fallout potential from other surrounding countries a real possibility.

It appears that the world we are living in grows more uncertain by the day, which eventually will affect the domestic stock market as well. Although right now it seems that things are a lot worse elsewhere than here in the U.S., so we may have some more upside potential.

However, when directional changes occur, they may happen fast and furious, if they are triggered by a major adverse event. Don’t become complacent; always be prepared to exit and establish your strategy now, and not when the market heat is on.

Disclosure: Positions in VWO

An Active Bear ETF

Ulli Uncategorized Contact

Hat tip goes to reader Larry who pointed to a new ETF that recently came on the market. It’s a managed Bear ETF and it works as follows:

The investment objective of the Active Bear ETF (HDGE) is capital appreciation through short sales of domestically traded equity securities. The HDGE portfolio is sub-advised by Ranger Alternative Management, L.P. The portfolio management team implements a bottom-up, fundamental, research driven security selection process. In selecting short positions, the Fund seeks to identify securities with low earnings quality or aggressive accounting which may be intended on the part of company management to mask operational deterioration and bolster the reported earnings per share over a short time period.

In addition, the portfolio management team seeks to identify earnings driven events that may act as a catalyst to the price decline of a security, such as downwards earnings revisions or reduced forward guidance.

There are several reasons listed as to why an investment in HDGE might make sense:

As a Tool to Hedge Equity Exposure – HDGE can be used as part of a long/short strategy in which an investor may synthetically integrate by pairing HDGE with a long-index ETF (or an investor’s portfolio of long positions), providing the investor with a “buy and hold” option to hedge their long domestic equity exposure.

For Diversified Portfolio Construction – The Portfolio Management Team’s portfolio construction process emphasizes diversification across a number of industries and specific companies with a special focus on catalysts that drive lower stock returns. The portfolio will typically consist of between 20-50 equity short positions, with an average position size of between 2% and 7% of the portfolio exposure.

For a Fundamental Investment Process – The HDGE Portfolio Management Team utilizes accounting metrics across the income statement, cash flow statement and balance sheet to identify companies with low earnings quality or possible aggressive accounting practices. These factors may suggest operational deterioration in a company’s business. Qualitative analysis is also considered. An assessment of the management team, accounting practices, corporate governance and the company’s competitive advantage are analyzed before a company is included as part of the HDGE portfolio.

As you would expect, an actively managed ETF has higher annual expenses, and HDGE is no exception. The current net annual expense ratio is listed at 1.85%.

This is a new kid on the block with currently only $26 million under management and no track record. The concept sounds very interesting, but HDGE will need to prove itself for a minimum of some 9 months. That will allow enough time to establish a pricing and trading history to better evaluate how this ETF has fared in various market conditions.

I will report on in it again later on this year.

Disclosure: No Positions

No Load Fund/ETF Tracker updated through 2/3/2011

Ulli Uncategorized Contact

My latest No Load Fund/ETF Tracker has been posted at:

http://www.successful-investment.com/newsletter-archive.php

A breakout to the upside moved the Dow and S&P; 500 above their milestone 12,000/1,300levels.

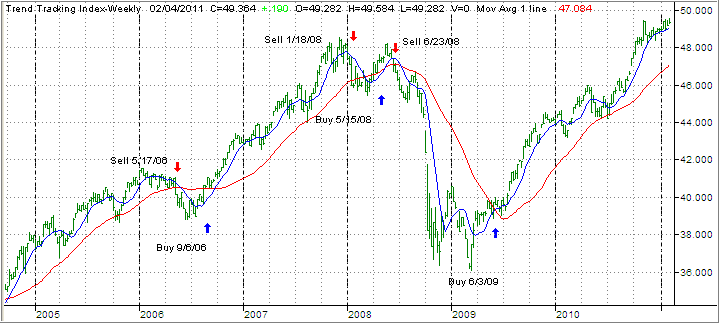
Our Trend Tracking Index (TTI) for domestic funds/ETFs has moved above its trend line (red) by +4.85% (last week +4.71%) and remains in bullish mode.

The international index has broken above its long-term trend line by +9.25% (last week +7.64%). A new Buy signal was triggered effective 9/7/10. If you decided to participate, be sure to use my recommended sell stop discipline.

[Click on charts to enlarge]

For more details, and the latest market commentary, as well as the updated No Load Fund/ETF Tracker StatSheet, please see the above link.

Treading Water

Ulli Uncategorized Contact

As is usually the case, when milestone levels are broken, the markets took a pause yesterday as mixed news did not provide enough of an impetus for the bulls to drive the major indexes higher.

As the chart above shows (courtesy of marketwatch.com), the S&P; 500 trended within a five point range and closed slightly lower.

Some contributing factors to the sideways activity were violent outbursts in Egypt and miserable weather conditions in parts of the U.S. Nevertheless, the markets remained fairly resilient despite no shortage of opinions that a major correction is about to occur.

ADPs announcement of strong private sector growth was taken in stride as those numbers (187,000 jobs added in January), have not been an accurate reflection in the past as to how Friday’s unemployment report will turn out.

Party Time On Wall Street

Ulli Uncategorized Contact


It was party time on Wall Street yesterday as both, the Dow and the S&P; 500, cleared their respective milestone hurdles of 12,000 and 1,300 by a solid margin.

Setting off the move past the resistance levels was a report indicating that U.S. manufacturing is showing the most strength since 2004. Helping matters was the fact that Egypt remained fairly quiet and that the traffic along the important key waterways was flowing normally.

This was encouraging news in that it alleviated fears that global economic activity won’t be interrupted—at least not for the time being. Markets around the world participated in yesterday’s rally and most asset classes were higher with the exception of bonds, which fell due to rising interest rates.

The S&P; 500 closed at 1,308, its best finish since June 25, 2008, just two days after our domestic sell signal effective June 23, 2008. In other words, if, as a buy and hold investor, your portfolio tracked the performance of the S&P; 500, you will now have almost reached the breakeven point…

The market will face some headwinds today in form of the ADP National Employment Index and a report on layoffs. Maybe yesterday’s euphoria can carry us through these numbers as well, should they not turn out to be as anticipated.

Leaving Friday’s Losses Behind

Ulli Uncategorized Contact

Yesterday, the markets looked past the turmoil in Egypt and recouped a good chunk of Friday’s losses.

Supplying the initial boost were a couple of takeover announcements and better-than-expected earnings from Exxon Mobil. Further helping the upside cause were two economic reports showing that the recovery maybe gaining steam.

Consumer spending rose more than forecast as purchases, which account for 70% of economic activity, climbed for the second consecutive month in a row. Additionally, another report showed that businesses expanded at the fastest rate in two decades according to the Institute for Supply Management.

Gold lost and interest rates rose. Nevertheless, the markets managed to close up in January, which can bode well for the rest of this year.

According to the Stock Trader’s Almanac, a rise in January has resulted in gains for the rest of the year 90% of the time since 1950. While these are good odds, it does not say anything about the magnitude of the gains. So we’ll have to wait another 11 months to find out for sure if this will be an odds defying year or not.