06-24-2011

Ulli Newsletter Archives Contact

ETF/No Load Fund Tracker StatSheet

————————————————————-

THE LINK TO OUR CURRENT ETF/MUTUAL FUND STATSHEET IS:

https://theetfbully.com/2011/06/weekly-statsheet-for-the-etfno-load-fund-tracker-updated-through-6232011/

————————————————————

Market Commentary

Friday, June 24, 2011

ETFs HAULING SOUTH

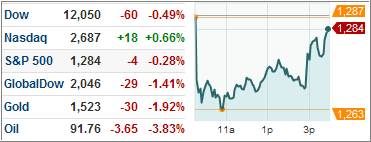
Yesterday’s late rebound, following an early morning sharp selloff, gave the bulls some hope that the bad news out of Greece, as well as economic worries, was a bit overblown.

Today, the opposite happened, as an early morning rally succumbed with the major indexes closing near their lows for the day. It seemed that with so much global uncertainly, traders did not want to hold on to any long positions over the weekend.

That is probably not a bad idea considering that a new elephant of Italian descent suddenly showed up in the room. While debt troubles with Greece are well documented daily, the fact that the Italian banks stepped on the on-deck circle was a surprise and created a bit of market anxiety. At issue is the financial health of several major players with Moody’s threatening to downgrade 13 of them.

Domestically, adding to the sour mood were tech heavyweights Oracle and Micron, which were a drag as a result of reduced sales (Oracle) and lower than expected profits (Micron). On the slightly positive side were an upward revised 1st quarter GDP number of 1.9% and growth in durable goods orders in May after a decline in April.

While the market drop from last Friday’s close was only minor, we have now reached and closed right at the S&P 500’s 200-day moving average. Several times this week, that level has served as support and propelled the markets higher.

However, repeated testing of support levels tends not to end well. With turbulent news from the far corners of the world becoming a daily occurrence, it will not take much downward momentum to not only break but also close below this level. With many technicians considering this point the dividing line between bullish and bearish territory, more selling is virtually a guarantee once that level gives.

Our Trend Tracking Indexes (TTIs) have followed the ups and downs during this past week and are now positioned as follows:

Domestic TTTI: +2.02% (last week +1.87%)
International TTI: -2.04% (last week -1.69%)

Of course, it is entirely possible that the S&P’s 200-day moving average will shine again by attracting enough buyers next week to push the indexes back into orbit, but I doubt that this would be a lasting situation. From my view, there are simply too many headwinds to support the bullish case for any length of time.

Have a great week.

Ulli…

————————————————————-

READER Q & A FOR THE WEEK

All Reader Q & A’s are listed at our web site!
Check it out at:

http://www.successful-investment.com/q&a.php

A note from reader Ron:

Q: Ulli: Starting to use your model portfolios! Do I assume that those positions you show as holds are still currently buys?

Thanks and have a great day!

A: Ron: The positions shown as “hold” are referring to the sell stops not to the portfolios themselves. Personally, I have been holding back deploying new money due to the recent sell off. I am looking to ease into PRPFX but have no plans, given current momentum numbers, to add any of the ETFs listed.

———————————————————-

WOULD YOU LIKE TO HAVE YOUR INVESTMENTS PROFESSIONALLY MANAGED?

Do you have the time to follow our investment plans yourself? If you are a busy professional who would like to have his portfolio managed using our methodology, please contact me directly or get more details at:

https://theetfbully.com/personal-investment-management/

———————————————————

Back issues of the ETF/No Load Fund Tracker are available on the web at:
https://theetfbully.com/newsletter-archives/

ETF/No Load Fund Tracker For Friday, June 24, 2011

Ulli ETF Tracker Contact

ETF/No Load Fund Tracker StatSheet

————————————————————-

THE LINK TO OUR CURRENT ETF/MUTUAL FUND STATSHEET IS:

https://theetfbully.com/2011/06/weekly-statsheet-for-the-etfno-load-fund-tracker-updated-through-6232011/

————————————————————

Market Commentary

Friday, June 24, 2011

ETFs HAULING SOUTH

Yesterday’s late rebound, following an early morning sharp selloff, gave the bulls some hope that the bad news out of Greece, as well as economic worries, was a bit overblown.

Today, the opposite happened, as an early morning rally succumbed with the major indexes closing near their lows for the day. It seemed that with so much global uncertainly, traders did not want to hold on to any long positions over the weekend.

That is probably not a bad idea considering that a new elephant of Italian descent suddenly showed up in the room.

Read More

Weekly StatSheet For The ETF/No Load Fund Tracker – Updated Through 6/23/2011

Ulli ETF Tracker Contact

ETF/Mutual Fund Data updated through Thursday, June 23, 2011

If you are not familiar with some of the terminology used, please see the Glossary of Terms.

1. DOMESTIC EQUITY MUTUAL FUNDS/ETFs: BUY— since 6/3/2009

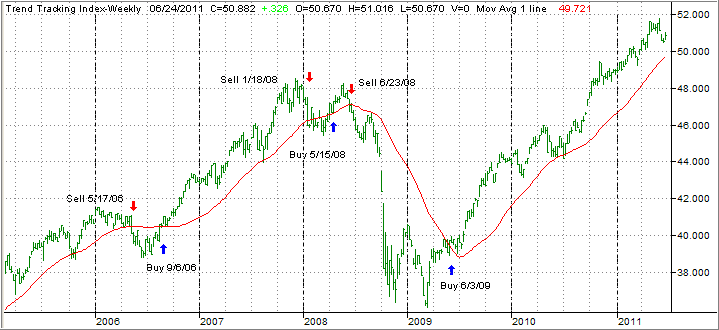
As announced via a blog post, on 6/2/2009, the TTI triggered a buy signal with an effective date of 6/3/2009. We will use the 7% trailing stop loss of our positions as an exit point or the crossing of the trend line to the downside, whichever occurs first.

As of today, our Trend Tracking Index (TTI—green line in above chart) has broken above its long term trend line (red) by +2.52%.

Read More

Major Market ETFs Manage A Turnround

Ulli Market Commentary Contact

By any measure, market activity looked pretty ugly this morning, as the major market ETFs opened sharply to the downside in what appeared to be the Bernanke hangover.

In addition, worries about domestic and global economies were supporting the plunge. However, the S&P 500’s 200-day moving average again proved to be a springboard, as buyers started to come in and a slow but steady turnaround materialized.

Read More

High Volume ETFs On The Cutline – Updated Through 6/22/2011

Ulli ETFs on the Cutline Contact

With the markets having staged a rebound over the past few trading days, it’s no surprise that this strength positively affected some of the High Volume Major Market ETFs, however, on balance, when looking at the big picture, it was a mixed bag.

To clarify, High Volume (HV) ETFs are defined as those with an average daily volume of $10 million or higher.

These ETFs are generated from my selected list of 90 that I use in my advisor practice. It cuts out the “noise,” which simply means it eliminates those ETFs that I would never buy because of their volume limitations. 

Let’s look not only at the winners, but also at those ETFs, whose positions worsened despite the positive market environment.

Improving their positions within the first 20 spots above the Cutline were:

XLY (Consumer Discretionary) from +7 to +19

VTI (Total Market Index) from +5 to +15

IWB (Russell 1000) from +6 to +14

SPY (S&P 500 Index) from +4 to +9

Just because these Major Market ETFs have moved up further into plus territory does not make them a buy, since most of their respective momentum numbers are still negative.

Slipping further below the trend line, or holding fairly steady at lower levels, despite an elevated market, were the following ETFs:

IEV (S&P Europe 350) from +1 to -5

RSX (Russia) from +11 to -6

IOO (S&P Global 100) from -3 to -9

VWO (Emerging Markets) from -14 to -11

BRF (Brazil Small Cap) from -16 to -15

First, take a look at the table and then read my latest commentary:

Read More

6 ETF Model Portfolios You Can Use – Updated through 6/21/2011

Ulli Model ETF Portfolios Contact

This week’s rebound helped 5 of our 6 ETF Model Portfolios to move higher, while the Income Portfolio (#5) retreated. That’s no surprise since its holdings were cut by 50% as two of the trailing sell stops were triggered during the recent slide. If momentum continues upward, I will re-instate these positions.

This caused a changing of the guards in terms of YTD performance. The top of the pecking order is now lead by the Aggressive Portfolio (#3) with the Trend Tracking Portfolio (#1) in close pursuit.

Again, the idea behind these models is not for you to be invested in the top performer but in a portfolio that represents ‘your’ personal risk tolerance – and not someone else’s.

Take a look at this week’s numbers:

Read More