Expanded ETF Master Cutline List – Updated through 7/29/2011

Ulli ETFs on the Cutline Contact

With the markets having sustained losses for 5 straight days, it’s no surprise that the number of ETFs hovering above the cutline has been severely reduced from the prior report.

This week, there are 188 ETFs listed above the cutline (down from 321) and 208 below it (up from 75), which is a clear indication of a change in market direction. Whether that will be sustained is still wide open and currently depends on the outcome of the debt ceiling debate. As I am writing this (Sunday afternoon), indications are surfacing that a compromise across party lines indeed may have been reached, but the final word has not been spoken yet.

Should this compromise materialize, we will certainly see a euphoric reaction rebound on Wall Street. However, how long this will last in the face of the recent poor GDP news, while a questionable jobs report is lurking on the horizon, is the big unknown.

Even as Wall Street got clobbered, some ETFs have resisted the selloff, as you can see in this new expanded ETF Cutline report:

Read More

Last Week In Review: ETF News And Blog Posts

Ulli ETF News Contact

In case you missed it, here’s a summary of the ETF topics that I posted to my blog during the week ending on 7/29/2011.

The drubbing continued, and the S&P 500 ended up losing 3.9% for the week. As I posted yesterday, we are within striking distance of breaking the S&P’s 200-day moving average to the downside, which will not bode well for equities.

Besides the uncertainty of the debt ceiling battle, looming large will also be Friday’s jobs report along with other economic data. This is not the time to be a hero and engage in bottom fishing; this is the time for portfolio preservation via my recommend trailing sell stop discipline.

My published Cutline tables and Model ETF Portfolios can give you an assist by indentifying weakness and strength in various market segments so that you can make better investment decisions by avoiding exposure in those areas that are trending down.

This week, we covered the following:

“Reviewing The ETF Equivalent Of PRPFX”

“ETF Leaders And Laggards – For The Week Ending 7/29/2011”

“ETF/No Load Fund Tracker For Friday, July 29, 2011”

“Weekly StatSheet For The ETF/No Load Fund Tracker – Updated Through 7/28/2011”

“Market Commentary – High Volume ETFs On The Cutline – Updated Through 7/27/2011”

“6 ETF Model Portfolios You Can Use – Updated through 7/26/2011″

“Expanded Report: Mutual Funds On The Cutline – Updated as of 7/25/2011”

“NEW: Expanded ETF Master Cutline List – Updated through 7/22/2011”

Reviewing The ETF Equivalent Of PRPFX

Ulli ETF News Contact

Much has been written about the creation of an ETF equivalent of the popular Permanent Portfolio fund (PRPFX). As you know from my Wednesday ETF Model Portfolio listings, a combination of PRPFX with a variety of ETFs has been my preferred mode of operation during these times of uncertainty.

From the articles covering the subject, none of them offered a graphic performance comparison to see how well an ETF equivalent would track the original PRPFX fund.

With the help of reader Richard, who is a far better chartist than I am, we created the following ETF combination and tracking chart while, at the same time, comparing the result to the S&P 500 (SPY).

Take a look:

Read More

ETF Leaders And Laggards – For The Week Ending 7/29/2011

Ulli ETF Leaders & Laggards Contact

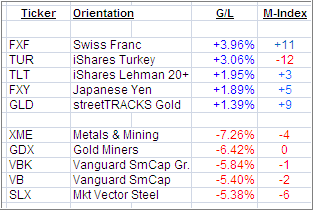
Here is a quick ETF review of the past week’s winners and losers from my High Volume ETF Master list:

As the markets got clobbered last week, the flight to safety was an obvious choice for those who buy and hold and/or have no exit strategy.

Consequently, in the ‘Leader’ section, the Swiss Franc (FXF) ruled, followed by long-term Treasuries (TLT) and Gold (GLD), which has proven to be a good defensive holding against global uncertainty for quite some time.

On the losing side of the equation, gold miners suffered steep losses along with SmallCap equity ETFs

Overall, the domestic equity markets are reaching a critical point. Here are some of the major indexes and their positions relative to their long-term trend lines, which I recalculated after Friday’s close:

Read More

07-29-2011

Ulli Newsletter Archives Contact

ETF/No Load Fund Tracker StatSheet

————————————————————-

THE LINK TO OUR CURRENT ETF/MUTUAL FUND STATSHEET IS:

https://theetfbully.com/2011/07/weekly-statsheet-for-the-etfno-load-fund-tracker-updated-through-7282011/

————————————————————

Market Commentary

Friday, July 29, 2011

HOW LOW CAN YOU GO?

The major market ETFs took it on the chin this week, as continued indecision and confusion about the debt ceiling debacle put traders in a selling mood.

It was straight downhill for five days in a row, which brings up the question as to where support might kick in to stop the bleeding. As far as the S&P 500 is concerned, we have broken through the 50-day moving average by -1.47% and are honing in on the index’s 200-day moving average, which stands at 1,281. Actually, we came close to that level today, and it acted as springboard.

Whether this number will hold is wide open and will depend on further economic news along with a solution to the debt ceiling issue. Obviously, this has been the most talked about topic, and questions abound as to what will happen if the government actually defaults.

While there are more questions than answers, you might want to review one man’s opinion in Not Raising the Debt Ceiling Would be a Blessing, by Mish of Global Economic Trends.

Today’s dismal close came on the heels of the latest economic uppercut, as it was reported that the U.S. economy barely grew and past GDP estimates were severely reduced.

As a reader of this blog, that announcement should not have come as a surprise, as I have been harping on the fact for almost 2 years that there was no economic recovery; it was all a stimulus induced mirage. In the end, nothing was accomplished other than that we owe a few trillion dollars more, but who is counting…

For the week, the S&P 500 gave back 3.9%, while the Dow dropped 4.2% and Nasdaq surrendered 3.58%. For the month, the S&P lost 2.2%.

I have been talking about these times of uncertainty for a couple of year now, and how portfolio adjustments, along with a disciplined exit strategy, are necessary for survival. For example, I have been a loud proponent of investing in the Permanent Portfolio fund (PRPFX) as a core holding, which has turned out to be the right decision so far.

For the past week, PRPFX lost a modest 0.5% while, for the month, it actually gained 2.88%, giving us the portfolio stability I was looking for. That is a big difference to the S&P’s 2.2% loss.

Our Trend Tracking Indexes (TTIs) continue to offer a mixed picture, as the domestic TTI remains in bullish territory, while its international cousin has sunk a little further below its trend line into the bearish camp. Here are today’s closing numbers:

Domestic TTI: +3.04% (last week +4.70%)
International TTI: -1.17% (last week +0.91%)

Next week, more earnings and economic reports will take a back seat to the continued debt ceiling circus. Any resolution is bound to cause a euphoric reaction on Wall Street. On the other hand, if negative sentiment prevails and a solution is not found, we may very well test and break through the psychologically important 200-day moving average on the S&P 500.

My suggestion is the same as always: Be prepared for either scenario, watch your sell stops and execute them when necessary.

Have a great week.

Ulli…

————————————————————-

READER Q & A FOR THE WEEK

All Reader Q & A’s are listed at our web site!
Check it out at:

http://www.successful-investment.com/q&a.php

A note from reader Al:

Q: Ulli: I hope all goes well for you, and I continue to enjoy your newsletter and good perspective and advice.

You may have already seen the latest assessment of the debt/credit mess in Europe, and by necessity…the US; I hope it doesn’t spoil your lunch.

I hope to be a bit wiser with fund allocation, should things go from bad to worse…or worser?

A: Al: There is no reason to worry about things you can’t control. Just make sure you have an exit strategy in place, and your investing life will be much easier.

———————————————————-

WOULD YOU LIKE TO HAVE YOUR INVESTMENTS PROFESSIONALLY MANAGED?

Do you have the time to follow our investment plans yourself? If you are a busy professional who would like to have his portfolio managed using our methodology, please contact me directly or get more details at:

https://theetfbully.com/personal-investment-management/

———————————————————

Back issues of the ETF/No Load Fund Tracker are available on the web at:

https://theetfbully.com/newsletter-archives/

ETF/No Load Fund Tracker For Friday, July 29, 2011

Ulli ETF Tracker Contact

ETF/No Load Fund Tracker StatSheet

————————————————————-

THE LINK TO OUR CURRENT ETF/MUTUAL FUND STATSHEET IS:

https://theetfbully.com/2011/07/weekly-statsheet-for-the-etfno-load-fund-tracker-updated-through-7282011/

————————————————————

Market Commentary

Friday, July 29, 2011

HOW LOW CAN YOU GO?

The major market ETFs took it on the chin this week, as continued indecision and confusion about the debt ceiling debacle put traders in a selling mood.

It was straight downhill for five days in a row, which brings up the question as to where support might kick in to stop the bleeding. As far as the S&P 500 is concerned, we have broken through the 50-day moving average by -1.47% and are honing in on the index’s 200-day moving average, which stands at 1,281. Actually, we came close to that level today, and it acted as springboard.

Whether this number will hold is wide open and will depend on further economic news along with a solution to the debt ceiling issue. Obviously, this has been the most talked about topic, and questions abound as to what will happen if the government actually defaults.

Read More