Expanded Report: Mutual Funds On The Cutline – Updated as of 7/25/2011

Ulli Mutual Funds On The Cutline Contact

As announced last week, the mutual fund cutline report has been expanded to show more funds that have broken above the cutline (trend line).

Currently, there are 793 funds in my data base, of which I am listing the first 250 that are hovering above the cutline. On the bear market side, or below the cutline, I am tracking 76, out of which the first 20 are shown.

This will help you to follow funds you are interested in as they cross the trend line into bullish territory and follow them as either their momentum numbers improve or, depending on market direction, they succumb and drop back below the line. If there is enough reader interest, I can further expand this report to show all 793 funds.

Take a look at this week’s mutual fund cutline report:

Read More

NEW: Expanded ETF Master Cutline List – Updated through 7/22/2011

Ulli ETFs on the Cutline Contact

As recently announced, I have expanded the previously limited ETF Cutline list to include all funds featured in Thursday’s StatSheet, or more specifically the ETF Master List.

In this week’s report, there are 321 ETFs above the cutline (trend line) and 75 below it, of which 20 are listed. This new and expanded version will now make it very easy for you to follow those ETFs that have crossed their trend line to the upside and are improving their momentum numbers.

For example, if your are starting at the cutline on page 8 and are moving up, you will find the first  ETF with all positive momentum numbers and 0.00% in the DrawDown column (DD%) to be FXY in the +153 position. The next one would be QQQ in the +229 position and so on. Once you reach page 1, you’ll see several candidates with positive numbers across, but you’ll also notice that they have moved above their trend line (%M/A column) by considerable percentages.

As a result of the market having had an up week, more ETFs have improved their positions and momentum numbers during the past 5 trading days.

Take a look at this new expanded ETF Cutline report:

Read More

Last Week In Review: ETF News And Blog Posts

Ulli ETF News Contact

In case you missed it, here’s a summary of the ETF topics that I posted to my blog during the week ending on 7/22/2011.

What the market lost two weeks ago, it made back during the last 5 trading days, putting us back to the level of where we were on July 8th, as far as the S&P 500 is concerned.

Despite the rally, global and domestic debt issues, especially the battle over raising the debt ceiling, may keep a lid on further market advances. However, I think a relief rally maybe in the cards, should a framework be put in place to quickly resolve this domestic issue prior to the August 2nd deadline.

My published Cutline tables and Model ETF Portfolios can give you an assist by indentifying weakness and strength in various market segments so that you can make better investment decisions by avoiding exposure in those areas that are trending down.

This week, we covered the following:

Read More

Downside Portfolio Protection

Ulli Sell Stops Contact

The Street featured an article titled “Simple Ideas for Downside Portfolio Protection.”

As I read it, I got the distinct feeling that there was not much conviction behind the suggestions.

I have seen similar articles with the same topic before, and they all appear to say “yes, you can do these things, but…” And the big “but” is this: “While you will lose less money in a bear market implementing these suggestions, you will miss out on most of the upside when the market recovers.”

As if that is the worst thing that could happen to you. I wonder if any of these writers ever put a pencil to the task and analyze if what they are saying really makes sense.

Let’s look at the 3 examples from the above article, and I will calculate the numbers for you. You will be amazed at the outcome:

Read More

ETF Leaders And Laggards – For The Week Ending 7/22/2011

Ulli ETF Leaders & Laggards Contact

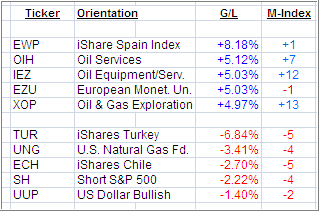
Here is a quick ETF review of the past week’s winners and losers from my High Volume ETF Master list:

If you like to ride the ETF rollercoaster, Spain (EWP) would be your primary choice. It has moved from leader to laggard consistently over the past few weeks, which is clearly a sign that a long-term trend can’t be identified.

EWP has barely moved out of bear market territory and hovers above its long-term trend line by a meager +0.24%. Same can be said of the entire European Union (EZU), which also has bounced along its long-term trend line and has crossed it to the upside by +0.14%.

Europe is clearly driven by the latest news on its debt circus, which makes it a great uncertainty. I would not touch any of these ETFs at this time.

Oil and Gas related ETFs did well as this week’s returns show. However, high volatility is an ever present danger, so you might want to consider these areas only if you have an aggressive component in your risk profile. The above is simply a summary, so be sure to consult the current StatSheet for more details.

Disclosure: No holdings

07-22-2011

Ulli Newsletter Archives Contact

ETF/No Load Fund Tracker For Friday, July 22, 2011

————————————————————-

THE LINK TO OUR CURRENT ETF/MUTUAL FUND STATSHEET IS:

https://theetfbully.com/2011/07/weekly-statsheet-for-the-etfno-load-fund-tracker-updated-through-7212011/

————————————————————

Market Commentary

Friday, July 22, 2011

MAJOR MARKET ETFs BUNGEE-JUMP BACK

After losing 2.1% the prior week, the major market ETFs shifted into rally mode with the S&P 500 gaining 2.2%, which brings us back to the level from 2 weeks ago.

This past Tuesday, the markets received an assist from Apple’s blowout earnings and a new Senate budget plan. Upward momentum picked up stream again on Thursday, when more talk of debt solutions in the U.S. and Europe, along with a big health care merger, provided the necessary ammunition.

In the end, no real solutions to the debt issues that ail the world were found, but the markets managed to hang on to its gains so far. Back on the front burner domestically was the continued jawboning about the nation’s debt limit with no tangible results.

Following the rebound, our Trend Tracking Indexes (TTIs), moved back further into bullish territory by the following percentages:

Domestic TTI: +4.70% (last week +3.82%)
International TTI: +0.91% (last week -1.28%)

As you can see, the International TTI has now crawled back out of the basement and has crossed its trend line to the upside—again. We just finished doing this dance, as this indicator has no clear direction and has bounced slightly below and above this dividing line between bullish and bearish territory in the recent past.

We successfully avoided the last potential whipsaw signal and will try to go for a ‘two-peat.’ What that means is that, despite this move above the line, I will wait for a few trading days to see if this is just another head fake or the real thing before issuing a new ‘Buy’ for that arena. This is the time to be patient.

Next week, we’ll be facing a host of economic reports including Consumer Confidence, New Home Sales, Durable Orders and GDP, just to name a few. Earnings season will pick up speed, and I am sure, the European debt crisis will present us with new varieties of how to kick the can down the road and not face realities head on.

It promises to be another interesting week. As always, be sure to have your exit strategy in place, so you don’t stress when the heat is on.

Have a great week.

Ulli…

————————————————————-

READER Q & A FOR THE WEEK

All Reader Q & A’s are listed at our web site!
Check it out at:

http://www.successful-investment.com/q&a.php

A note from reader Leslie:

Q: Ulli: Is there an easy way to reach your updated TTIs and your associated comments?  Since the change in your blog, I can no longer easily find them.

A: Leslie: Nothing has changed other than the format of my blog. The weekly StatSheet is still being published every Thursday, and the Market commentary and StatSheet info are being mailed out every Friday.


If you like to access the latest version directly, go to www.TheETFBully.com, look for the heading “ETF Newsletter” on the black ribbon in the header and select “Latest Newsletter.” That will give you easy access to the latest StatSheet.

Hope that helps.

———————————————————-

WOULD YOU LIKE TO HAVE YOUR INVESTMENTS PROFESSIONALLY MANAGED?

Do you have the time to follow our investment plans yourself? If you are a busy professional who would like to have his portfolio managed using our methodology, please contact me directly or get more details at:

https://theetfbully.com/personal-investment-management/

———————————————————

Back issues of the ETF/No Load Fund Tracker are available on the web at:

https://theetfbully.com/newsletter-archives/