ETF Leaders And Laggards – For The Week Ending 6/3/2011

Ulli ETF Leaders & Laggards Contact

Here are this past week’s top 5 winners and losers from my High Volume ETF Master List:

With the domestic markets having sold off sharply, some of the country ETFs bucked the trend and headed higher. To a lesser degree this is also reflected in the broadly based VWO, which gained +0.48% as opposed to the SPY’s loss of -2.31%.

The weak economic news pressured especially retail and transportation ETFs.

Disclosure: Holdings in VWO

Reader Q & A: Which ETF Model Portfolio Is Right For Me?

Ulli Reader feedback Contact

Several readers emailed recently trying to determine which one of the six ETF model portfolios might be right for them. Chuck’s message is very typical. Here’s what he had to say:

I am ready to invest in one of the six model ETF portfolios that you are suggesting. Last week I favored #1 Trend Tracking. After reading your post last Wednesday, it appears that other models took the lead, so to speak, but I still like #1.

I have accumulated some $s to invest. Should I jump in now or hold my powder until later? I guess I would describe myself as a moderate risk taker, but I have to deal with my wife, whose idea of investing is $s in a coffee can under the bed!

Read More

ETF/No Load Fund Tracker For Friday, June 3, 2011

Ulli ETF Tracker Contact

ETF/No Load Fund Tracker StatSheet

————————————————————-

THE LINK TO OUR CURRENT ETF/MUTUAL FUND STATSHEET IS:

https://theetfbully.com/2011/06/weekly-statsheet-for-the-etfno-load-fund-tracker-updated-through-6022011/

————————————————————

Market Commentary

Friday, June 3, 2011

WHERE’S THE DEADCAT BOUNCE?

We left the month of May on a high note and, only one day later, stumbled into the month of June with the major indexes plunging to their lowest levels since last summer. The weak ADP report was the main culprit and forced economists to hastily revise their payroll growth estimates.

Other economic reports lacked positives and combined forces by leaving the market in the dust, as I posted on Tuesday.  Usually, a sharp sell-off is followed by a bounce, but that did not happen, very likely in anticipation of Friday’s uncertain jobs report.

While the markets held fairly steady on Thursday, a rebound never materialized. Today’s jobs numbers showed that the economy has hit “a brick wall,” as one analyst put it. In light of the fact that only 54,000 new jobs were created, and the unemployment rate inched up to 9.1%, it was no surprise to see the major indexes head straight down at the opening.

Read More

Weekly StatSheet For The ETF/No Load Fund Tracker – Updated Through 6/02/2011

Ulli ETF StatSheet Contact

ETF/Mutual Fund Data updated through Thursday, June 2, 2011

If you are not familiar with some of the terminology used, please see the Glossary of Terms.

1. DOMESTIC EQUITY MUTUAL FUNDS/ETFs: BUY— since 6/3/2009

As announced via a blog post, on 6/2/2009, the TTI triggered a buy signal with an effective date of 6/3/2009. We will use the 7% trailing stop loss of our positions as an exit point or the crossing of the trend line to the downside, whichever occurs first.

As of today, our Trend Tracking Index (TTI—green line in above chart) has broken above its long term trend line (red) by +4.04%.

Read More

High Volume ETFs On The Cutline – Updated Through 6/1/2011

Ulli ETFs on the Cutline Contact

Despite yesterday’s sharp sell-off, the High Volume ETFs were affected very little, at least if you measure it from last Wednesday’s report.

To clarify, High Volume (HV) ETFs are defined as those with an average daily volume of $10 million or higher.

These ETFs are generated from my selected list of 90 that I use in my advisor practice. It cuts out the “noise,” which simply means it eliminates those ETFs that I would never buy because of their volume limitations.

With the S&P 500 only having dropped 5 points since last Wednesday, the changes in this week’s HV ETF Cutline report were modest with several ETFs actually climbing up the ladder:

Vanguard Europe Pacific (VEA) from +14 to +20

Vanguard All World-Ex.-U.S. (VEU) from +13 to +19

South Africa (EZA) from -1 to +17

Diversified emerging markets (VWO) from +4 to +14

China (FXI) from -2 to +4

Russia (RSX) from -3 to +2

Bucking the trend, and following the market down during yesterday’s pullback, was PGF (Financials), which dropped from +8 to +3.

PGF (Financials) has been the only ETFs above the cutline with positive momentum numbers, including a low DD% number of -0.87%, for a while. Its 4-wk performance has dropped slightly into the negative (-0.05%), but if you are holding it, it’s still a buy, subject to its trailing sell stop.

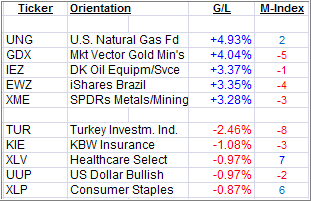
Take a look at the table:

Read More

Major Market ETFs Take It On The Chin

Ulli Market Commentary Contact

While most individual economic reports have only a limited effect on market direction, today’s triple combination of nothing but disappointing data knocked the major indexes to the mat. And, unlike many instances in the past, there was no afternoon rebound, as the chart (courtesy of MarketWatch.com) shows.

First, ADP’s national employment report came in weaker than worst expectations, which now makes Friday’s unemployment numbers a great uncertainty. Although they are not directly related to the ADP’s figures, they tend to move somewhat in tandem.

Second, the Supply Management’s manufacturing index fell well below the level that economists had expected. While the index remains above 50, and thereby in growth mode, manufacturing is just not growing as fast as it had been.

Third, Greece’s debt was downgraded another notch to a deeper degree of junk. That means that a default within a few years is virtually a guarantee.

Read More