How To Track Your Sell Stops

Ulli Uncategorized Contact


A convenient and efficient way to track sell stops has been on many readers’ minds. Tom had this to say:

How can I get a fund or ETF price automatically downloaded into my personal investment spreadsheet?

Setting sell stops based on new highs, etc. requires finding the price and manually entering it in the spreadsheet everyday. When I don”t look every day, I know I miss something.

Is this possible without subscribing to some high priced electronic quote system, etc.? (Free is good!) It seems with the tracking you do, there must be an obvious way to do this that I overlook.

I have Schwab and Fidelity, but I have not found a way to do this from their websites. There must be some software, program, or website that will pick up this info and put it into a spread sheet on your PC.

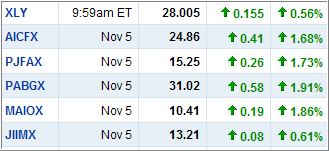
For many years, I have used a simple way to get that task accomplished. I have set up “My Yahoo” as a personalized page to track daily news events. Part of that set up includes a listing of funds/ETfs that I currently own and follow on a daily basis.

The funds/ETFs are listed by ticker, date, price and change for the day as the table above shows. It also includes a feature that lets you export this list to a spreadsheet, neatly arranged in columns to be copied and pasted wherever you like.

In your spreadsheet, you could use Tab1 to paste in all data, as I do, and use Tab2 to have your current holdings listed and formatted. By linking the prices in Tab1 to Tab2, you only need to go though one copy and paste process and your holdings are instantly updated.

Afterwards, I simply view my column titled high price to see if it needs updating, which I do manually. This obviously only comes into play during a market rally when new highs have been made.

Here’s what my matrix looks like using an actual purchase and a sell stop that got triggered:


[Double click to enlarge]

The columns are pretty self explanatory. The “High” column needs to be updated when prices make new highs, while the “Action” column is programmed to alert me to any changes in the status. In other words, when the 7% sell stop level has been broken, the “Hold” switches to “Sell,” giving me an easy identifiable alert when looking at a large list of items.

While I use other custom data bases to track these sell stops for a large number of funds/ETFs, this spreadsheet along Yahoo’s export feature is simple and effective and requires minimum time on your part once it is set up.

No Load Fund/ETF Tracker updated through 11/5/2009

Ulli Uncategorized Contact

My latest No Load Fund/ETF Tracker has been posted at:

http://www.successful-investment.com/newsletter-archive.php

Our Trend Tracking Index (TTI) for domestic funds/ETFs has now crossed its trend line (red) to the upside by +7.52% keeping the current buy signal intact. The effective date was June 3, 2009.


The international index has now broken above its long-term trend line by +12.24%. A Buy signal was triggered effective May 11, 2009. We are holding our positions subject to a trailing stop loss.

[Click on charts to enlarge]
For more details, and the latest market commentary, as well as the updated No load Fund/ETF StatSheet, please see the above link.

Commission Free ETFs

Ulli Uncategorized Contact

Charles Schwab Corp. has finally entered the crowded Exchange Traded Fund arena as MarketWatch reports in “Schwab lists first ETFs:”

The financial-services giant, which boasts nearly 8 million brokerage accounts, listed four ETFs on the NYSE Arca exchange. The ETFs, which are baskets of securities that trade like individual stocks, feature low fees and represent a clear challenge to industry heavyweights State Street Corp., Vanguard Group and Barclays Global Investors, which is being acquired by BlackRock Inc.

Schwab is trying to jumpstart its ETF business by offering commission-free online trades for its clients.

Peter Crawford, senior vice president at Schwab, in a telephone interview Tuesday said the ETFs’ low expense ratios and free trading offer “an incredible price” for investors. Schwab, which has about $1.3 trillion in client assets, will benefit from its strength as a mainline distributor of financial products, he said.

The inaugural Schwab ETFs that listed Tuesday are Schwab U.S. Broad Market ETF (SCHB) , Schwab U.S. Large-Cap ETF (SCHX 24.82) , Schwab U.S. Small-Cap ETF (SCHA) and Schwab International Equity ETF(SCHF) . The first two have expense ratios of 0.08%, while the others charge 0.15%.

They undercut similar ETFs on price, and any pressure on competitors to cut fees is a welcome development for investors, experts say.

For example, the largest ETF, State Street’s SPDR S&P; 500 ETF (SPY) , has an expense ratio of 0.09%, as does the iShares S&P; 500 Index Fund (IVV). The Vanguard Large-Cap ETF levies fees of 0.13%.

Crawford, the Schwab executive, said the firm’s ETF push will be helped by its client relationships, particularly its network of about 6,000 independent advisers. Even before it launched its own ETFs, Schwab was a major trading platform for the products and the company estimates between 20% and 25% of retail ETF assets are held by Schwab clients.

The company plans to roll out four more broad-based stock ETFs next month, tracking U.S. large-cap growth, U.S. large-cap value, international small-caps and emerging markets. The tracking indexes are maintained by Dow Jones and FTSE.

Crawford declined to comment on specific plans for additional Schwab ETFs, citing regulatory restrictions. However, he said the company will focus on “the major categories, which account for the bulk of assets,” rather than niche products.

“There’s nothing fancy about the new Schwab ETFs,” said Gabriel, the analyst. There are already a “plethora” of similar funds on the market, so Schwab will compete head-to-head with industry leaders BGI, State Street and Vanguard.

“With little differentiation among ETFs offering similar exposures, Schwab’s strong brand name and its product pricing will be critical to the firm’s success in the budding ETF industry,” Gabriel wrote in a recent Morningstar commentary.

“Investors should welcome Schwab’s entrance into the ETF universe,” he added. “While there’s nothing earth-shattering about the exposures offered by the new Schwab ETFs, the relatively low expenses that Schwab plans to charge should at least keep the big boys in the industry honest.”

[Emphasis added]

I always welcome new products in the ETF marketplace, especially when they are being introduced with lower costs to investors. Even though, I use Charles Schwab & Co. as custodian for my clients’ assets, I will not immediately jump at these new offerings.

My reasoning is the same for all newly created ETFs. I want to see price history for some 6-9 months so that I can better evaluate the trend. At the same time, I want to make sure that enough interest has been created so that the volume has increased to acceptable levels.

To invest in any unproven ETF with low volume is simply asking for trouble. The bid/ask spreads are high, and you may not be able to liquidate your holdings quickly without too much slippage in price.

In other words, you are giving up control, which is something we as trend followers try to avoid.

Misunderstanding The Trend Tracking Index

Ulli Uncategorized Contact

Reader Tom had this comment:

A provoking question I thought about is: How do I get a fund or ETF based on your TTI? An ETF or fund with the return of your Domestic TTI of 8.53% would be nice.

Tom is missing the purpose of the Trend Tracking Index (TTI). It is designed to determine market direction so that we can easily identify whether the overall long-term trend is up or down. Nothing more and nothing less.

The TTI does not have a return. The percentage stated is simply its current position above or below its trend line, which changes daily with the market movement. It does not represent any gain or loss.

To see how domestic ETFs have fared since our latest Buy signal on 6/3/09, simply reference the StatSheet. If you look at the latest issue, you will note the second column from the right titled “Since 6/3/09.” That represents the performance for this cycle.

To sum it up, use the TTI first to determine market direction and then the StatSheet to select funds based on momentum rankings. Keep in mind that it is not always advisable to pick the top ranked funds/ETFs. While they will give you great firepower, if the markets move your way, they will also give back any gains the fastest when a pullback occurs.

I personally always drop down in the fund/ETF pecking order to find those that give me the best of both worlds: Decent gains and some resistance to sell offs.

Losing Steam

Ulli Uncategorized Contact


One look at the chart tells you that yesterday could have been a real bad day in the markets. An early rally of 145 points in the Dow was completely wiped out as the markets briefly dipped into negative territory as a result of a sharp sell-off in the financials.

Things looked pretty bleak at that moment; however, decent economic news proved to be the savior and a rebound and pulled the major indexes out of the doldrums. Uncertainty about market direction is bound to continue especially in view of the Fed meeting and Friday’s all important employment report.

I took the opportunity today to liquidate those holdings which had triggered their preset sell stop points during last Friday’s drubbing. Only time will tell if this move is in sync with the overall trend. If not, and the markets resume upward momentum, I will look for new entry points. For the time being, I am comfortable with a little less exposure to equities.

As an aside, Mish at Global Economics wrote a nice piece titled “Is Debt-Deflation Just Beginning.” It’s a bit lengthy but well worth the read if the deflation/inflation scenario is of any interest to you.

I am in the camp of those who believe that deflation will be with us for years to come, before any inflationary scenario can actually play itself out.

Sell Stops For All Positions All Of The Time

Ulli Uncategorized Contact

In response to a recent post, reader Don provided this feedback a week ago:

This is in response to “How High Can We Go“, and the current overbought condition of the market. John Hussman has a superb article on this, which you can read here.

The title alone got my attention: The Stock Market Has Never Been This (Intermediate-Term) Overbought.

As a result, I’ve looked over all of my holdings and tightened up my stops, at least to just under the early October lows before we went to new highs.

But I have a related thought, for what it’s worth. I too have looked at thousands of charts over the last few decades, and have read the key works on charting, and as important as the basic concepts may be, I believe it’s essential to allow for the occasional Black Swan.

I have seen a handful of charts in my life that are similar to your current TTI index, which were the basis of liquidating my long positions (and even going short in some cases), which were followed by gaps to new highs (above the high point on your chart), which caused devastating losses for my short positions, not to mention a whole lot of wailing and gnashing of teeth over the profits not made on my prior bird in the hand long positions.

In terms of how to deal with the current market, instead of just making sure that one has stops in place because it’s likely that the market’s going to roll over soon, I think one should have stops in place all the time–including, and perhaps especially–in those markets in which it appears least likely that they’re going to roll over.

[My emphasis]

Yes indeed, the article by John Hussman is a worthwhile read.

Take a look at the highlighted sentence again. I want to make sure that there is no misunderstanding. Whenever you initiate any position (other than money market), you need to track your trailing sell stops no matter what the appearance of market behavior tells you.

Reader Don seems to imply that he does not have stops in place for those holdings that don’t appear likely to roll over, as he puts it.

That is not correct. If you are working with sell stops, the rule simply is to “track sell stops for all positions all of the time.” Never get caught without one, because you don’t know when and where the next shoe will drop.