09-30-2011

Ulli Newsletter Archives Contact

ETF/No Load Fund Tracker Newsletter For Friday, September 30, 2011

ETF/No Load Fund Tracker StatSheet

————————————————————-

THE LINK TO OUR CURRENT ETF/MUTUAL FUND STATSHEET IS:

https://theetfbully.com/2011/09/weekly-statsheet-for-the-etfno-load-fund-tracker-newsletter-updated-through-9292011/

————————————————————

Market Commentary

Friday, September 30, 2011

DEEPER INTO BEAR MARKET TERRITORY

The month is over and so is a horrific quarter. Equities have now dropped for five months in a row, as the worries du jour seem to deepen.

For one, the debt crisis in Europe shows no major signs of improvement other than the occasional band aid approach which, once it hits the headlines, seems to give a temporaty lift to the global markets, which appear to be starved for anything that could justify a rally.

Second, the Chinese economic is showing signs of weakening (3rd monthly decline in manufacturing) with the copper market, which is an indicator of prospective manufacturing activity, getting slammed at the tune of -25% in September. Copper had lost -6.1% in August.

Third, Europe’s engine that could, Germany, is slowing down as well, as a surprising drop in retails sales took the starch of their equity market.

Today’s late selling spree just deepened the move into bear market territory and worsened the past quarter’s returns. While all major indexes lost, the benchmark S&P 500 dropped -7.18% for the month and gave back -14.33% for the quarter, which makes it the worst quarter since the 2008-09 financial crisis.

While gold managed to gain +7.95% for the quarter, it does not tell the entire story as it lost -11.43% in September. That late drop hurt our core holding, PRPFX, the final 15% of which we disposed today.

We are now out of equities altogether, but still have a few isolated bond holdings for selected clients.

Our Trend Tracking Indexes (TTIs), especially the domestic TTI, seems to finally have caught up with the reality that an economic slowdown is unavoidable, which will result in lower equity prices. Here are today’s closing numbers:

Domestic TTI: -1.13% (last week -0.32%)
International TTI: -13.26% (last week -14.07%)

Of course, there is always the chance that October, along with the rest of the year, can show better results; but it can also be a lot worse.

Depending on the upcoming earnings season, especially the all important forward guidance, and the situation in Europe, we could see an upward spike again. However, since we’ve been in this 100 point trading range in the S&P 500 for some 2 months, I would not put any value on rallies that merely bring us back to the upper end.

Remember, Trend Tracking is supposed to get us onboard major trends and not minor ones. As time goes on, I will further elaborate as to where new entry points might be, however, at this point in time, I can simply not envision anything else but dead cat bounces. If circumstances change, you can be assured that I will change my view as well.

Have a great week.

Ulli…

————————————————————-

READER Q & A FOR THE WEEK

All Reader Q & A’s are listed at our web site!
Check it out at:

http://www.successful-investment.com/q&a.php

A note from reader Ian:

Q: Ulli: I have a quick question for you, which goes back to early September. I have half of my positions in cash as I was stopped out. The other half is still in PRPFX. I haven’t sold, but you called a domestic equity sell.

If I understand correctly, I should sell PRPFX and go all cash or hedge it with a bear fund?  Is there any harm in riding PRPFX out until there’s more of a downtrend? I really enjoy your blog. You’ve saved me a boatload of money!

A: Ian: Sure, absolutely; since your question came in a few weeks ago, your last line of defense to take action is once PRPFX crosses its own trend line to the downside or has come off its high my more than 7%, both of which have now happened. Therefore, PRPFX is a ‘Sell’ according to my trend tracking rules.

———————————————————-

WOULD YOU LIKE TO HAVE YOUR INVESTMENTS PROFESSIONALLY MANAGED?

Do you have the time to follow our investment plans yourself? If you are a busy professional who would like to have his portfolio managed using our methodology, please contact me directly or get more details at:

https://theetfbully.com/personal-investment-management/

———————————————————

Back issues of the ETF/No Load Fund Tracker are available on the web at:
https://theetfbully.com/newsletter-archives/

ETF/No Load Fund Tracker Newsletter For Friday, September 30, 2011

Ulli ETF Tracker Contact

ETF/No Load Fund Tracker StatSheet

————————————————————-

THE LINK TO OUR CURRENT ETF/MUTUAL FUND STATSHEET IS:

https://theetfbully.com/2011/09/weekly-statsheet-for-the-etfno-load-fund-tracker-newsletter-updated-through-9292011/

————————————————————

Market Commentary

Friday, September 30, 2011

DEEPER INTO BEAR MARKET TERRITORY

The month is over and so is a horrific quarter. Equities have now dropped for five months in a row, as the worries du jour seem to deepen.

For one, the debt crisis in Europe shows no major signs of improvement other than the occasional band aid approach which, once it hits the headlines, seems to give a temporaty lift to the global markets, which appear to be starved for anything that could justify a rally.

Second, the Chinese economic is showing signs of weakening (3rd monthly decline in manufacturing) with the copper market, which is an indicator of prospective manufacturing activity, getting slammed at the tune of -25% in September. Copper had lost -6.1% in August.

Third, Europe’s engine that could, Germany, is slowing down as well, as a surprising drop in retails sales took the starch of their equity market.

Today’s late selling spree just deepened the move into bear market territory and worsened the past quarter’s returns. While all major indexes lost, the benchmark S&P 500 dropped -7.18% for the month and gave back -14.33% for the quarter, which makes it the worst quarter since the 2008-09 financial crisis.

Read More

Weekly StatSheet For The ETF/No Load Fund Tracker Newsletter – Updated Through 9/29/2011

Ulli ETF StatSheet Contact

ETF/Mutual Fund Data updated through Thursday, September 29, 2011

If you are not familiar with some of the terminology used, please see the Glossary of Terms.


1. DOMESTIC EQUITY MUTUAL FUNDS/ETFs: SELL — since 8/9/2011

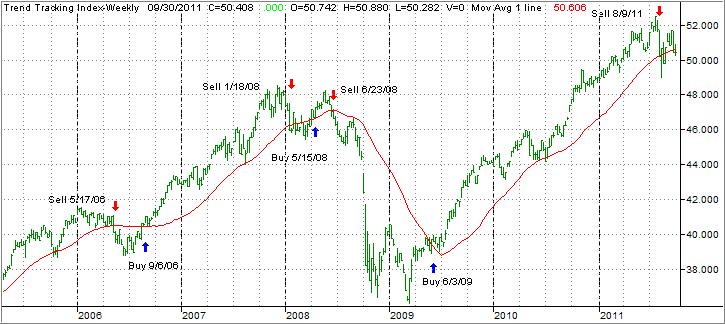
The domestic TTI broke through its long-term trend line generating a Sell for this area effective 8/9/2011. Over the recent past, we’ve seen the TTI hovering slightly below and above this dividing line between bullish and bearish territory. I will not issue a new Buy signal until this index has clearly pierced the trend line to the upside and has remained there.

As of today, our Trend Tracking Index (TTI—green line in above chart) has broken back below its long term trend line (red) by -0.32%.

Read More

Rally—Selloff—Rebound; Equity ETFs End Up Higher On Volatile Day

Ulli Market Commentary Contact

[Chart courtesy of MarketWatch.com]

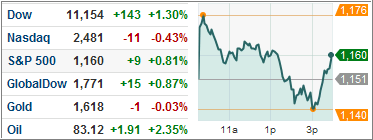
Volatility took on a new meaning today, as the Dow raced to an immediate 260 point gain right after the open, then tanked during the mid-day session and actually dropped into negative territory, before a last hour rebound saved the day.

This type of market activity is clearly sign of confusion about the uncertain global economic outlook along with questionable news about the outcome of the European debt crisis.

Early enthusiasm about German lawmakers approving to expand the European Financial Stability Facility Fund (EFSF) drove global markets higher, but worries about the still overwhelming task at hand, including getting agreements from all 17 EU nations, took the starch out of the rally and down we went. According to reports, short covering may have played a role in aiding the last hour recovery.

Read More

New Posting Schedule

Ulli Market Review Contact

With equities not going anywhere and chances of a bear market increasing, I will adjust my posting schedule to better be in tune with the information you need. That means I will, for the time being, focus more on relevant market commentary, along with changes in our invested positions, which might help you to better see the big picture.

There is no sense in having you look at cutline reports when all you see are worsening momentum numbers and sliding M-Index rankings.

Last night, I reviewed the High Volume Cutline report and noticed that out of the 90 ETFs I track, only 5 of them were positioned above the cutline and therefore in bullish territory. However, all of them had worsening momentum numbers, which supports my opinion that, in the current environment, there is really no place to hide, and cash is a better option than a questionable ETF or mutual fund.

Read More

Another Afternoon Stumble—Equity ETFs Close AT Their Lows

Ulli Market Commentary Contact

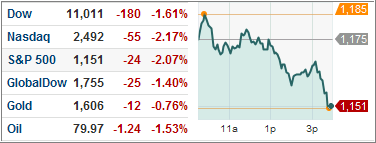
Sure, part of the slide could have been a result of continued profit taking from last week’s run up, but a part of it can attributed to fears about the progress, or lack thereof, of the European debt solution.

Volatility increased again, with the Dow trading in a 300 point range, while the markets remain stuck in the middle of their 2-month sideways pattern, which I discussed yesterday. Concerns about an economic slowdown in China did not help matters, as the Shanghai Composite Index hit a new low for 2011, which gives it a loss YTD of -14.8%.

Still, most of the selling was Greece related, and the effect a default might have on the solvency of Europe’s banks.

There is much guesswork, but no one really has a specific answer as to the overall consequences on the various financial centers not only in Europe but around the world. The fear is that a default might occur in such a way that banks may not have enough time to prepare in order to withstand the shock.

Read More