
- Moving the market
Stocks started the day on shaky footing and never really found their balance.
Early selling kicked in after President Trump said talks with Iran were “taking too long” and hinted at further action. In a post Wednesday morning, he warned Iran had missed its chance at a favorable deal and would now “have to pay the price,” which didn’t exactly calm investors’ nerves.
Things escalated further after reports that U.S. forces carried out strikes on Iran late Tuesday, following the downing of a U.S. Army Apache helicopter near the Strait of Hormuz. That ramp-up in tensions quickly put markets on edge.
When geopolitical risk heats up like this, it tends to cast a shadow over everything—and right now, it’s making it tough for traders to feel comfortable putting money to work.
That said, not everyone is worried. Some are betting this is just part of the negotiation playbook and that a deal will eventually get done. But if it doesn’t, oil prices could be headed sharply higher, which adds another layer of uncertainty to the outlook.
Back in the market, chip stocks stayed under pressure for yet another session. Names like Micron, AMD, and Broadcom were all lower again, marking a fourth down day out of five.
There’s also a growing narrative that some investors are trimming their big semiconductor winners ahead of the highly anticipated SpaceX IPO on Friday—potentially the largest ever—as they free up capital to participate.
Even a slightly better-than-expected inflation report couldn’t spark a turnaround. Core CPI for May came in at 0.2% for the month, a bit cooler than expected, while the annual rate held at 2.9%. Still above the Fed’s 2% target, but not exactly alarming.
The headline inflation number, however, pushed back above 4% for the first time in three years—definitely not a great look and a reminder that inflation pressures aren’t fully behind us.
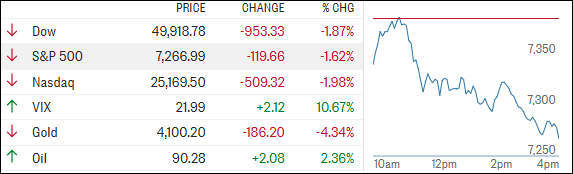
By the closing bell, stocks were broadly beat up and still trying to catch up with moves we’ve already seen in bond yields and crude oil.
The Nasdaq took the hardest hit, and notably, dip buyers were nowhere to be found—a bit of a red flag in itself.
Bitcoin once again did its own thing, bouncing nicely off the $61K level and finishing the day with gains.
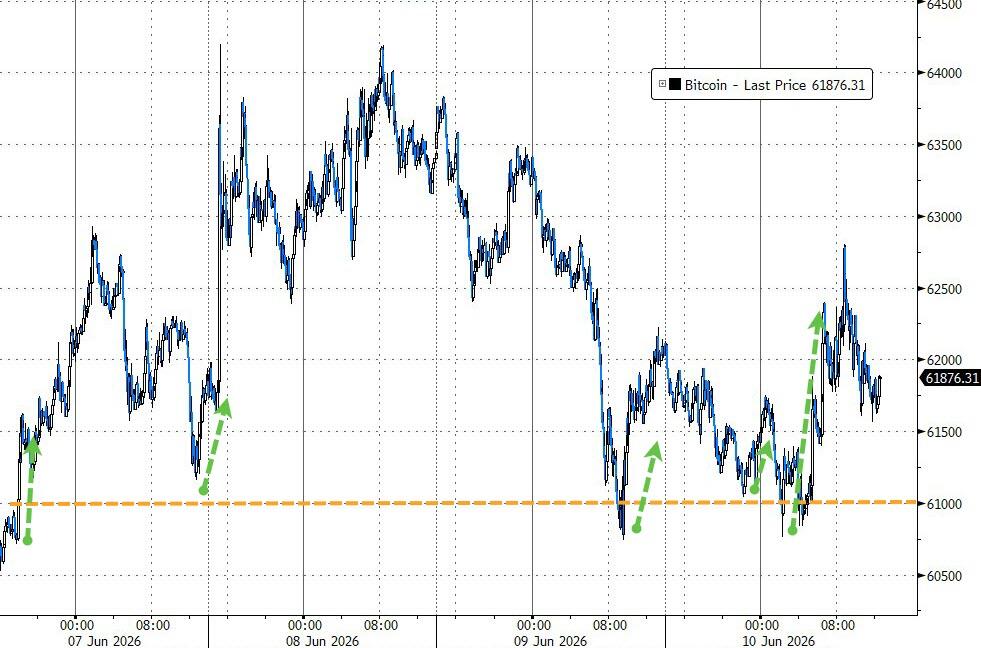
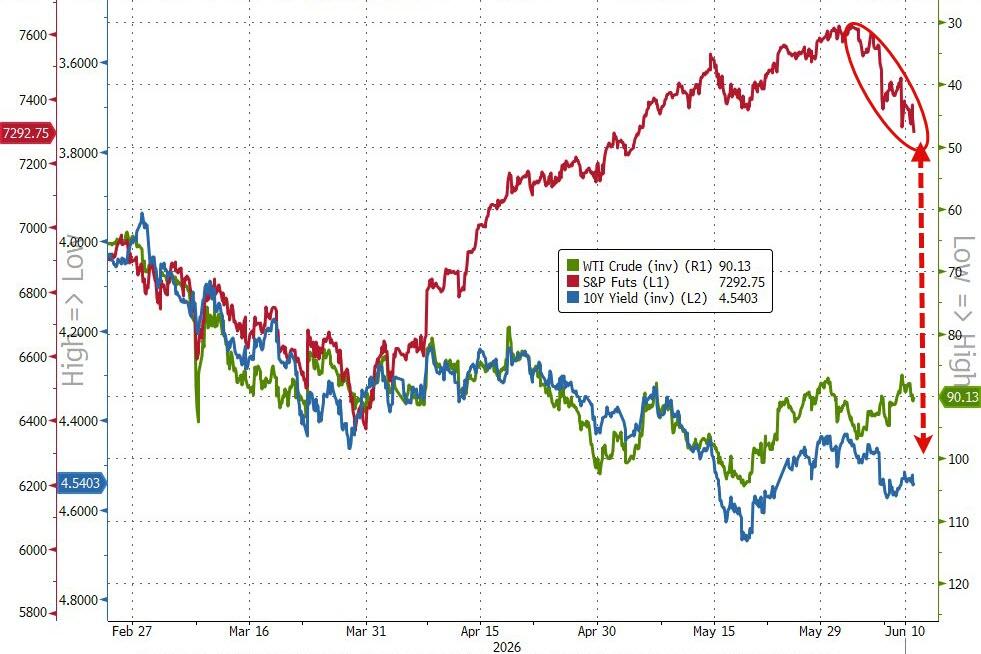
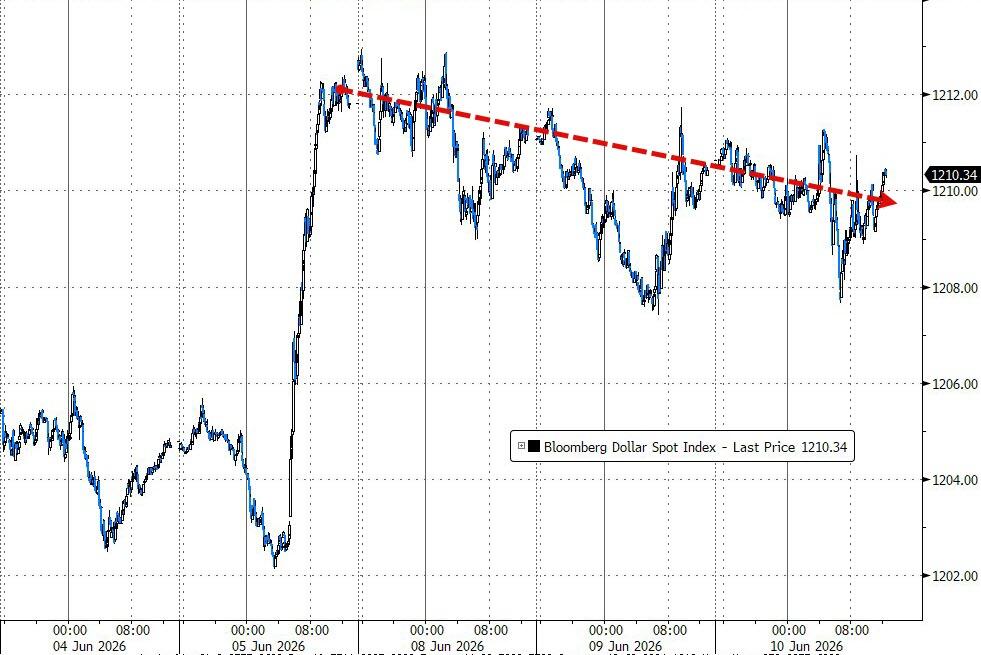
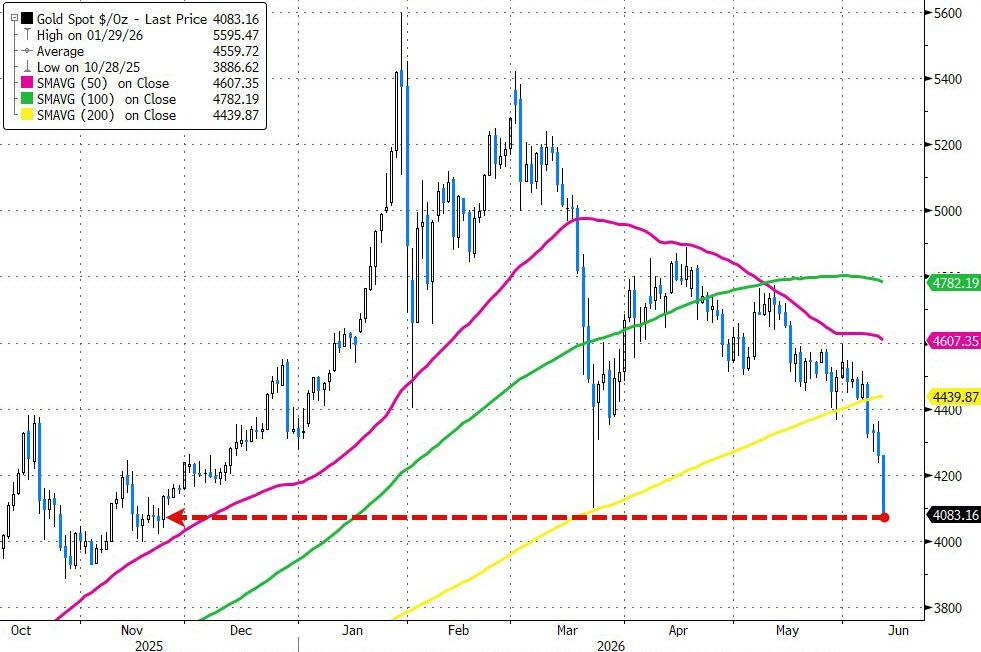
Meanwhile, bond yields were relatively steady, the dollar slipped a bit, and gold took a sharp hit. That drop in gold was likely driven by margin calls, forcing leveraged traders to sell positions quickly to raise cash.
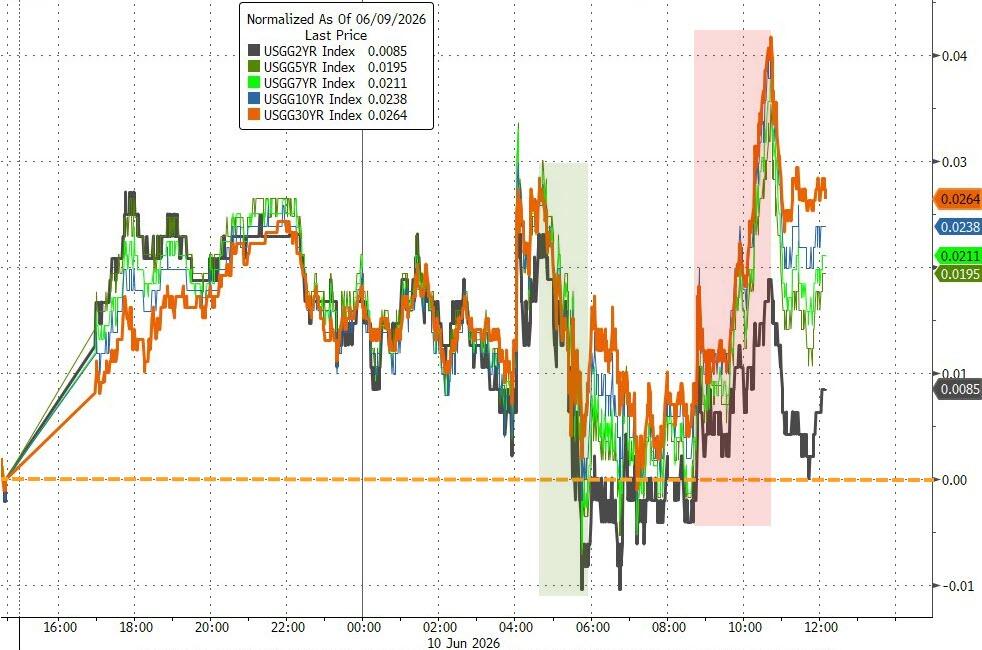
Zooming out, there’s a lot of leverage still sitting in the system—roughly $100 billion tied up in semis and hardware-related stocks, with a heavy dose of retail participation.
Now that sentiment seems to be shifting, the big question is whether we’re just seeing a typical pullback… or the early stages of a more aggressive unwind.
So, here’s the real question: if this selling starts feeding on itself, how much deeper could this deleveraging cycle go?
2. Current domestic “Buy” Cycle (effective 5/20/2025); International “Buy” Cycle (effective 5/8/25)
Our domestic bullish cycle that began on November 21, 2023, concluded on April 3, 2025, following a market downturn triggered by President Trump’s tariff policy announcement.
This development caused significant declines across major indexes and broader market indices. However, markets subsequently rebounded, culminating in a new domestic “Buy” signal taking effect May 20, 2025.
Concurrently, our International Trend Tracking Index (TTI) experienced parallel volatility. On April 4, 2025, it breached critical thresholds, prompting a “Sell” recommendation. This position reversed as global markets recovered, with the International TTI regaining sufficient momentum to issue a new “Buy” signal effective May 8, 2025.
3. Trend Tracking Indexes (TTIs)
The bears came out swinging right at the open and stayed in control all the way to the close. The major indexes took a solid hit, and it felt like there was red across nearly every corner of the market.
Bitcoin managed to hold its ground and stood out as a rare exception, while the metals sector had a rough session and sold off sharply.
Our TTIs weren’t immune to the pullback, but the bigger picture hasn’t changed—they’re still holding firmly above their respective bullish trend lines.
This is how we closed 06/10/2026:
Domestic TTI: +6.03% above its M/A (prior close +7.40%)—Buy signal effective 5/20/25.
International TTI: +6.50% above its M/A (prior close +7.73%)—Buy signal effective 5/8/25.
All linked charts above are courtesy of Bloomberg via ZeroHedge.
———————————————————-
WOULD YOU LIKE TO HAVE YOUR INVESTMENTS PROFESSIONALLY MANAGED?
Do you have the time to follow our investment plans yourself? If you are a busy professional who would like to have his portfolio managed using our methodology, please contact me directly to get more details.
Contact Ulli