
ETF Tracker StatSheet
You can view the latest version here.
IRAN REOPENS STRAIT – STOCKS ROCKET HIGHER ON CEASEFIRE HOPES
- Moving the market
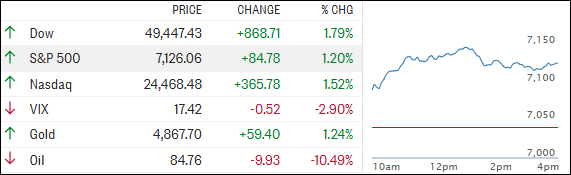
Stocks rocketed higher on Friday after Iran declared the Strait of Hormuz “completely open” following a ceasefire announcement between Israel and Lebanon. The news removed a major supply disruption fear and sent oil prices tumbling.
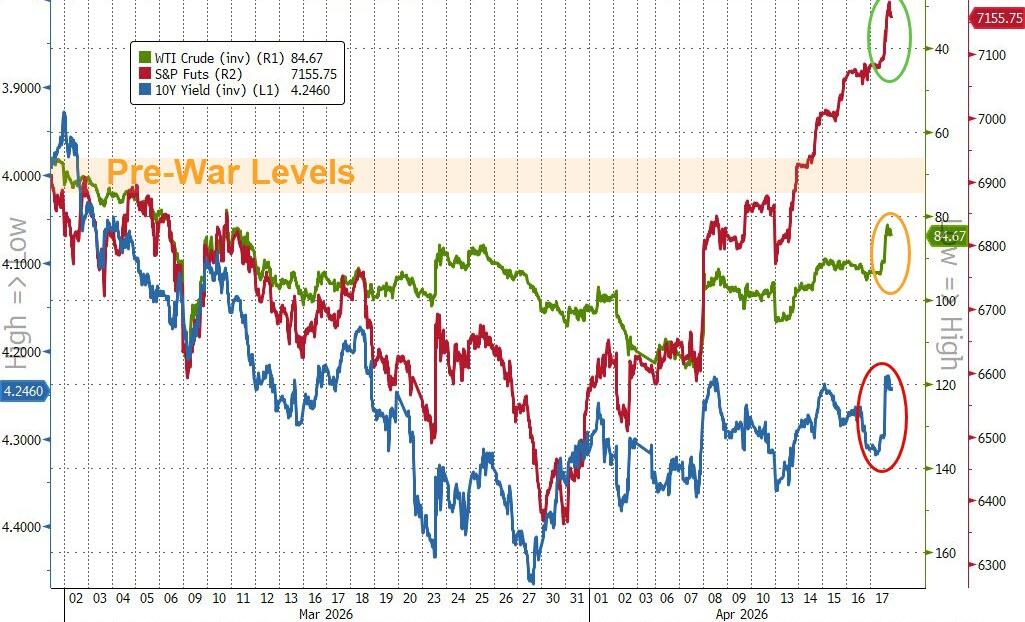
West Texas Intermediate crude dropped 14% to around $80 a barrel, while Brent fell 13% to about $86.
President Trump thanked Iran for reopening the strait and said the U.S. Navy’s blockade of Iranian ports will stay in place until a full peace agreement is reached, adding that the process “should go very quickly.”
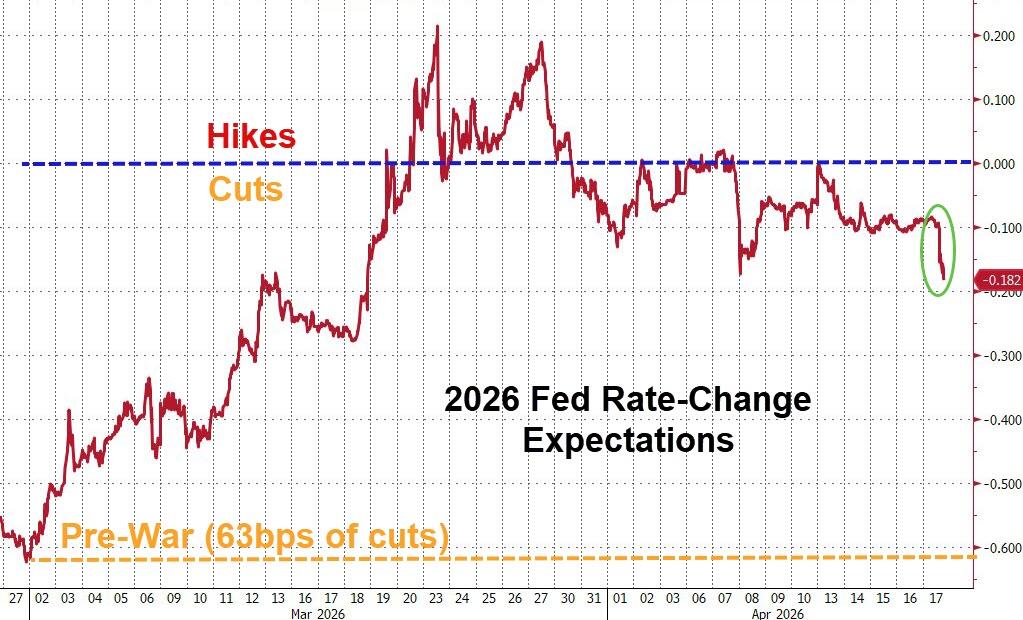
Despite some confusing and conflicting headlines, traders didn’t care — they pushed stocks, gold, and Bitcoin sharply higher. Rate-cut odds also improved.
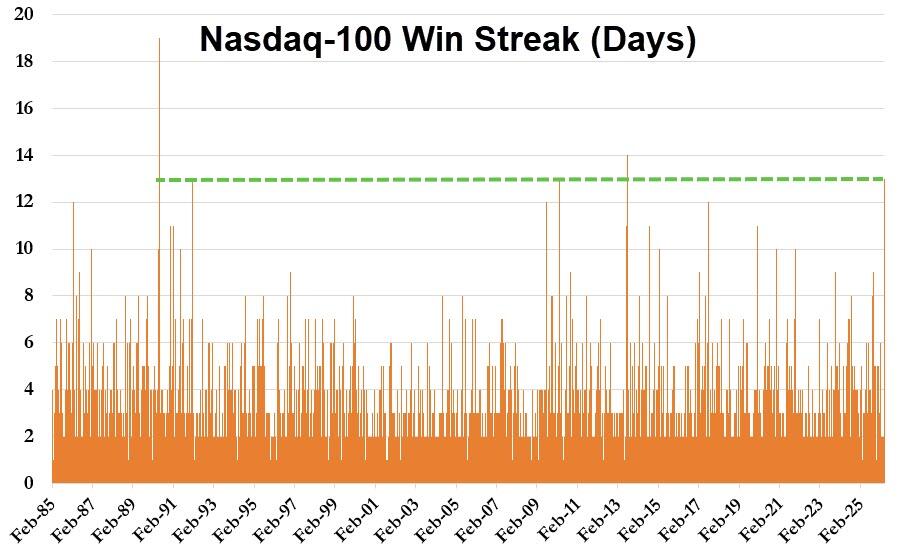
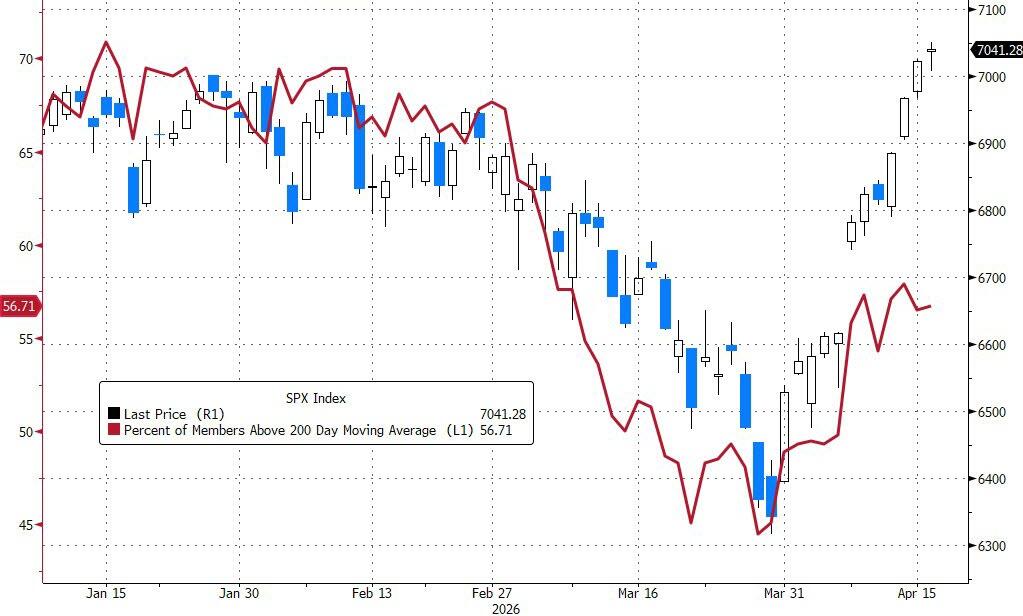
The Nasdaq 100 extended its winning streak to 13 straight days (its longest since July 2013).
Since the war began, stocks have massively outperformed bonds, though breadth remains weak. The Mag 7 showed strength again, and small caps joined the party.
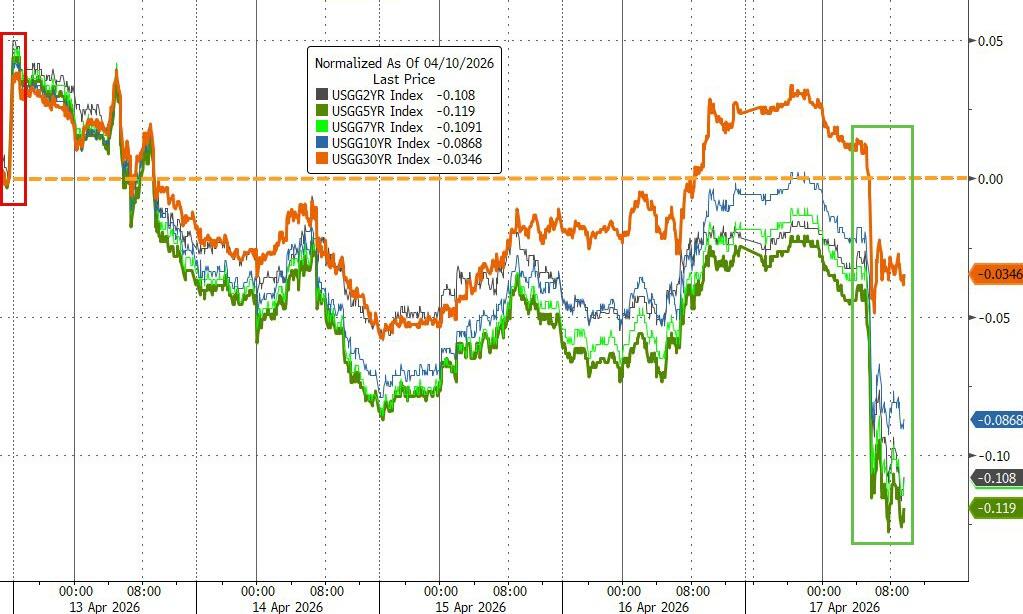
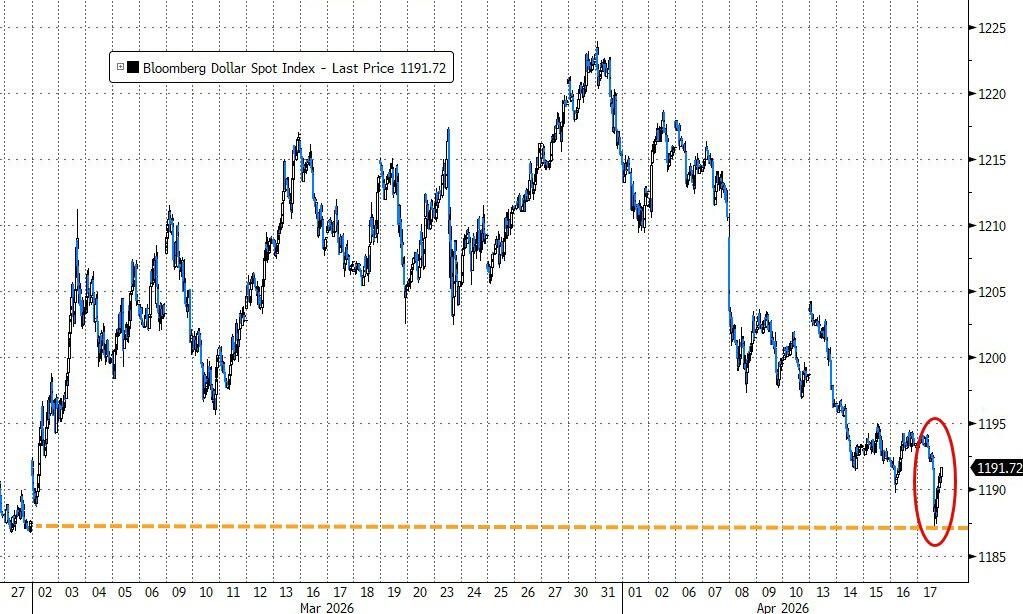
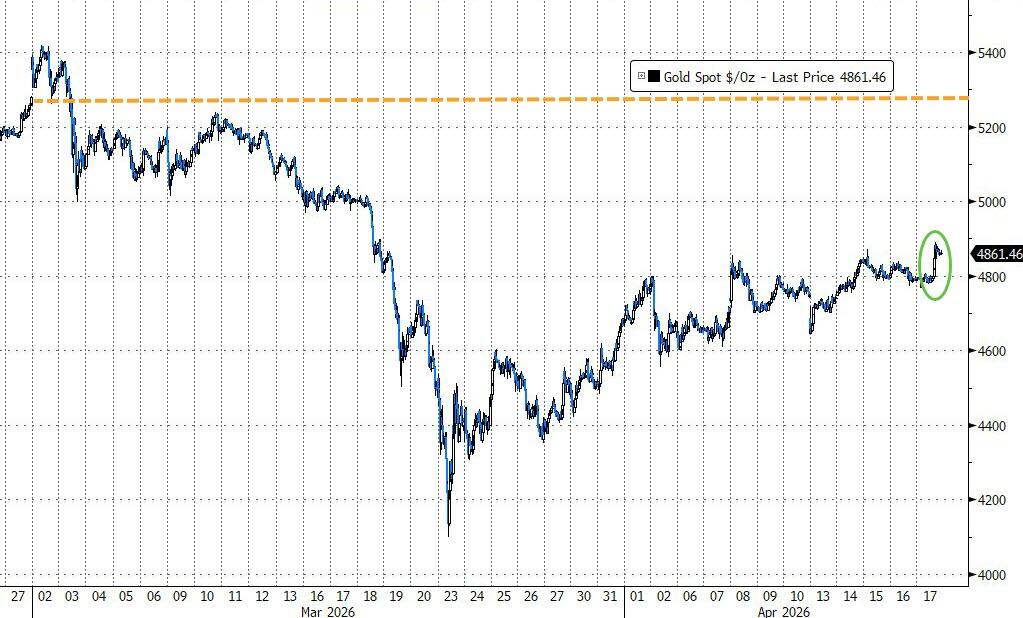
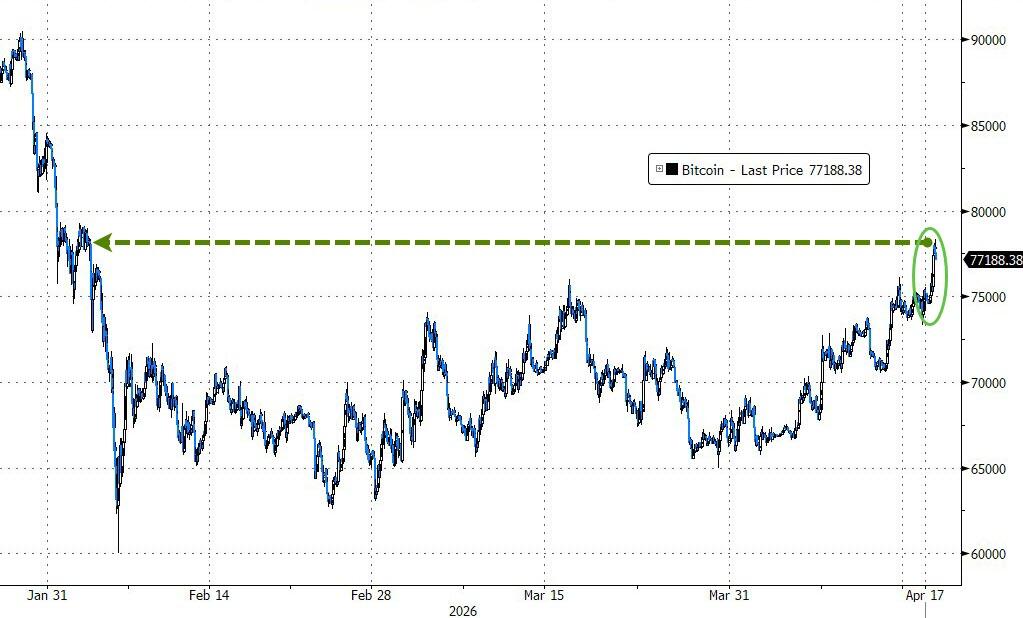
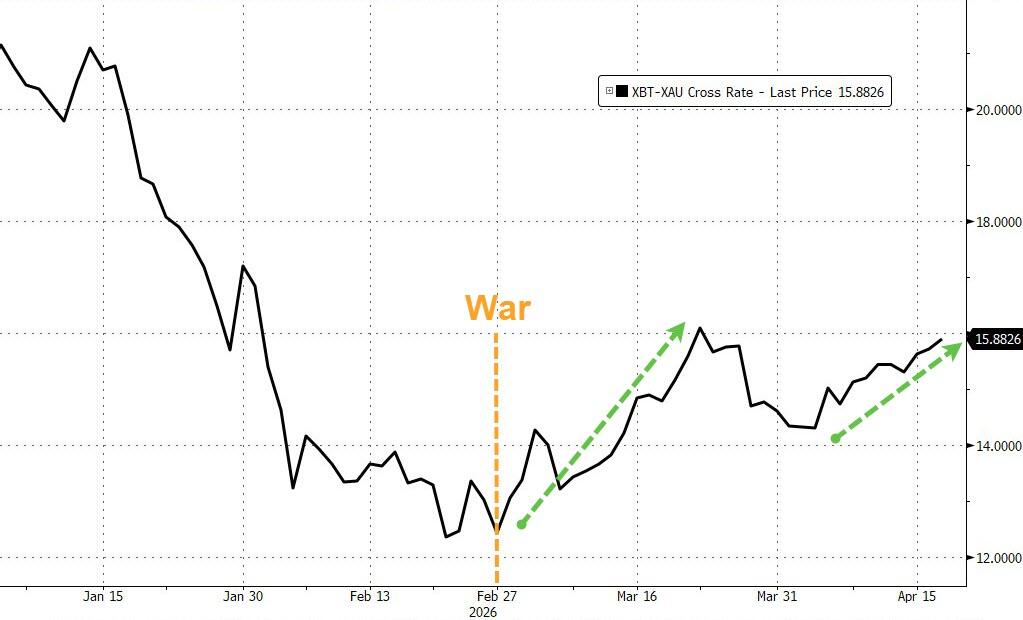
Bond yields dropped, the dollar fell for the third week in a row, gold spiked toward $4,900, silver outperformed, and Bitcoin surged above $78K for the first time since early February — solidly outperforming gold since the conflict started.
To me, the big question now is whether this jawboning and relentless headline ping-pong can actually turn into a sustainable truce, so today’s advances aren’t wiped out by the next sudden jerk.
2. Current domestic “Buy” Cycle (effective 5/20/2025); International “Buy” Cycle (effective 5/8/25)
Our domestic bullish cycle that began on November 21, 2023, concluded on April 3, 2025, following a market downturn triggered by President Trump’s tariff policy announcement.
This development caused significant declines across major indexes and broader market indices. However, markets subsequently rebounded, culminating in a new domestic “Buy” signal taking effect May 20, 2025.
Concurrently, our International Trend Tracking Index (TTI) experienced parallel volatility. On April 4, 2025, it breached critical thresholds, prompting a “Sell” recommendation. This position reversed as global markets recovered, with the International TTI regaining sufficient momentum to issue a new “Buy” signal effective May 8, 2025.
3. Trend Tracking Indexes (TTIs)
The Iranian announcement that the Strait of Hormuz was fully open lit a fire under the market.
Bulls took control right from the start and never let go, driving a nice broad-based rally across the indexes.
The metals and Bitcoin jumped in on the positive mood too, while our TTIs hopped on board as well and posted a solid green close. The domestic TTI outperformed the international one by about two to one.
This is how we closed 04/17/2026:
Domestic TTI: +6.33% above its M/A (prior close +5.32%)—Buy signal effective 5/20/25.
International TTI: +8.74% above its M/A (prior close +8.57%)—Buy signal effective 5/8/25.
All linked charts above are courtesy of Bloomberg via ZeroHedge.
———————————————————-
WOULD YOU LIKE TO HAVE YOUR INVESTMENTS PROFESSIONALLY MANAGED?
Do you have the time to follow our investment plans yourself? If you are a busy professional who would like to have his portfolio managed using our methodology, please contact me directly to get more details.
Contact Ulli