
- Moving the market
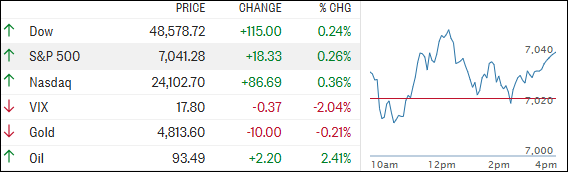
The S&P 500 and Nasdaq slipped after hitting fresh record highs earlier in the session, but they recovered nicely by the close.
Both indexes are on track for a strong week, with the S&P up about 3% and the Nasdaq gaining more than 4%, while the Dow is up around 1%.
Milestones were hit on Wednesday: The S&P 500 closed above 7,000 for the first time ever, and the Nasdaq closed above 24,000 for the first time.
The lift came after President Trump said the Iran war is “very close to over” and announced upcoming talks between Israel and Lebanon. Halting attacks on Lebanon has been a key condition for broader Iran negotiations.
Stocks have now fully recovered all losses since the war began in late February.
We’re basically back to where we were valuation-wise and sentiment-wise before the conflict, but for the rally to keep going, we’ll likely need to see it broaden out beyond just the Nasdaq and big tech.
Headlines continue to drive direction. ZeroHedge summed up the key ones today as:
GOOD: Trump says talks with Iran are looking very promising — less pain
BAD: Gulf and European officials think a deal could take 6 months — more pain
UGLY: Trump warns that if no deal, fighting will resume — serious pain
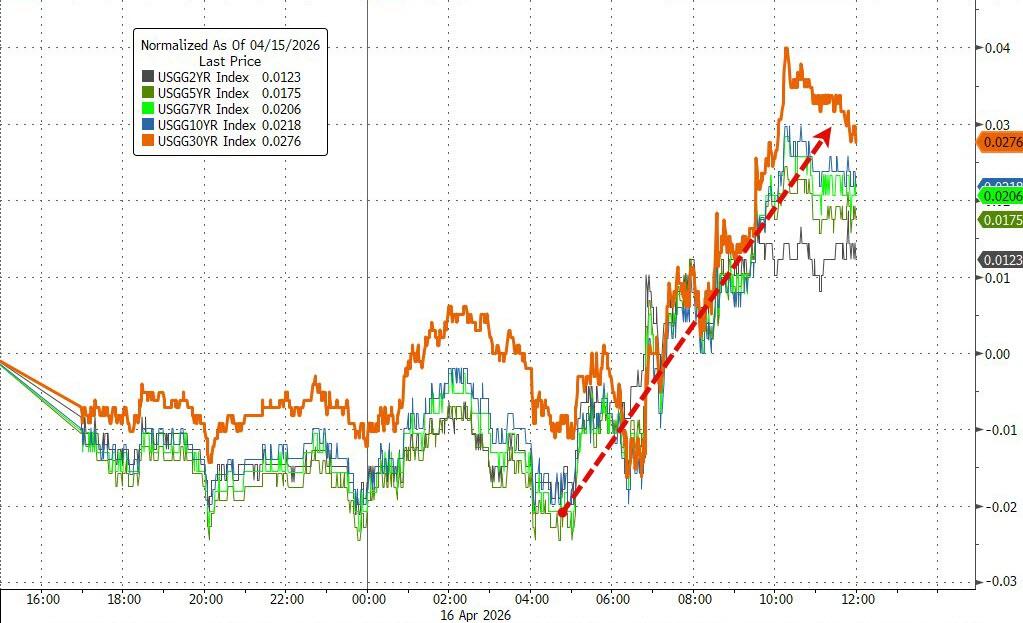
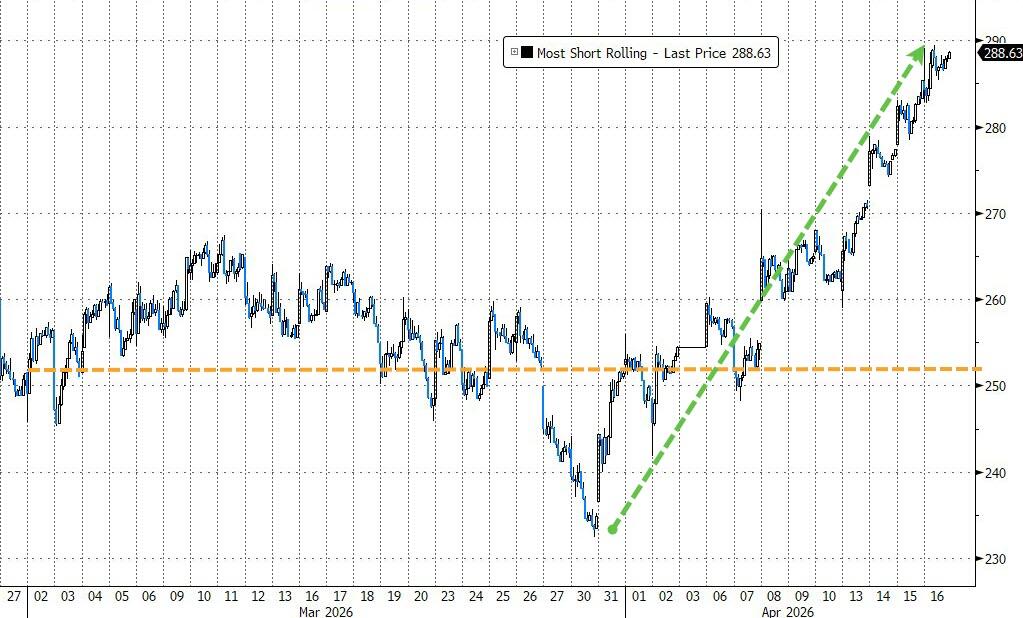
Bond yields rose, the most-shorted stocks continued to get squeezed, and the dollar went nowhere.
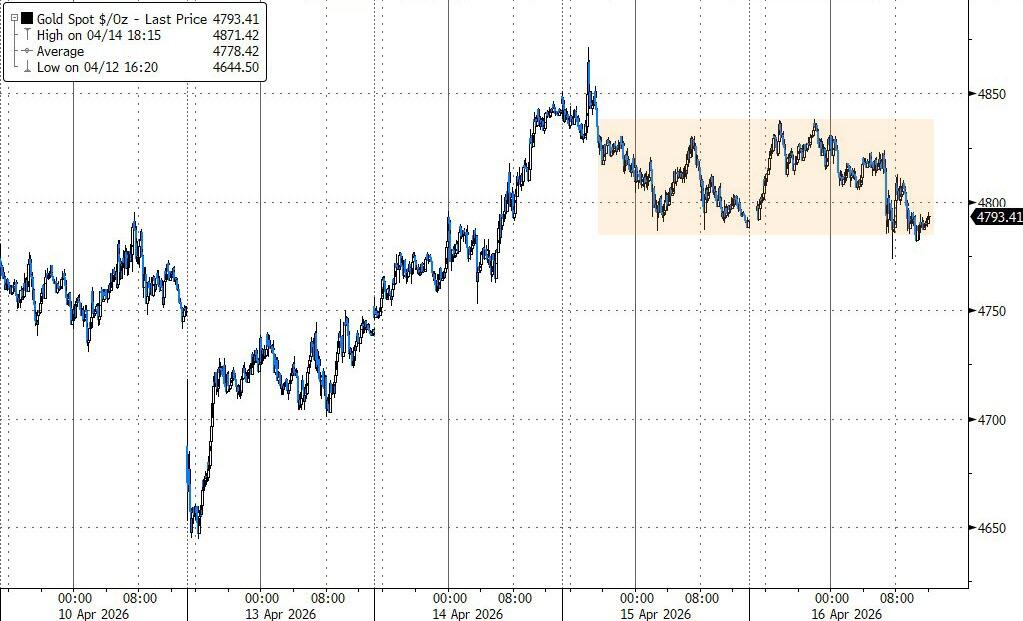
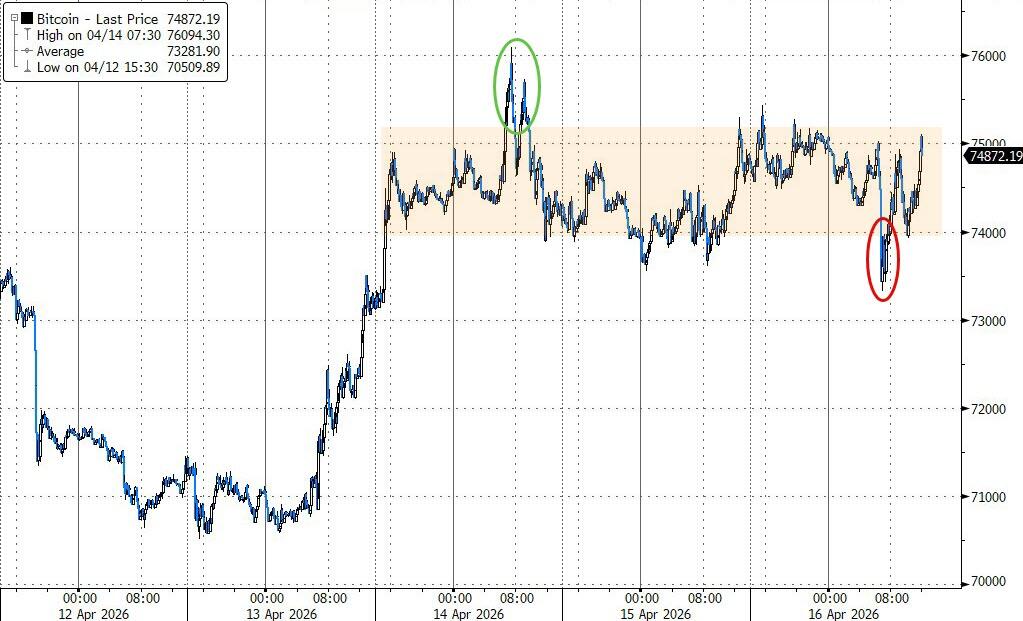
Gold stayed flat around $4,800, while Bitcoin tested $73K before bouncing back toward $75K.
Relentless hope for a negotiated settlement with Iran, combined with resilient economic data, has kept the rally alive — at least for now.
2. Current domestic “Buy” Cycle (effective 5/20/2025); International “Buy” Cycle (effective 5/8/25)
Our domestic bullish cycle that began on November 21, 2023, concluded on April 3, 2025, following a market downturn triggered by President Trump’s tariff policy announcement.
This development caused significant declines across major indexes and broader market indices. However, markets subsequently rebounded, culminating in a new domestic “Buy” signal taking effect May 20, 2025.
Concurrently, our International Trend Tracking Index (TTI) experienced parallel volatility. On April 4, 2025, it breached critical thresholds, prompting a “Sell” recommendation. This position reversed as global markets recovered, with the International TTI regaining sufficient momentum to issue a new “Buy” signal effective May 8, 2025.
3. Trend Tracking Indexes (TTIs)
The day started with a quick dip, but it didn’t last long.
The major indexes found support from growing optimism that the Iran war might finally be winding down.
Hope really does spring eternal in this market, and another solid green close helped calm the skeptics.
The metals complex mostly sat this one out, but the rally was broad enough that our Trend TTIs still managed to eke out a nice advance.
This is how we closed 04/16/2026:
Domestic TTI: +5.32% above its M/A (prior close +4.84%)—Buy signal effective 5/20/25.
International TTI: +8.57% above its M/A (prior close +8.04%)—Buy signal effective 5/8/25.
All linked charts above are courtesy of Bloomberg via ZeroHedge.
———————————————————-
WOULD YOU LIKE TO HAVE YOUR INVESTMENTS PROFESSIONALLY MANAGED?
Do you have the time to follow our investment plans yourself? If you are a busy professional who would like to have his portfolio managed using our methodology, please contact me directly to get more details.
Contact Ulli