
- Moving the market
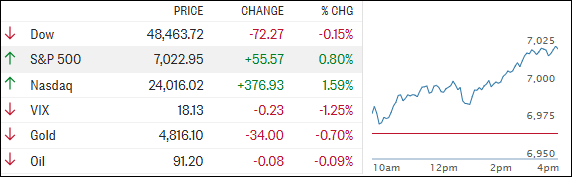
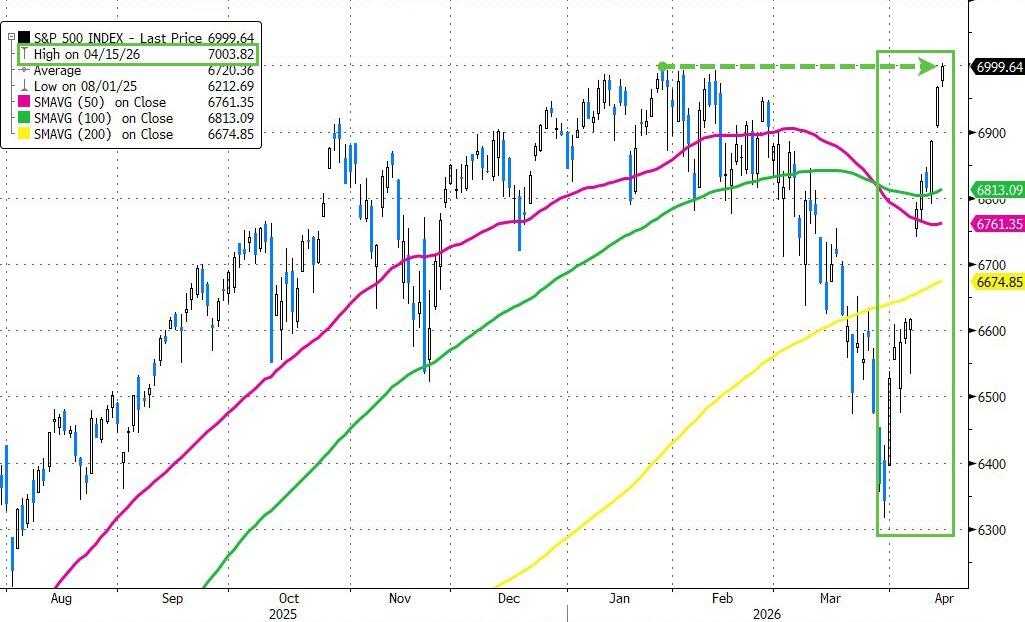
The S&P 500 and Nasdaq got off to a strong start, with the S&P moving to a new all-time intraday high as traders stayed hopeful that a deal to end the U.S.-Iran war could materialize soon.
Broadcom was one of the standout performers, rising 3% after Meta extended its partnership to deploy custom chips using Broadcom’s technology.
This followed a very strong prior session — the S&P 500 has now surpassed its previous all-time high of 7,002.28 from January 28, marking its ninth positive session out of the last ten.
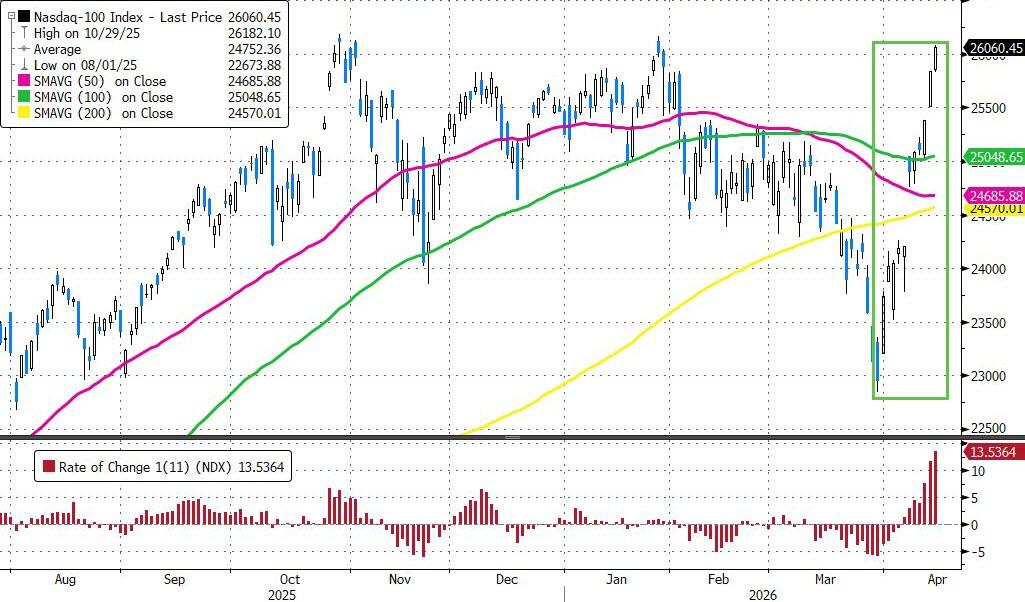
The tech-heavy Nasdaq 100 also posted its 10th straight gain and hit a fresh record high.
President Trump added to the optimistic mood, saying “We’ve been called by the other side — they’d like to make a deal very badly,” and later telling Fox Business that the war is “very close to over.”
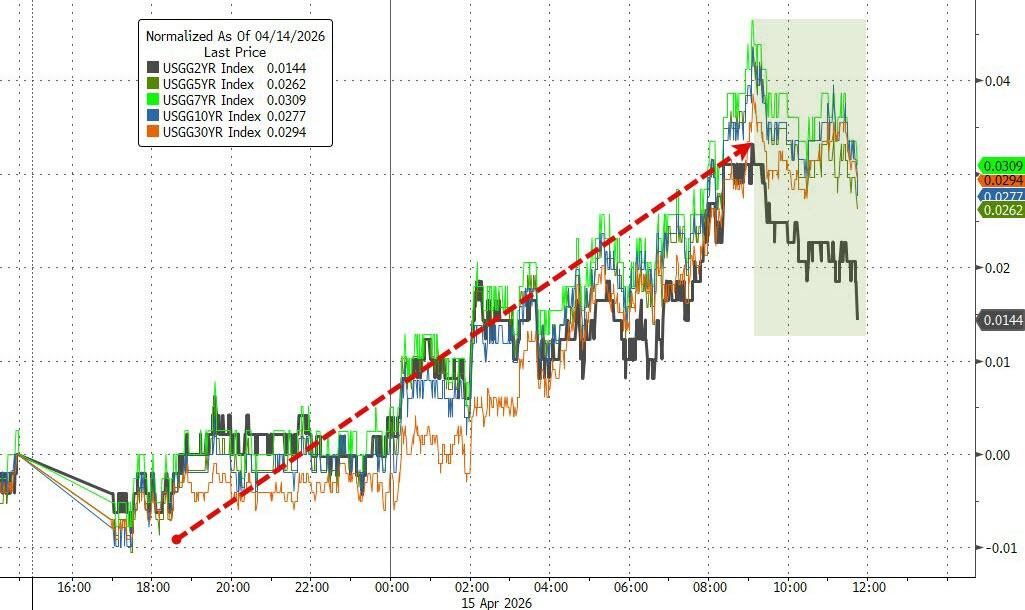
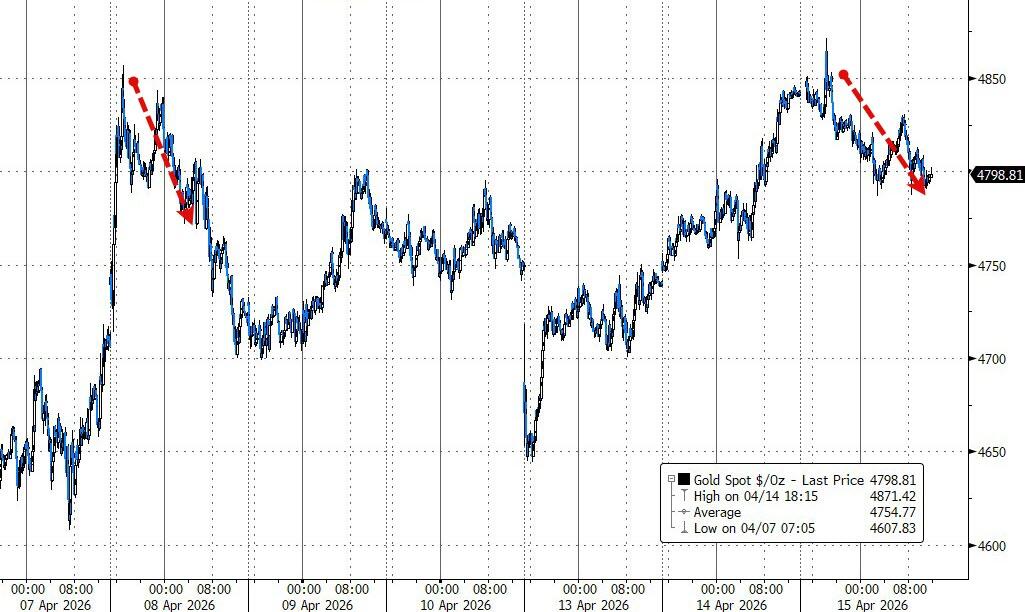
Higher oil prices (and the equity strength) pushed bond yields up by about 3–4 basis points across the curve. The dollar traded sideways, while gold limped lower but stayed comfortably above $4,800.
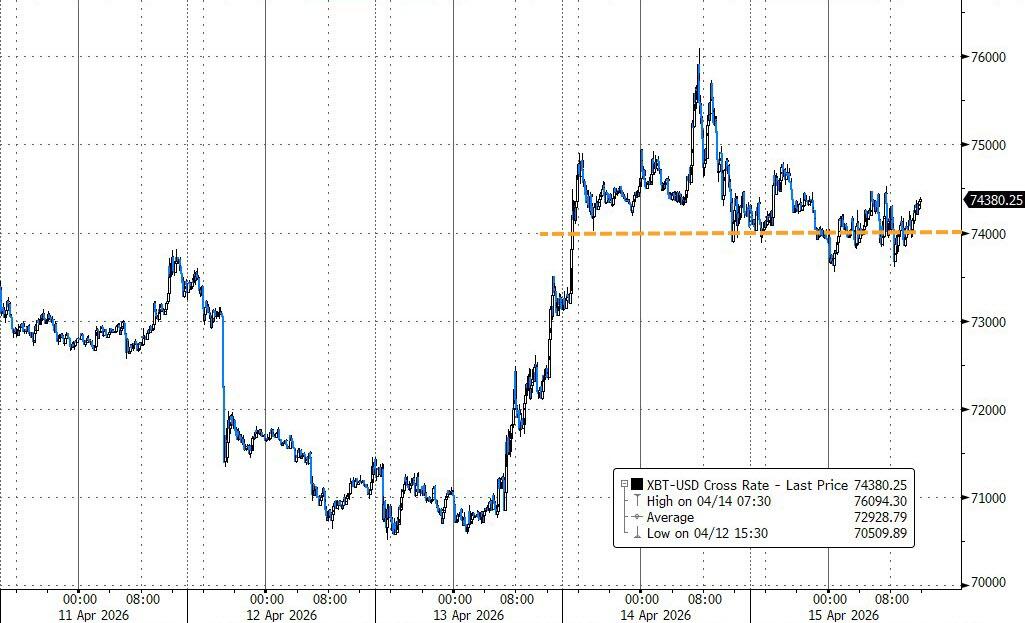
Bitcoin also traded sideways, holding $74,000 as support for now.
In the end, equities seemed to decouple from oil, and bonds underperformed. It felt more like a narrow, tech-driven move than a true broadening of the rally.
2. Current domestic “Buy” Cycle (effective 5/20/2025); International “Buy” Cycle (effective 5/8/25)
Our domestic bullish cycle that began on November 21, 2023, concluded on April 3, 2025, following a market downturn triggered by President Trump’s tariff policy announcement.
This development caused significant declines across major indexes and broader market indices. However, markets subsequently rebounded, culminating in a new domestic “Buy” signal taking effect May 20, 2025.
Concurrently, our International Trend Tracking Index (TTI) experienced parallel volatility. On April 4, 2025, it breached critical thresholds, prompting a “Sell” recommendation. This position reversed as global markets recovered, with the International TTI regaining sufficient momentum to issue a new “Buy” signal effective May 8, 2025.
3. Trend Tracking Indexes (TTIs)
The S&P 500 and Nasdaq were the stars of the show, staying in rally mode pretty much all day and closing with solid gains.
The Dow, however, couldn’t quite keep up and lagged.
Most other markets basically took the day off — Bitcoin and the metals were quiet and went essentially nowhere.
Our TTIs followed a similar pattern. Both showed fairly lackluster movement but at least held steady around the unchanged line.
This is how we closed 04/15/2026:
Domestic TTI: +4.84% above its M/A (prior close +4.80%)—Buy signal effective 5/20/25.
International TTI: +8.04% above its M/A (prior close +7.99%)—Buy signal effective 5/8/25.
All linked charts above are courtesy of Bloomberg via ZeroHedge.
———————————————————-
WOULD YOU LIKE TO HAVE YOUR INVESTMENTS PROFESSIONALLY MANAGED?
Do you have the time to follow our investment plans yourself? If you are a busy professional who would like to have his portfolio managed using our methodology, please contact me directly to get more details.
Contact Ulli