
- Moving the market
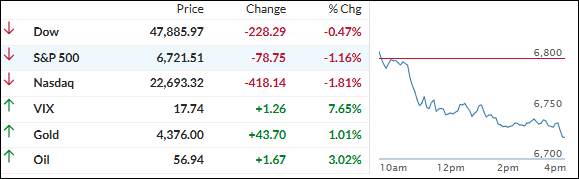
The markets started the day on shaky footing, with the S&P 500 and Nasdaq slipping while the Dow briefly held modest gains as traders sifted through the long-delayed jobs data and tried to gauge the real state of the economy.
After weeks of trading on hope, yesterday’s report made it clearer that growth has been cooling for a while, and attention is already shifting to Thursday’s November CPI release to see whether inflation is easing enough to justify more support next year.
The real hit came from the AI story line. Oracle slid another 5% to its lowest level since mid‑June as fresh “data center drama” reignited worries about the pace and profitability of big AI investments, and AI stocks more broadly have now dropped about 9% over the past week.
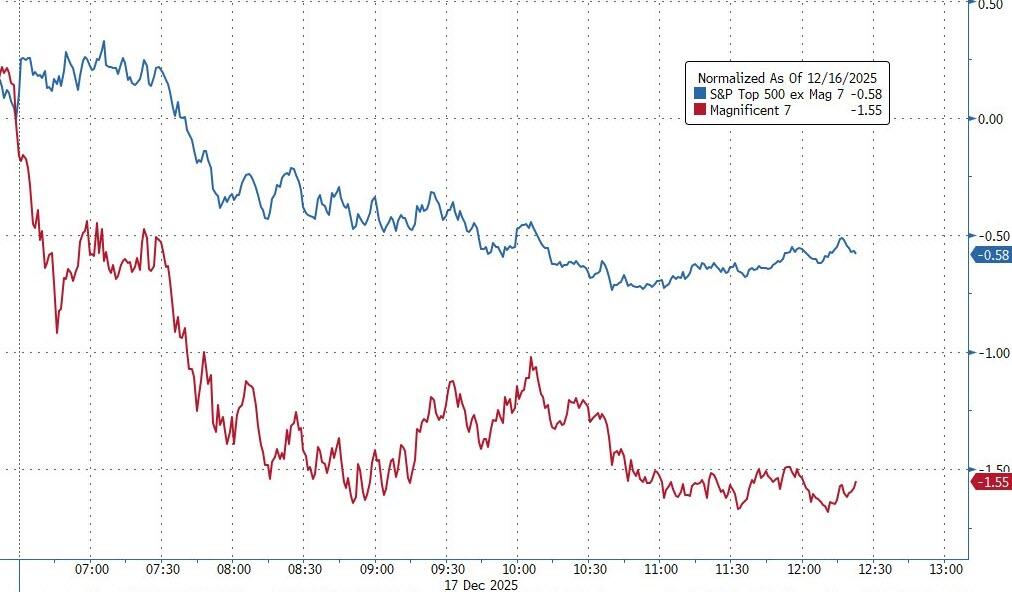
That knocked the wind out of the Nasdaq, which was hit hard and lost its 50‑day moving average, while the Dow held up relatively better; as a group, the Mag 7 names lagged the other 493 S&P components by a wide margin, underscoring how leadership has been wobbling.
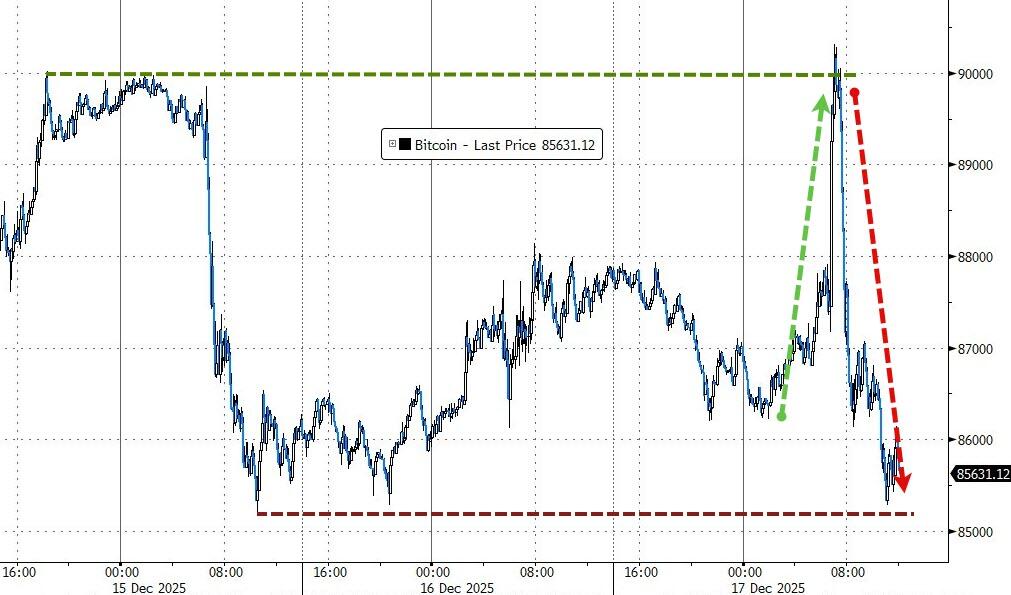
Crypto traded like a roller coaster, with Bitcoin spiking from around 86k up toward 90k before sliding back toward 85k by the close.
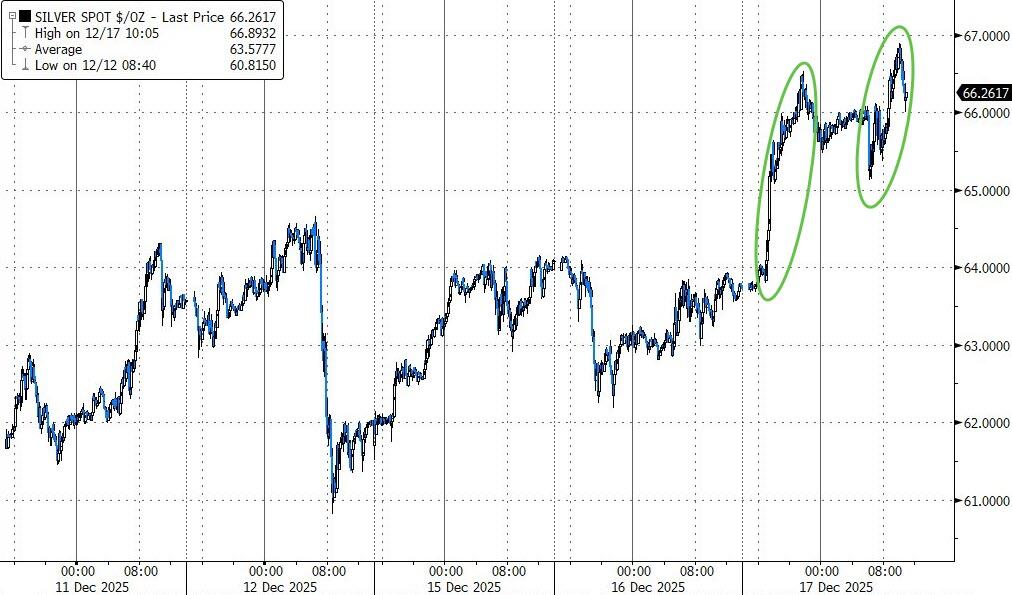
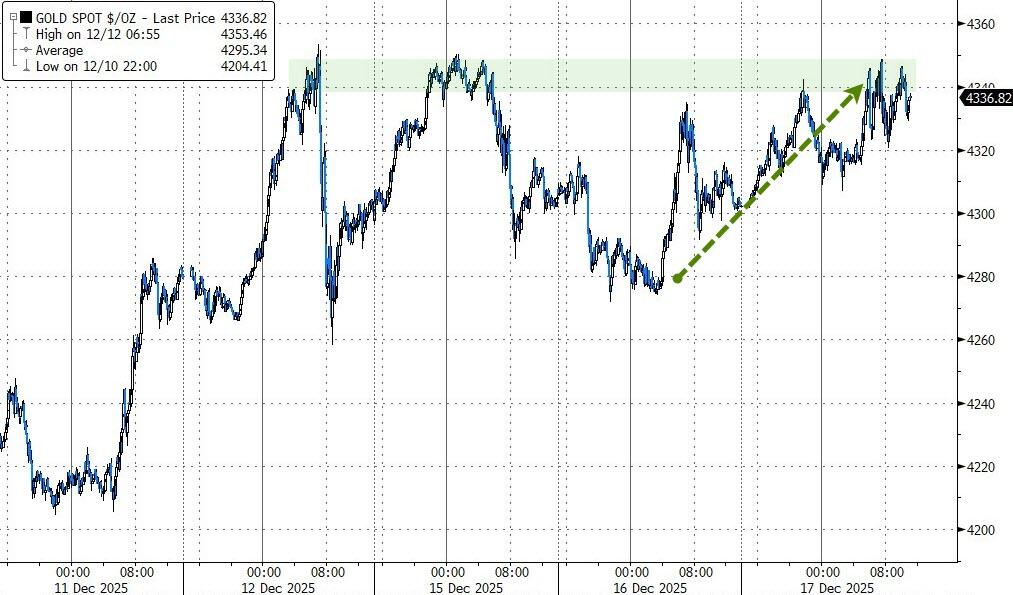
Precious metals, on the other hand, continued to act as a stabilizing force: silver ripped higher again, gaining roughly 4.4% as it pushed toward 67 before falling just short, and gold added about 1% but bumped into resistance near 4,350.
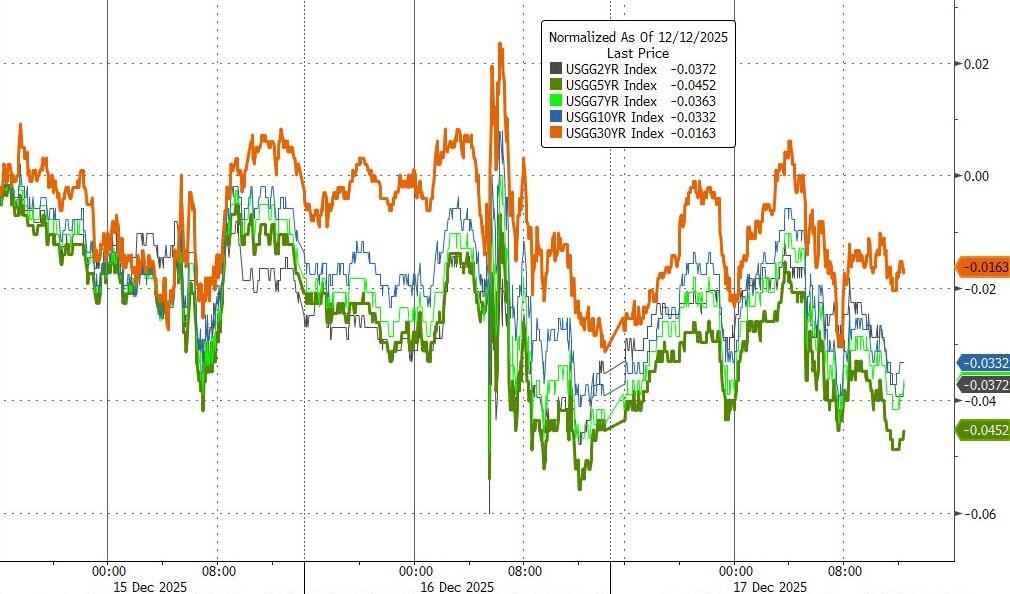
Bonds chopped around intraday, but yields remain lower on the week, offering at least a bit of support to risk assets in the background.
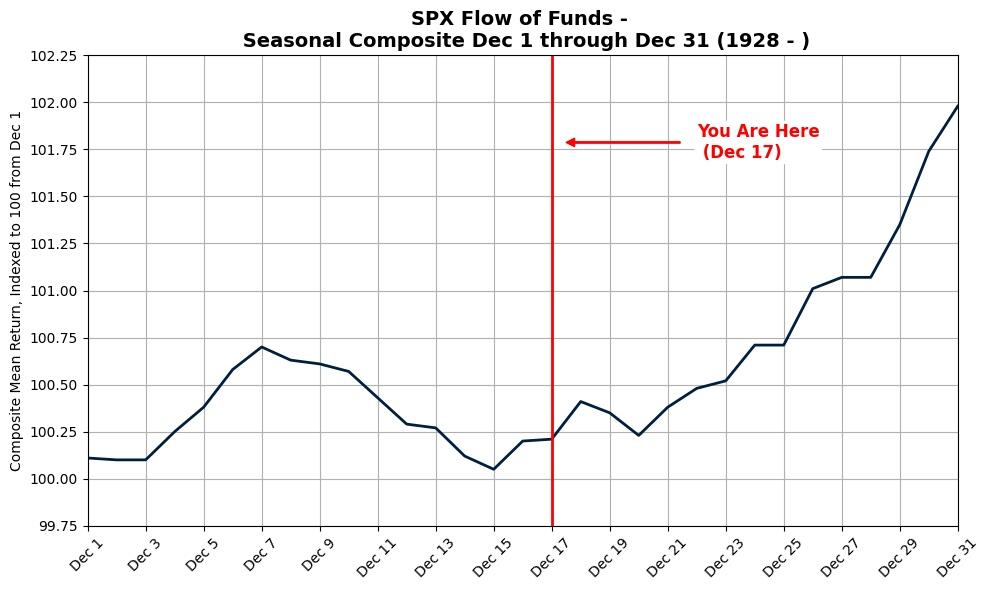
With only seven trading days left in the year, AI heavyweights stumbling, metals leading, and the macro picture looking softer but not outright broken, the big question is this one:
Can seasonality finally step in and give equities the year‑end tailwind they’re looking for—or if 2025 is destined to limp into the finish line instead of sprinting.
2. Current domestic “Buy” Cycle (effective 5/20/2025); International “Buy” Cycle (effective 5/8/25)
Our domestic bullish cycle that began on November 21, 2023, concluded on April 3, 2025, following a market downturn triggered by President Trump’s tariff policy announcement.
This development caused significant declines across major indexes and broader market indices. However, markets subsequently rebounded, culminating in a new domestic “Buy” signal taking effect May 20, 2025.
Concurrently, our International Trend Tracking Index (TTI) experienced parallel volatility. On April 4, 2025, it breached critical thresholds, prompting a “Sell” recommendation. This position reversed as global markets recovered, with the International TTI regaining sufficient momentum to issue a new “Buy” signal effective May 8, 2025.
3. Trend Tracking Indexes (TTIs)
The Dow was the only one flashing green early on, but even it couldn’t hold the line. By afternoon, it gave up the ghost and joined the S&P 500 and Nasdaq in a pretty sharp slide lower.
The big villain? More jitters around AI companies and their non-stop capex binge—folks are starting to ask, “when do we actually see real returns on all this spending?”
That hit the usual suspects hard and dragged the broader tape down with it.
Our TTIs felt the downdraft too, but they kept it classy—both slipped only moderately, nothing that shakes the bigger picture.
This is how we closed 12/17/2025:
Domestic TTI: +5.94% above its M/A (prior close +6.23%)—Buy signal effective 5/20/25.
International TTI: +9.15% above its M/A (prior close +9.40%)—Buy signal effective 5/8/25.
All linked charts above are courtesy of Bloomberg via ZeroHedge.
———————————————————-
WOULD YOU LIKE TO HAVE YOUR INVESTMENTS PROFESSIONALLY MANAGED?
Do you have the time to follow our investment plans yourself? If you are a busy professional who would like to have his portfolio managed using our methodology, please contact me directly to get more details.
Contact Ulli