
- Moving the market
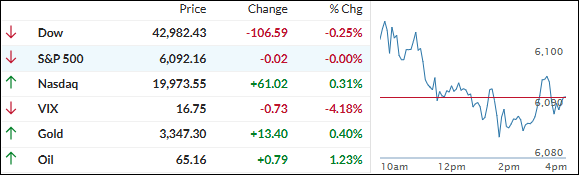
The S&P 500 and Nasdaq started the day on a positive note, with the S&P inching closer to its all-time high. The Dow, however, lagged.
Tech stocks helped lift the mood early on—Nvidia jumped over 3%, with Alphabet and AMD also posting solid gains.
So far this week, the S&P is up more than 2%, thanks in part to a surprisingly mild response from Iran following U.S. strikes, and a ceasefire announcement from President Trump. For now, tensions seem to be cooling, and the truce appears to be holding.
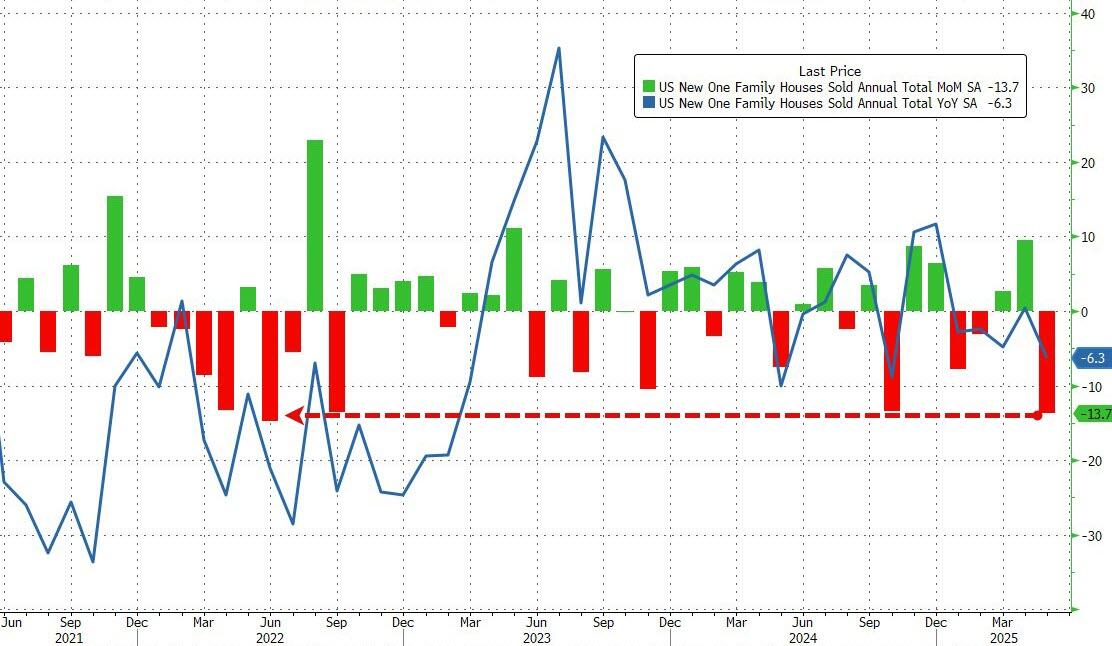
On the economic side, New Home Sales came in at their slowest pace since June 2022. All eyes are now on Fed Chair Powell’s upcoming testimony before the Senate Banking Committee, as traders look for any hints about a potential rate cut.
Despite the early optimism, markets reversed course midday. The Dow slipped into the red, the S&P flattened out, and only the Nasdaq managed to hold onto a small gain. Market breadth was weak—only 130 S&P stocks rose, while 370 fell.
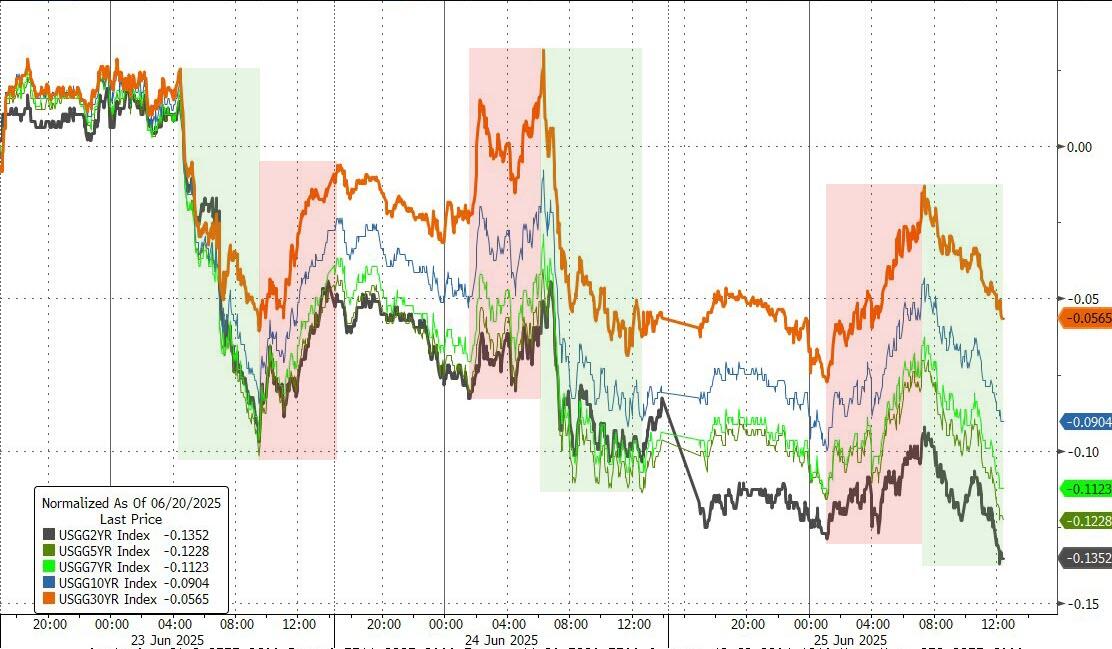
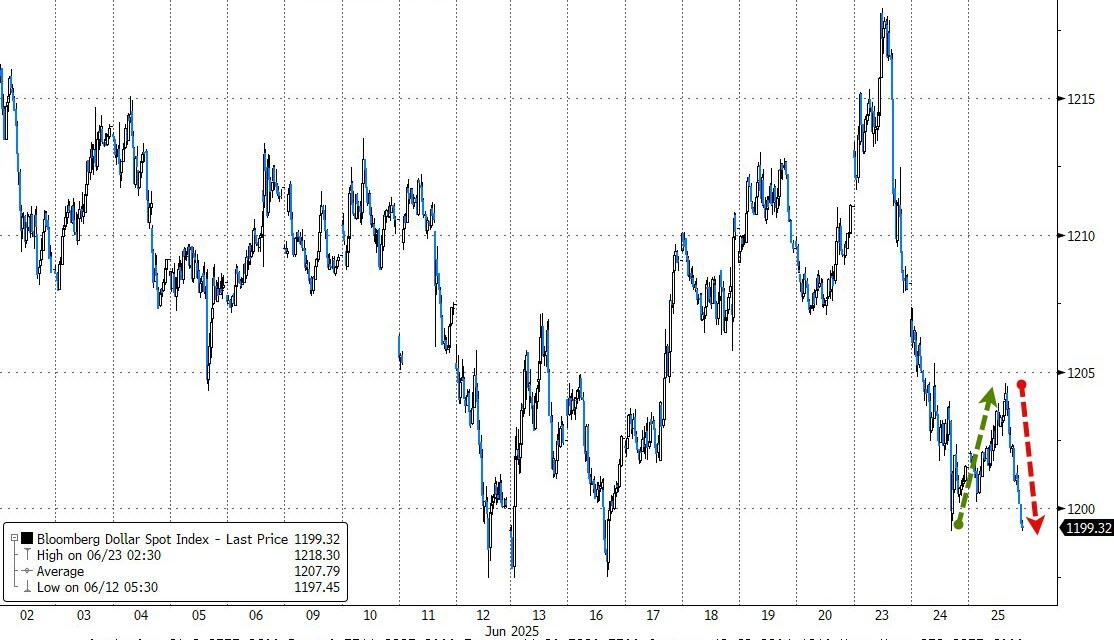
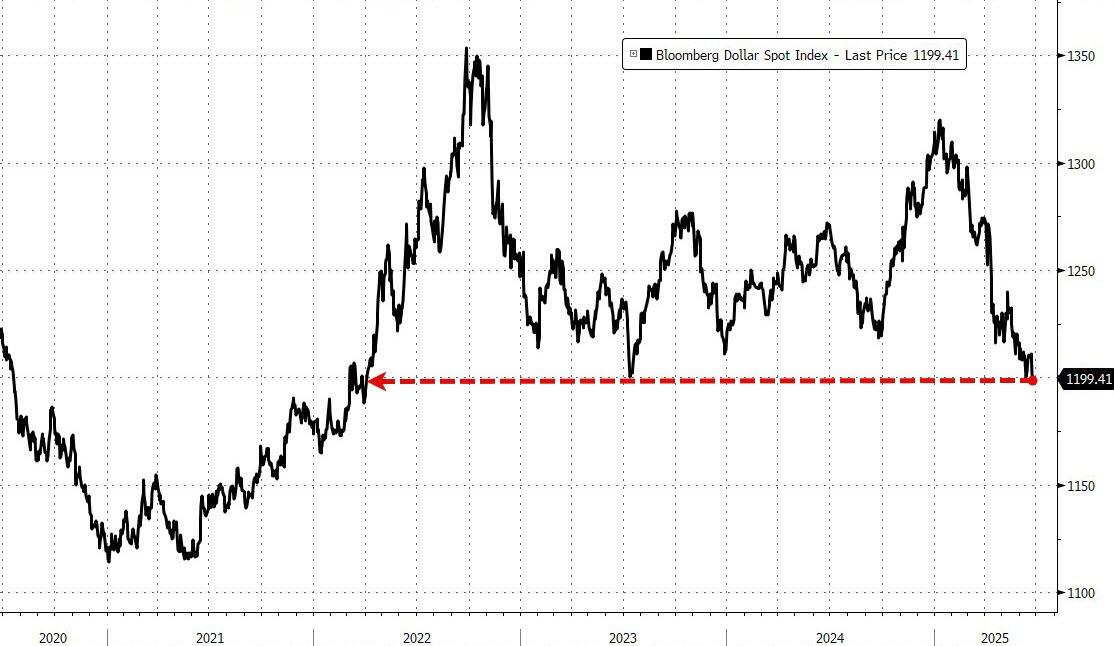
Bond yields dropped, the dollar took a hit and ended the day at its weakest level against major currencies since April 2022, according to ZeroHedge.
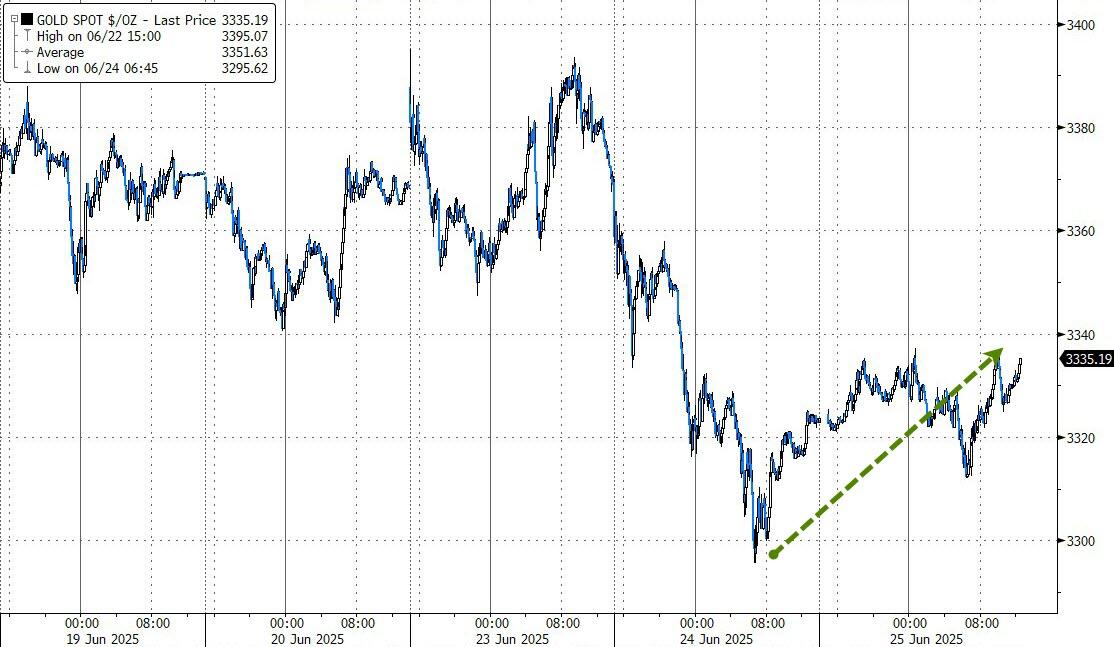
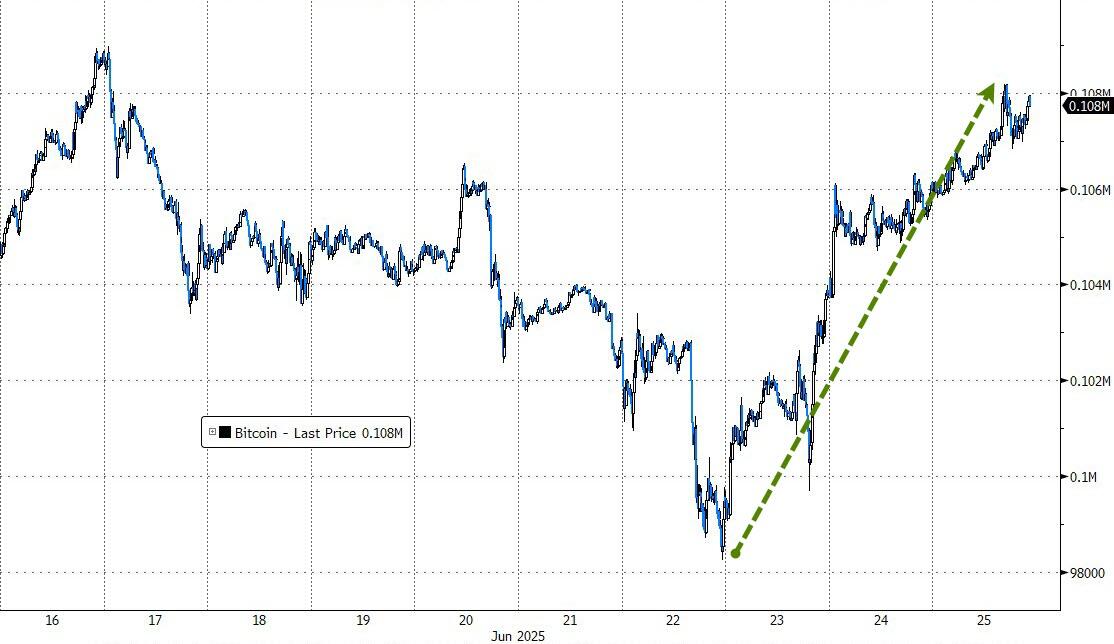
On the bright side, gold continued its rebound off the $3,300-mark, silver added 1.2%, and Bitcoin climbed from below $100K to $108K, riding the wave of global liquidity.
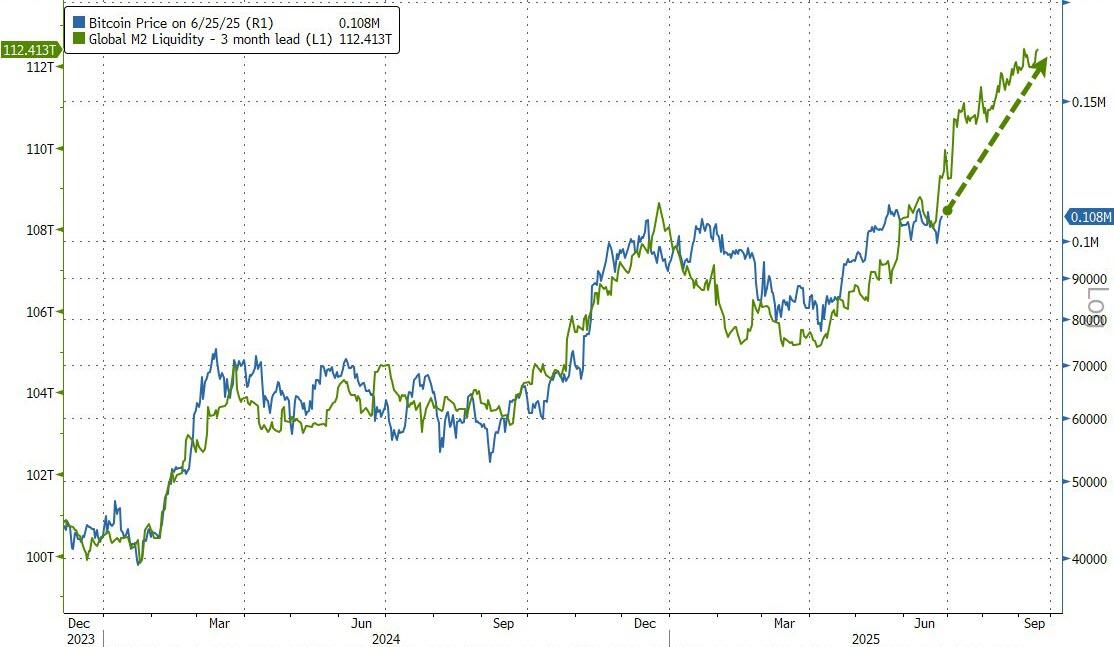
Crypto seems to be moving in sync with broader liquidity trends—but the big question is: Will it stay on this path, or is another twist coming?
2. Current domestic “Buy” Cycle (effective 5/20/2025); International “Buy” Cycle (effective 5/8/25)
Our domestic bullish cycle that began on November 21, 2023, concluded on April 3, 2025, following a market downturn triggered by President Trump’s tariff policy announcement.
This development caused significant declines across major indexes and broader market indices. However, markets subsequently rebounded, culminating in a new domestic “Buy” signal taking effect May 20, 2025.
Concurrently, our International Trend Tracking Index (TTI) experienced parallel volatility. On April 4, 2025, it breached critical thresholds, prompting a “Sell” recommendation. This position reversed as global markets recovered, with the International TTI regaining sufficient momentum to issue a new “Buy” signal effective May 8, 2025.
3. Trend Tracking Indexes (TTIs)
It was a rough day for the bulls. Early gains looked promising, but by midday, the momentum fizzled out.
The Dow slipped into the red, and the S&P 500 barely managed to stay flat.
Our TTIs also took a dip, but the good news is they’re still holding above their trendlines—for now.
This is how we closed 06/25/2025:
Domestic TTI: +1.55% above its M/A (prior close +2.29%)—Buy signal effective 5/20/25.
International TTI: +6.69% above its M/A (prior close +7.13%)—Buy signal effective 5/8/25.
All linked charts above are courtesy of Bloomberg via ZeroHedge.
———————————————————-
WOULD YOU LIKE TO HAVE YOUR INVESTMENTS PROFESSIONALLY MANAGED?
Do you have the time to follow our investment plans yourself? If you are a busy professional who would like to have his portfolio managed using our methodology, please contact me directly to get more details.
Contact Ulli