
- Moving the markets
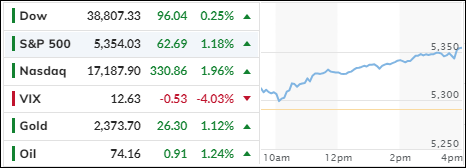
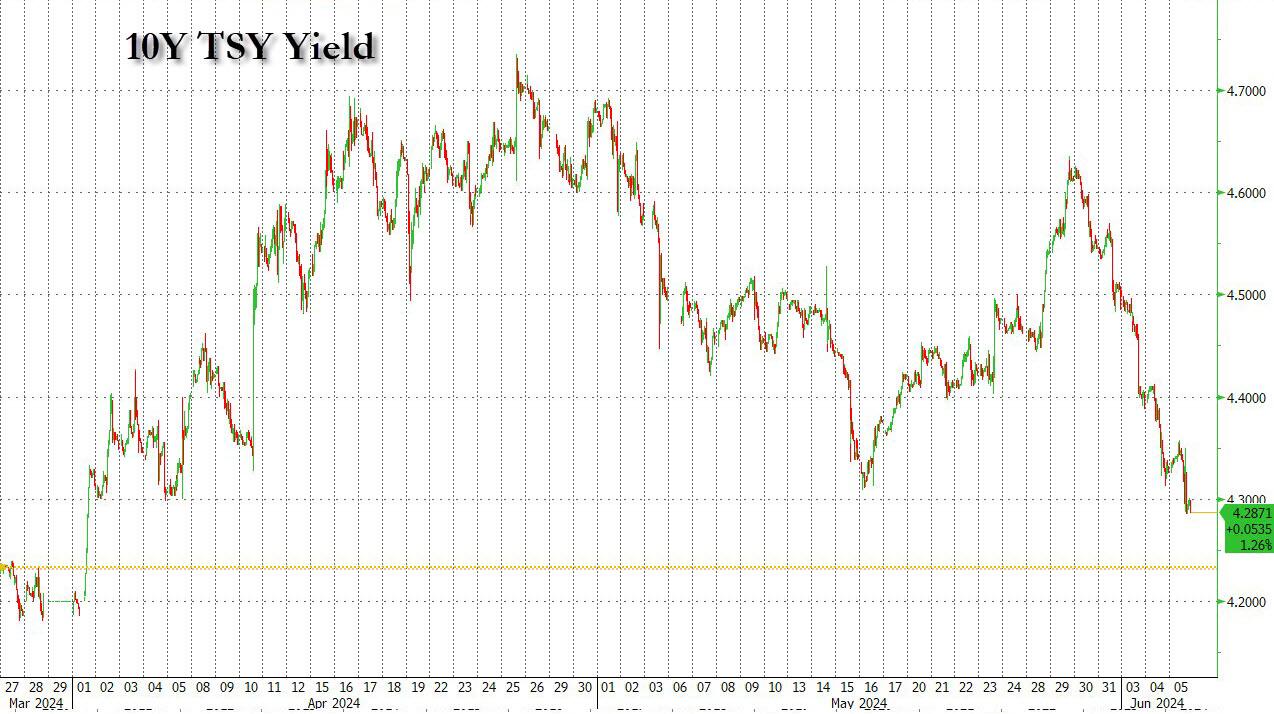
Nvidia’s jump to a new record, while conquering the $3 trillion market cap, sparked bullish sentiment, at least in the Dow and S&P 500, both of which headed higher right after the opening bell. The latter scored a new all-time high late in the session, as the 10-year yield slipped to 4.29%.
With traders looking everywhere to find new evidence that would convince the Fed to finally lower rates, weak labor market data was their next focus. ADP showed that hiring slowed to 152k jobs in May, which was far below expectations of 175k.
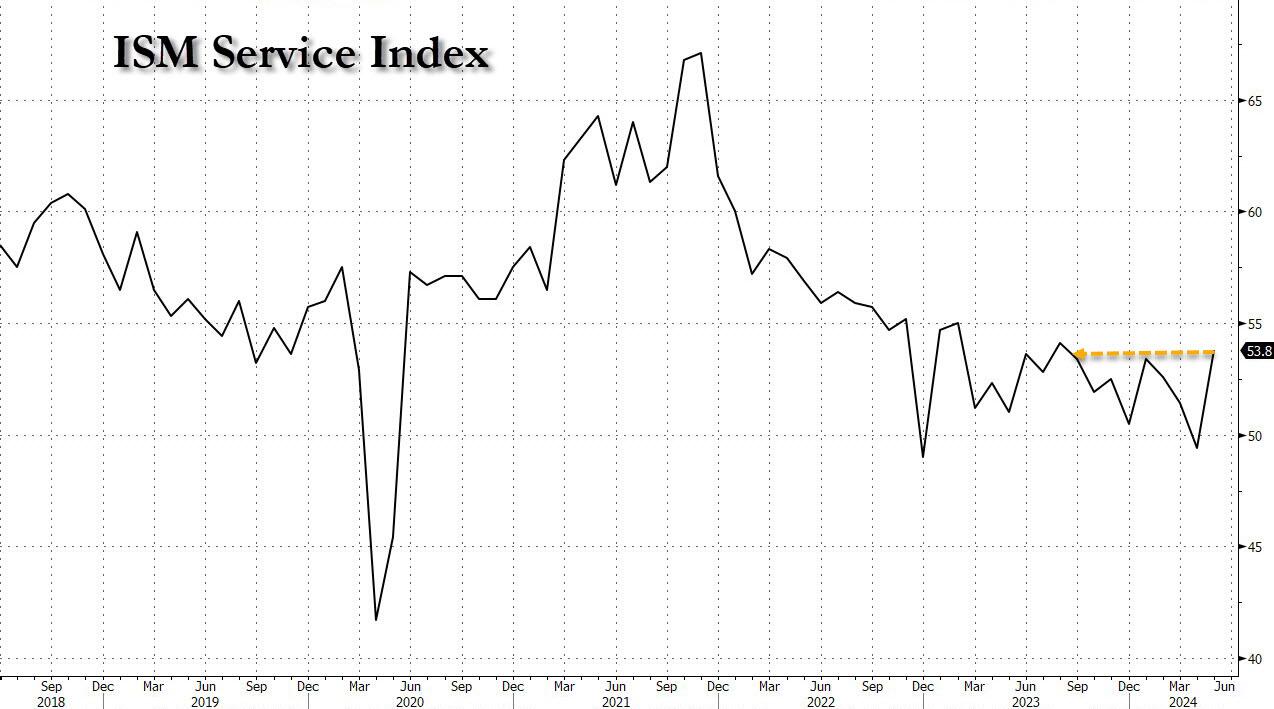
Offsetting those numbers were new data points from the services sector, as that area increased to 53.8, more than the expected 50.7 figure. Next up tomorrow will be weekly jobless claims and Friday’s all-important May employment report.
While the S&P and Nasdaq spurted ahead over 1%, broader gains were more moderate, as concerns remained that a weak economy could signal an unstoppable slowdown and overcome the benefits of a rate cut.
However, oethe Bank of Canada took the lead by cutting its rate for the first time in 4 years by 0.25% to 4.75%, despite a very sticky inflation rate of 2.7%. Very likely, the ECB will follow suit tomorrow. The reason is not that inflation has been licked, it’s that economies are faltering and quickly descending into recession territory—or worse.
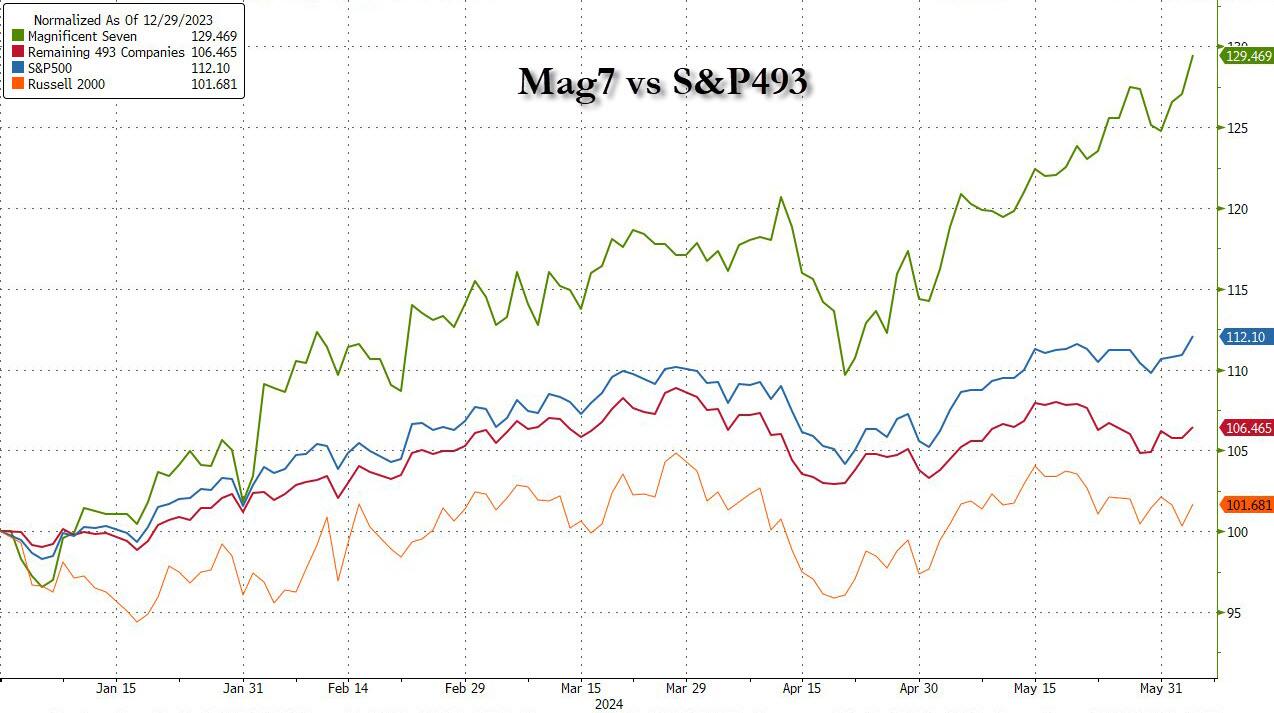
ZH reminded us that most of the gains in equites have come from the MAG7 stocks, which are up 30% YTD. Compare that to the S&P’s 13%, while the S&P 493 is up only 6.5%. This chart demonstrates that owning the broad market was not the best choice. Ah yes, the benefit of hindsight.
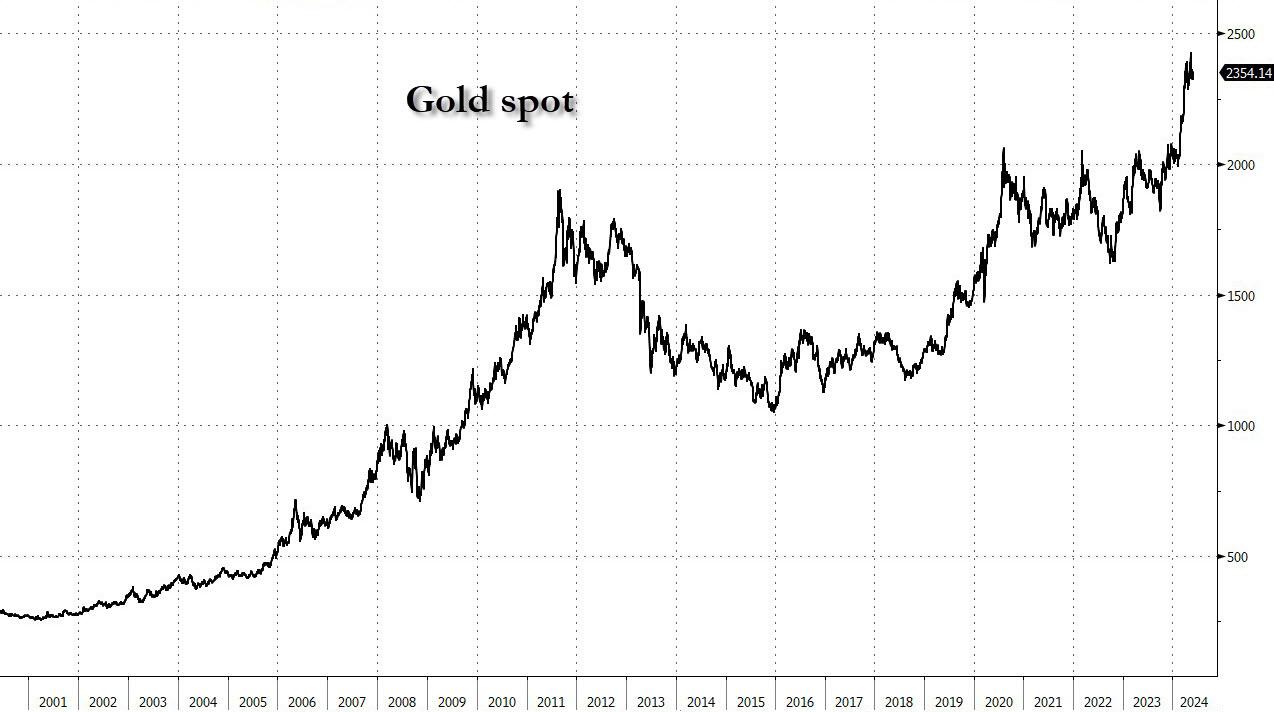
Gold, after its recent pullback, showed signs of life again and looks to be approaching its all-time highs. As is Bitcoin, which also hovers within striking distance.
Who will get there first?
2. Current “Buy” Cycles (effective 11/21/2023)
Our Trend Tracking Indexes (TTIs) have both crossed their trend lines with enough strength to trigger new “Buy” signals. That means, Tuesday, 11/21/2023, was the official date for these signals.
If you want to follow our strategy, you should first decide how much you want to invest based on your risk tolerance (percentage of allocation). Then, you should check my Thursday StatSheet and Saturday’s “ETFs on the Cutline” report for suitable ETFs to buy.
3. Trend Tracking Indexes (TTIs)
The Bank of Canada’s rate cut, weak economic data, and the 10-year yield slipping further had the bears throw in the towel and let the bulls have a strong session to the upside.
Our TTIs participated and moved higher.
This is how we closed 06/05/2024:
Domestic TTI: +7.08% above its M/A (prior close +6.44%)—Buy signal effective 11/21/2023.
International TTI: +8.89% above its M/A (prior close +8.65%)—Buy signal effective 11/21/2023.
All linked charts above are courtesy of Bloomberg via ZeroHedge.
———————————————————-
WOULD YOU LIKE TO HAVE YOUR INVESTMENTS PROFESSIONALLY MANAGED?
Do you have the time to follow our investment plans yourself? If you are a busy professional who would like to have his portfolio managed using our methodology, please contact me directly to get more details.
Contact Ulli