
- Moving the markets
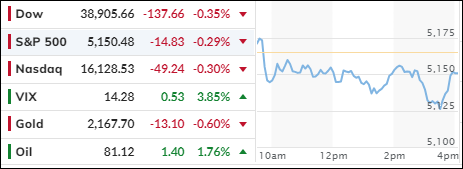
In the financial theater today, the S&P 500 experienced a slight setback after inflation data came in warmer than anticipated, propelling Treasury yields upward. Nvidia’s shares, on the other hand, were less fortunate, facing downward pressure.
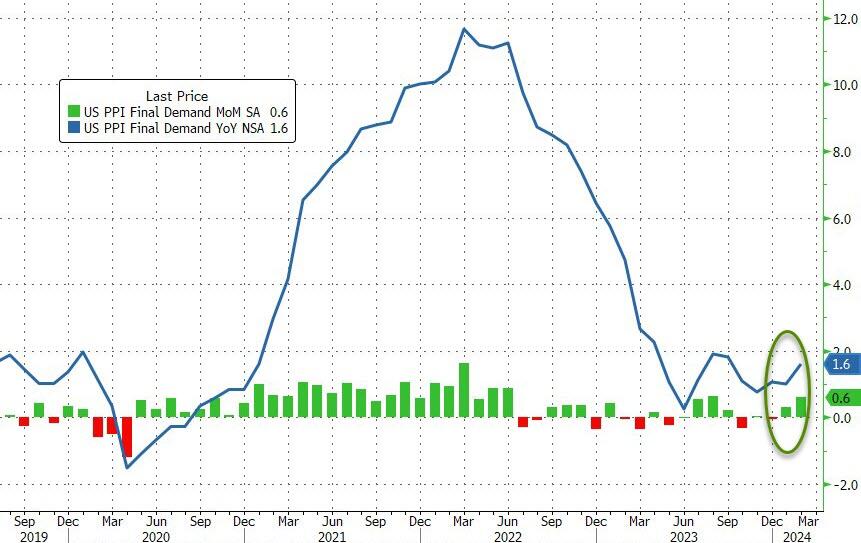
The Producer Price Index (PPI) for February, which tracks wholesale inflation, rose by 0.6% last month, surpassing the expectations of a 0.3% increase. Stripping away the food and energy sectors, the core PPI climbed by 0.3%. Initially, the stock market seemed indifferent to the data, but it wasn’t long before the enthusiasm waned.
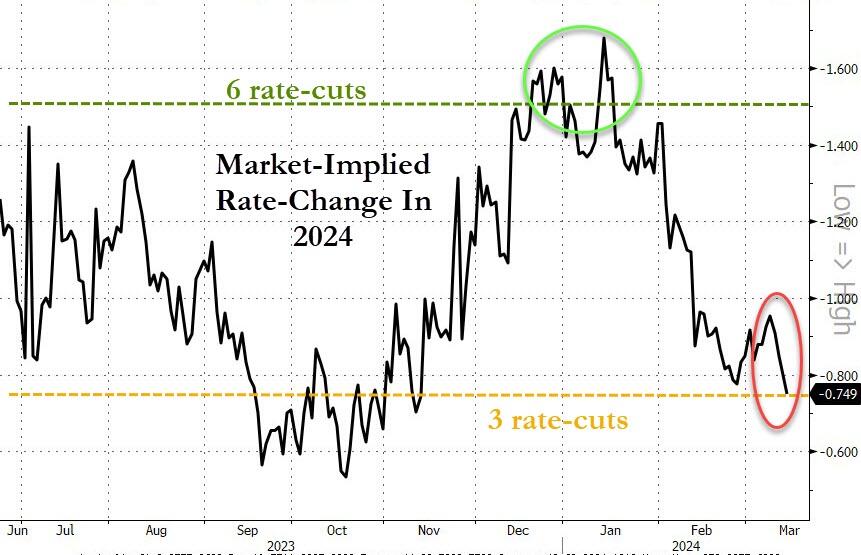
The burning question on traders’ minds is whether the Federal Reserve will adjust its rate cut strategy, potentially impacting the stock market rally. With bond yields on the rise, concerns about a market downturn are growing. It seems likely that both the Fed’s rate decisions and the bond yields will play a significant role in the market’s direction.
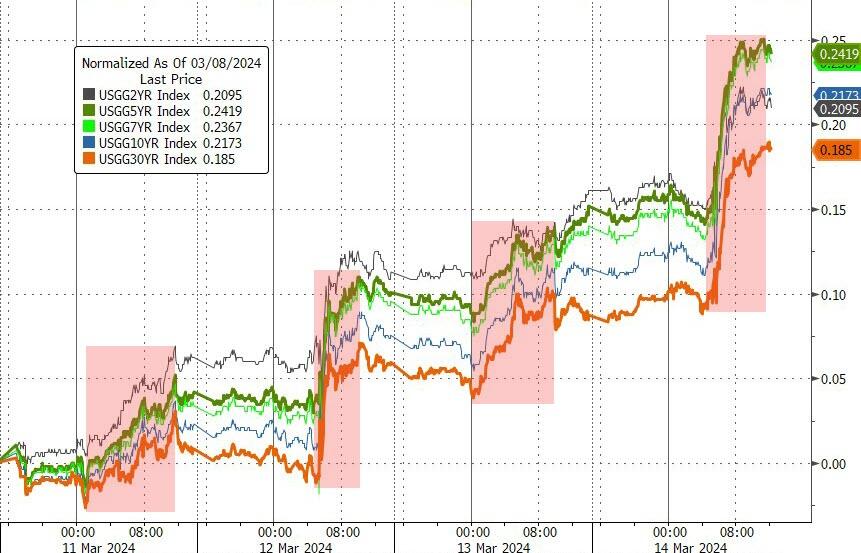
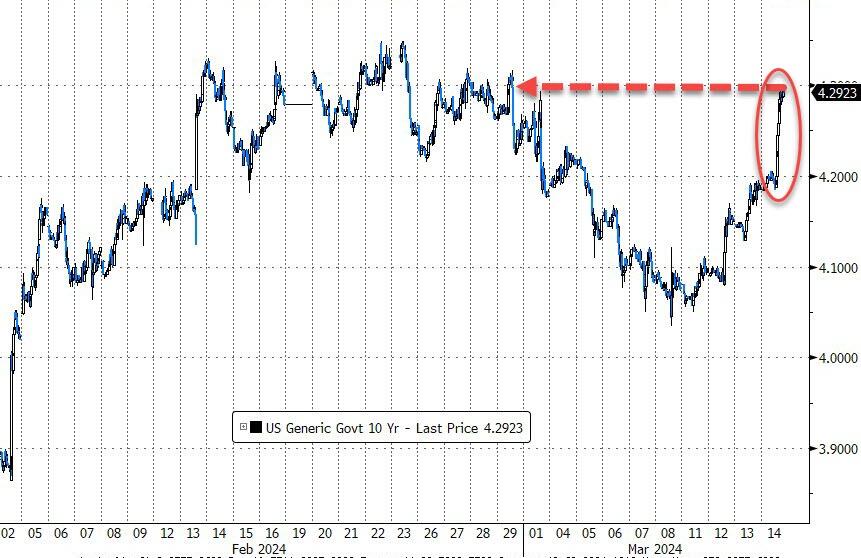
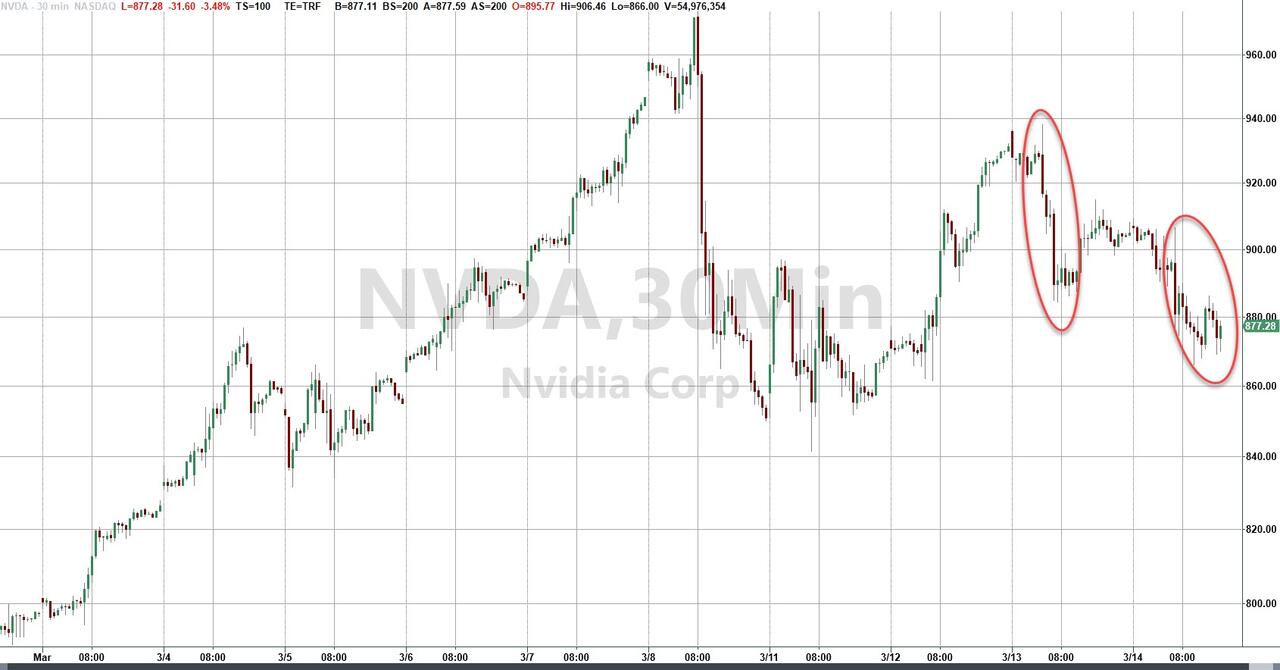
The inflation report has nudged bond yields higher, with the 10-year Treasury note adding 9 basis points. Nvidia’s shares have retreated for the fourth time in five sessions, dropping by nearly 3%.
As we approach the Federal Reserve’s policy meeting on March 19-20, this PPI report stands as the final piece of significant economic data. The macroeconomic landscape has been turbulent, with softer Retail Sales, unexpected rises in Producer Prices, and an increase in Jobless Claims, all contributing to a shift in rate-cut expectations.
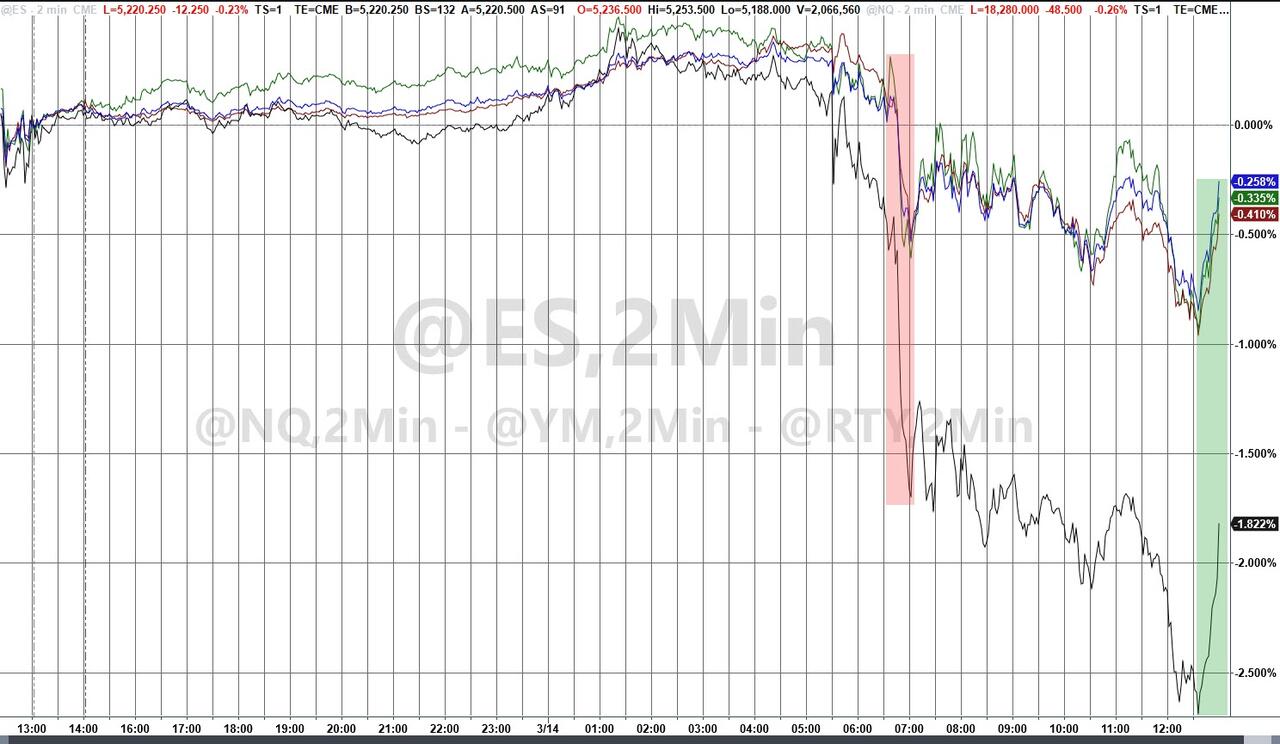
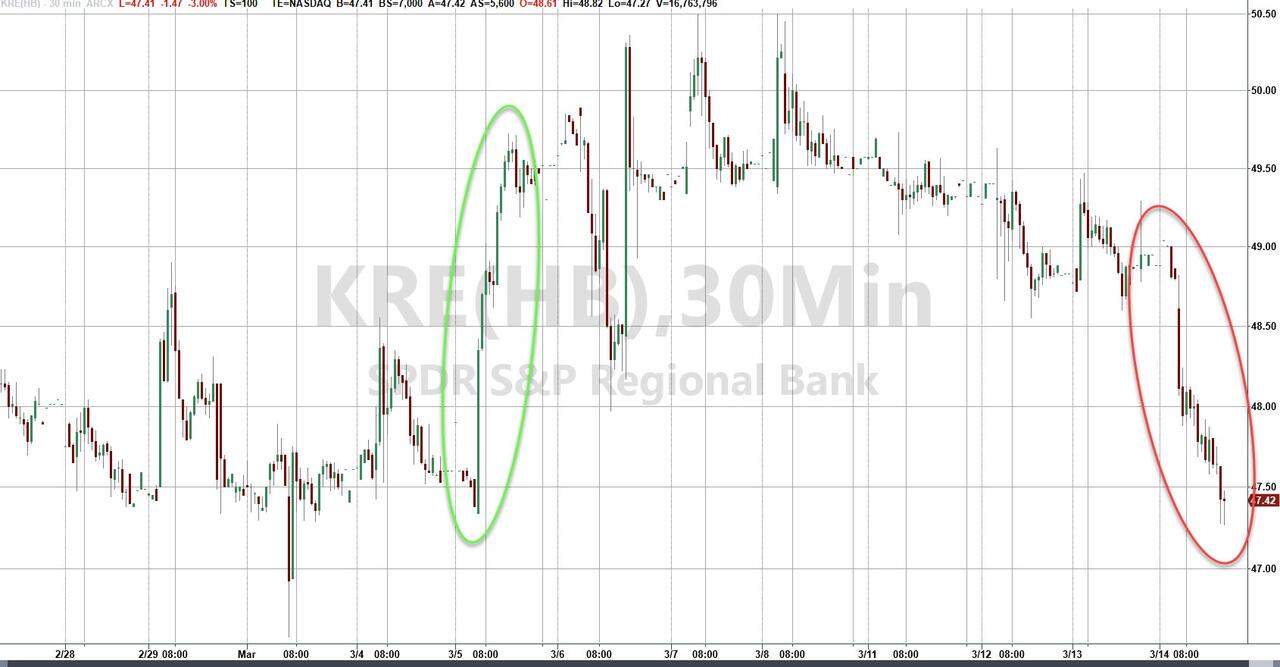
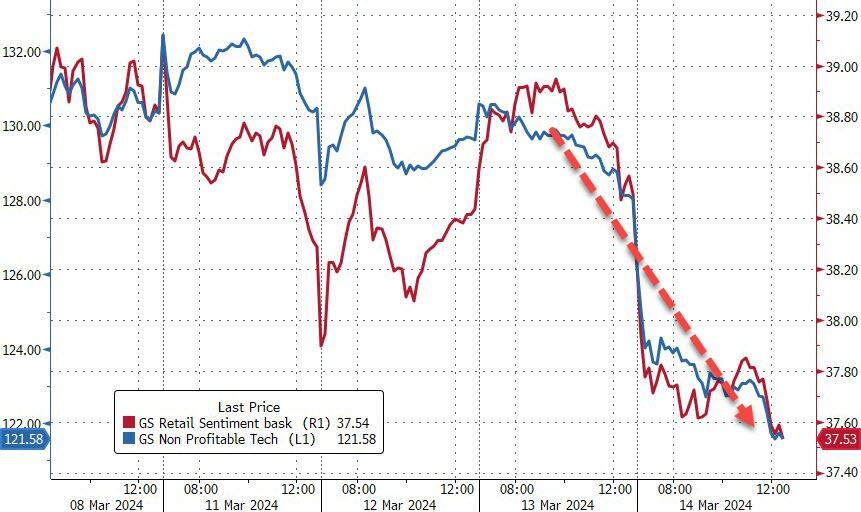
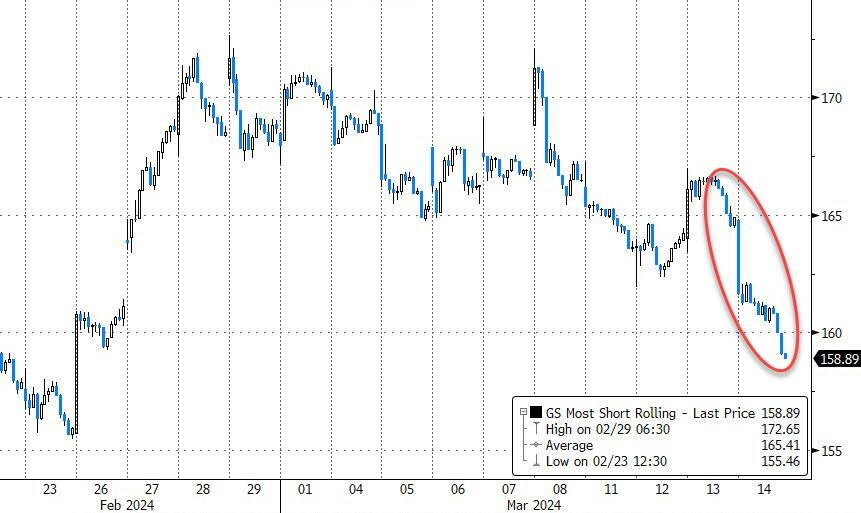
Bond yields surged, pushing the 10-year to its annual peak, which in turn has impacted the major indexes, with Small Caps leading the decline. Banks felt the strain, and Nvidia’s streak of record highs has been interrupted, as investors move away from non-profitable tech stocks. The usual market buoyancy provided by short squeezes was notably missing.
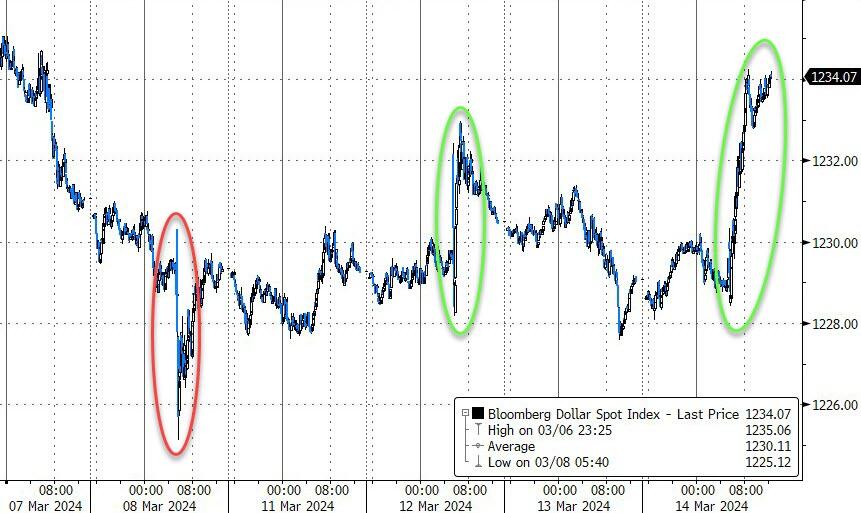
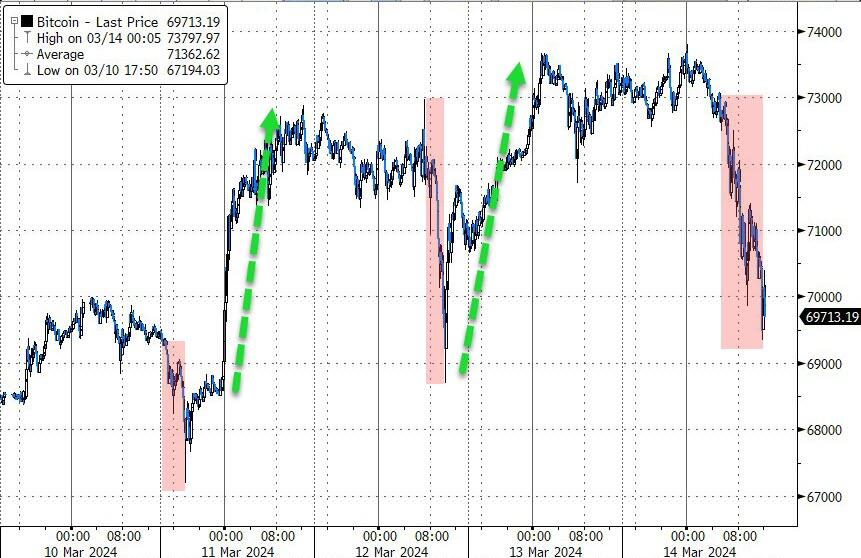
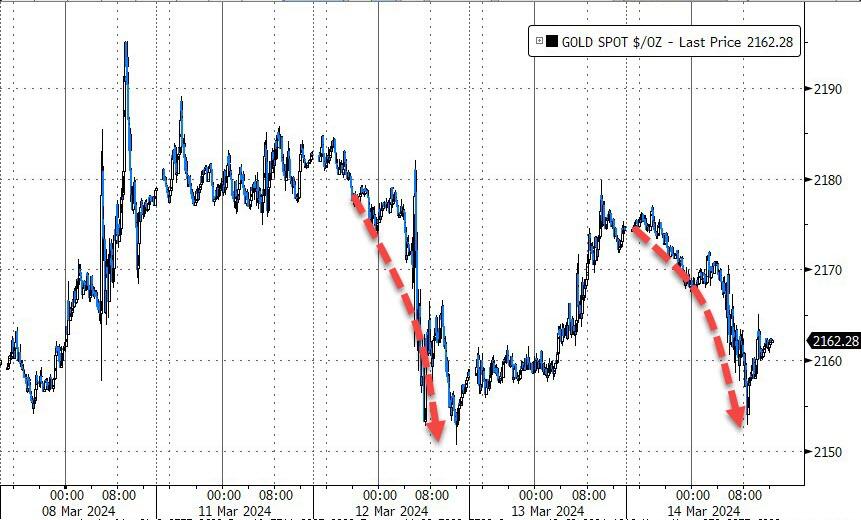
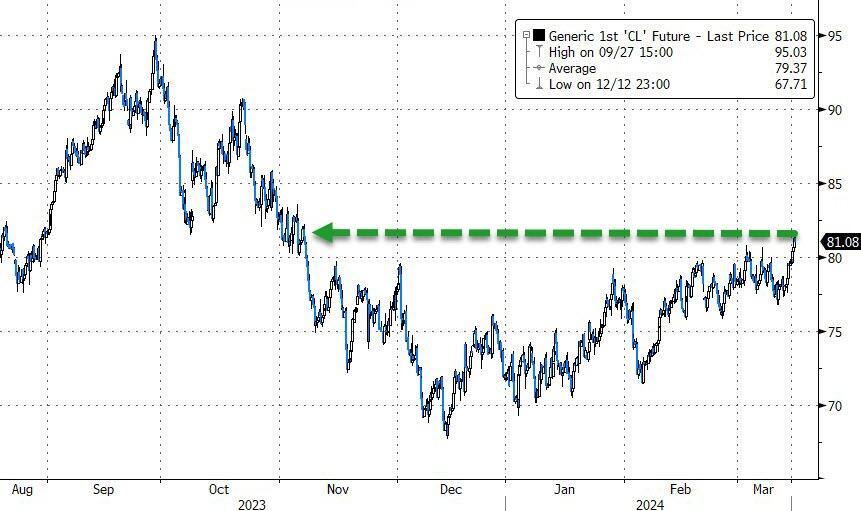
The dollar strengthened alongside the bond yields, Bitcoin settled at the $70k mark after a significant ETF inflow, gold diverged from the dollar’s trajectory, and oil prices hit their highest point since early November.
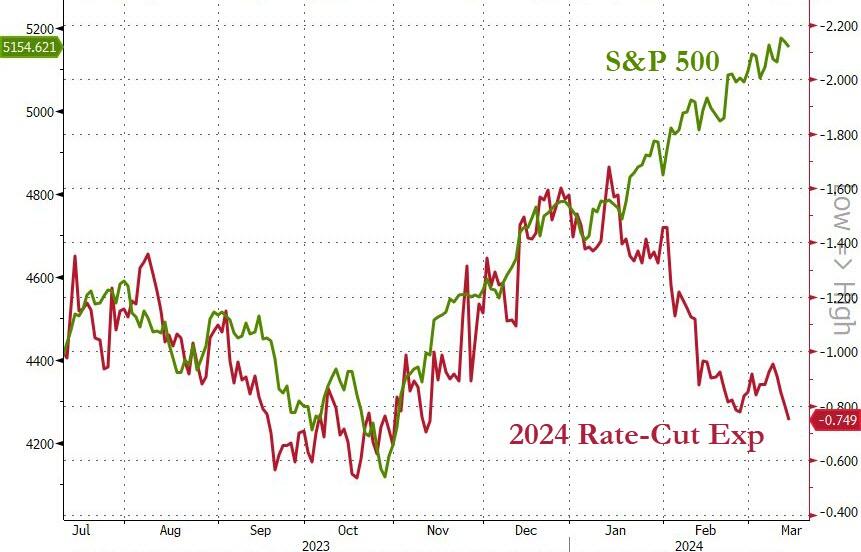
Despite these developments, stocks seem to be maintaining a distance from rate hike expectations.
But the question remains: for how long can this detachment last?
2. Current “Buy” Cycles (effective 11/21/2023)
Our Trend Tracking Indexes (TTIs) have both crossed their trend lines with enough strength to trigger new “Buy” signals. That means, Tuesday, 11/21/2023, was the official date for these signals.
If you want to follow our strategy, you should first decide how much you want to invest based on your risk tolerance (percentage of allocation). Then, you should check my Thursday StatSheet and Saturday’s “ETFs on the Cutline” report for suitable ETFs to buy.
3. Trend Tracking Indexes (TTIs)
The major indexes began the trading session with gains but soon lost steam. The market predominantly saw declines, as optimistic trading sentiment was notably absent throughout the day.
Despite a slight downturn, our TTIs continue to stay above their trend lines, suggesting a continued positive market trend.
This is how we closed 3/14/2024:
Domestic TTI: +9.90% above its M/A (prior close +10.84%)—Buy signal effective 11/21/2023.
International TTI: +9.65% above its M/A (prior close +10.23%)—Buy signal effective 11/21/2023.
All linked charts above are courtesy of Bloomberg via ZeroHedge.
———————————————————-
WOULD YOU LIKE TO HAVE YOUR INVESTMENTS PROFESSIONALLY MANAGED?
Do you have the time to follow our investment plans yourself? If you are a busy professional who would like to have his portfolio managed using our methodology, please contact me directly to get more details.
—————————————————————-
Contact Ulli