
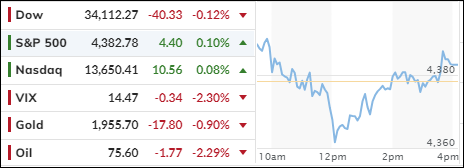
[Chart courtesy of MarketWatch.com]
- Moving the markets
The S&P 500 had a roller-coaster ride on Wednesday, as it barely kept its winning streak alive for the eighth day in a row. That’s the longest run since 2021. But Small Caps got hammered again, as they lagged the big boys.
It seems that traders are betting on the Fed to take a break from hiking rates and hoping for a smooth landing. Stocks have been beaten down for too long, and they’re finally bouncing back a bit.
Of course, the fate of the market depends on how inflation and the economy behave. The data so far suggests that things are cooling off, but not crashing. That is, unless the numbers are wrong and get revised later.
The earnings season is almost over. Most companies in the S&P 500 have reported their results, and most of them have beaten the profit estimates. But the revenue picture is not so rosy, as only a little over half of them have exceeded the sales expectations. That could spell trouble for the future direction of stocks.
Wall Street is also eagerly waiting for what the Fed Chair Jerome Powell has to say. His words, along with the earnings picture and the inflation report next week, could either boost or bust the market.
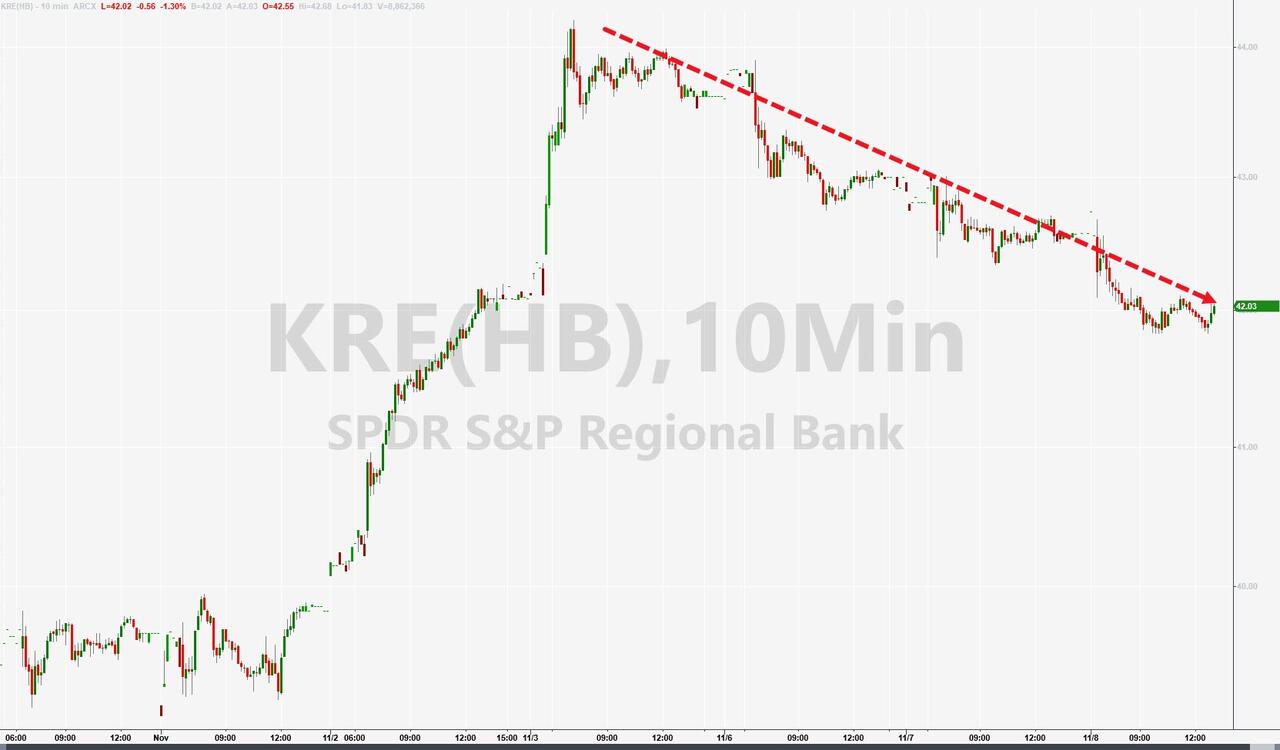
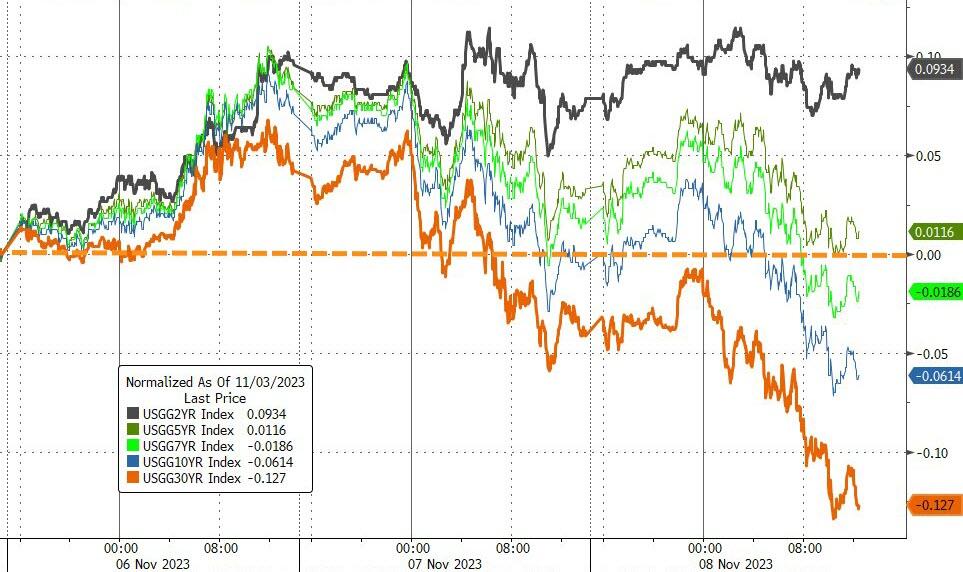
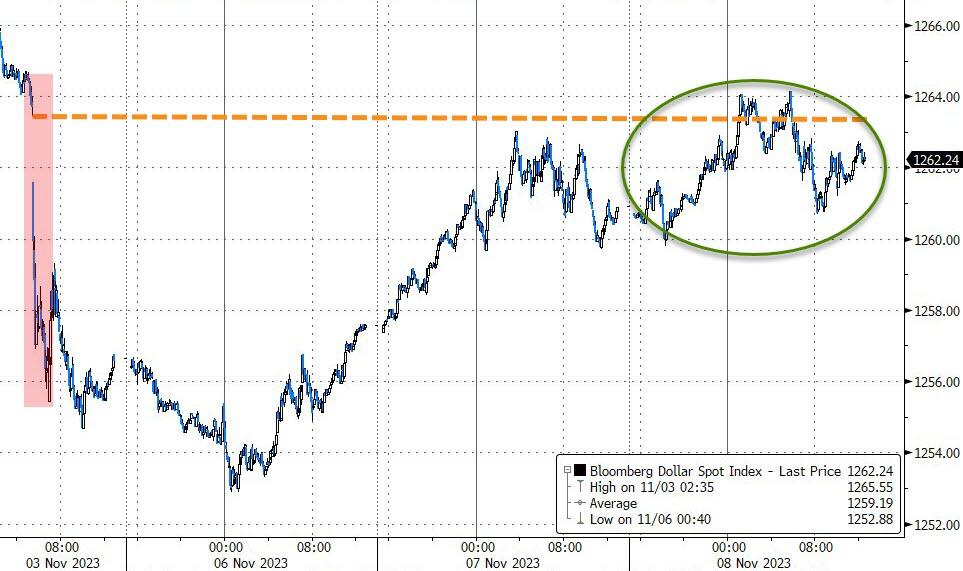
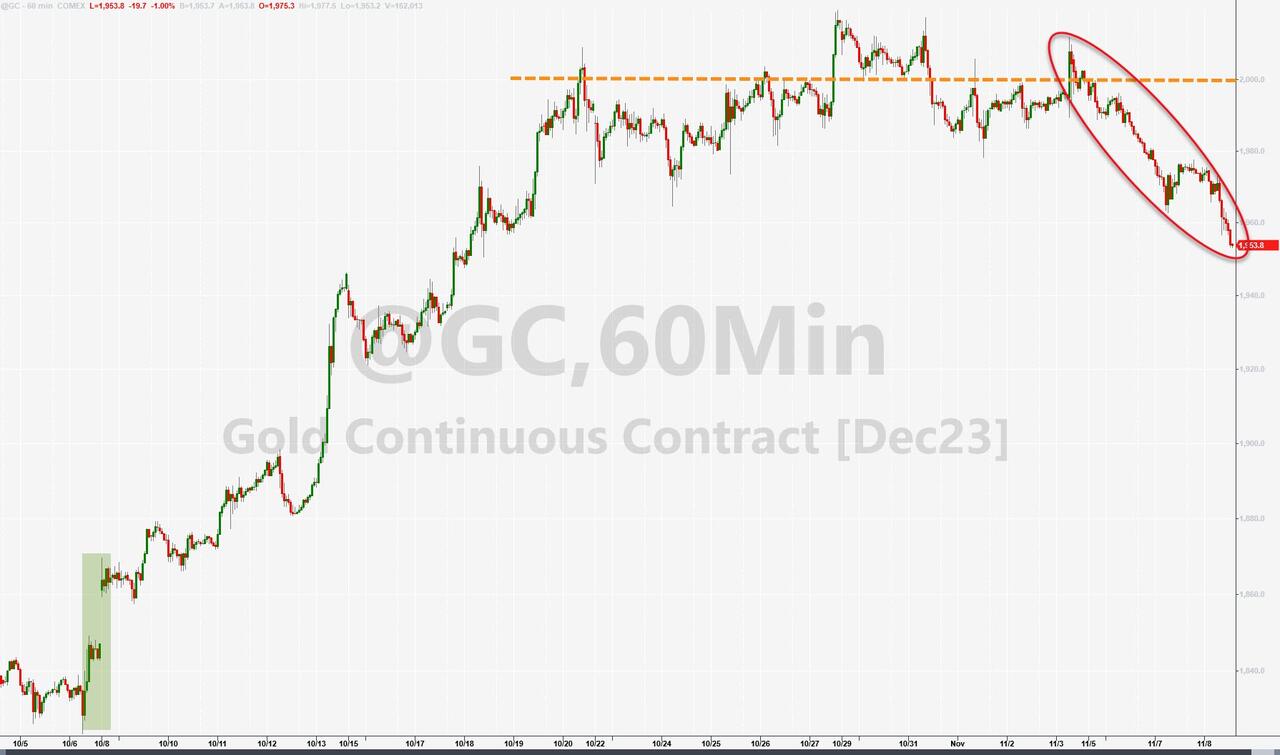
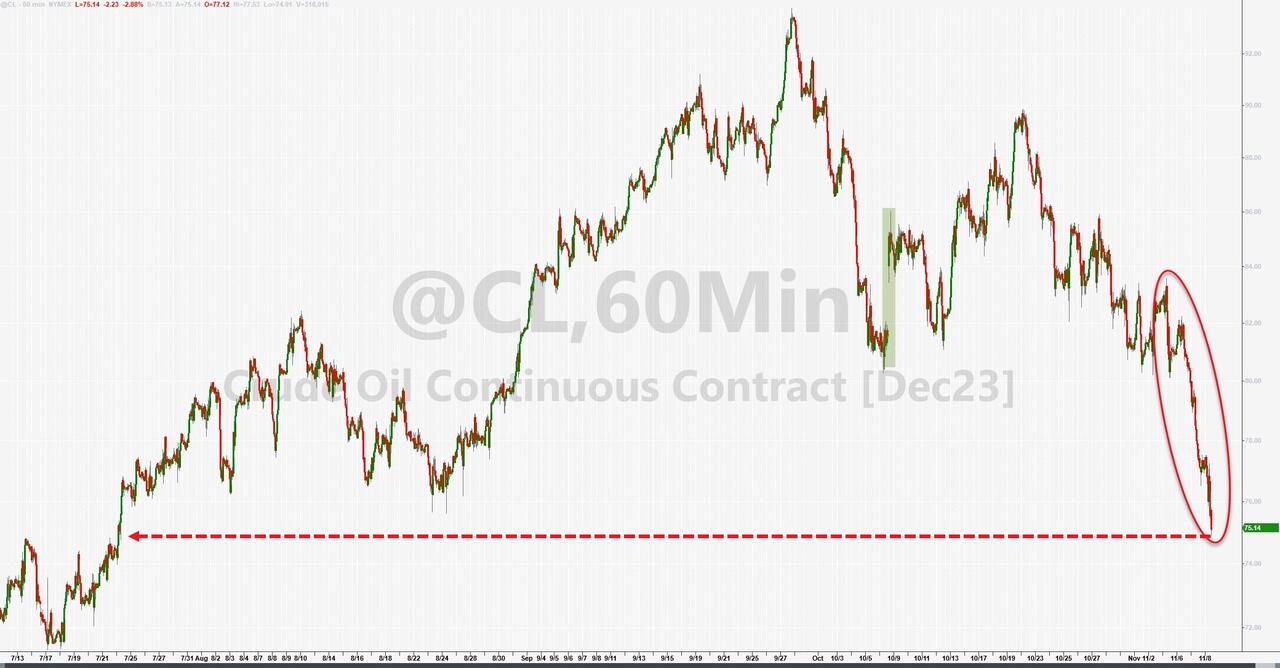
Meanwhile, regional banks kept sliding, bond yields moved in different directions, the dollar stayed flat, gold lost some shine, and crude oil plunged to its lowest level since July.
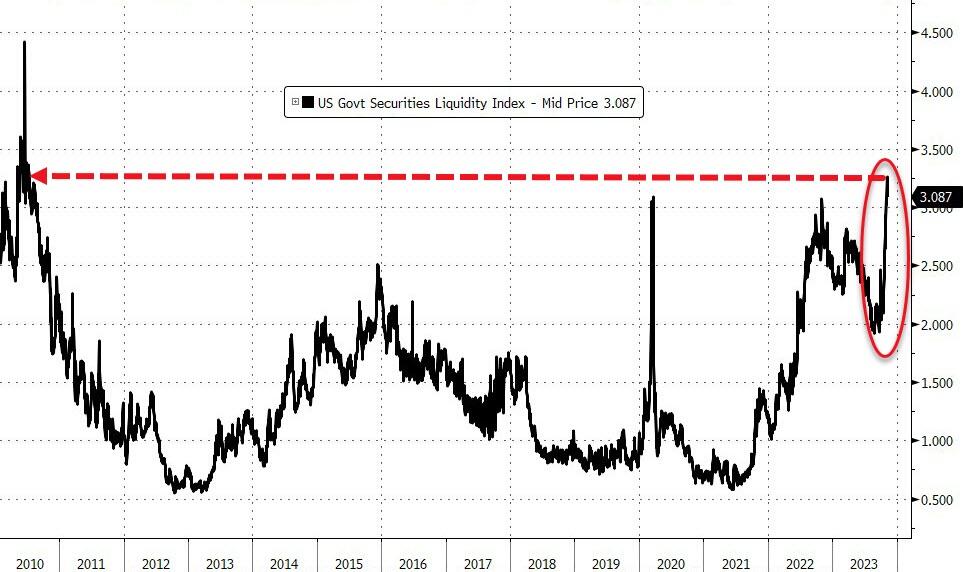
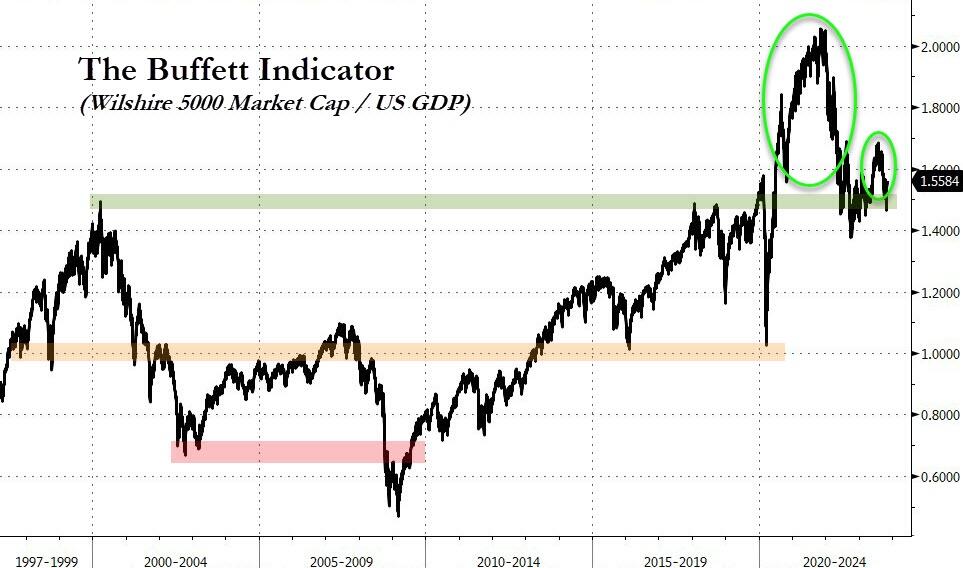
And the US Treasury market saw its worst liquidity since 2010. Is that why Warren Buffett is sitting on a mountain of cash? Or is he just scared of his own indicator, which shows that stocks are as pricey as they were during the dotcom bubble in 2000?
Hmm…
2. “Buy” Cycle (12/1/22 to 9/21/2023)
The current Domestic Buy cycle began on December 1, 2022, and concluded on September 21, 2023, at which time we liquidated our holdings in “broadly diversified domestic ETFs and mutual funds”.
Our International TTI has now dipped firmly below its long-term trend line, thereby signaling the end of its current Buy cycle effective 10/3/23.
We have kept some selected sector funds. To make informed investment decisions based on your risk tolerance, you can refer to my Thursday StatSheet and Saturday’s “ETFs on the Cutline” report.
Considering the current turbulent times, it is prudent for conservative investors to remain in money market funds—not bond funds—on the sidelines.
3. Trend Tracking Indexes (TTIs)
The major indexes started the day with a surge, but soon faced a sell-off. However, they recovered slightly in the last hour and closed with small gains. The S&P and Nasdaq both ended in the green, but barely.
The comeback rally was not supported by many stocks, so our TTIs continued to decline and slipped deeper into the bear market zone.
This is how we closed 11/08/2023:
Domestic TTI: -2.81% below its M/A (prior close -2.65%)—Sell signal effective 9/22/2023.
International TTI: -0.47% below its M/A (prior close -0.24%)—Sell signal effective 10/3/2023.
All linked charts above are courtesy of Bloomberg via ZeroHedge.
Contact Ulli