
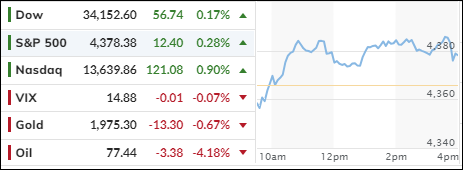
[Chart courtesy of MarketWatch.com]
- Moving the markets
Stocks were snoozing early on, as traders took a nap after a wild rally on Wall Street to kick off November, but a sudden burst of energy pushed the major indexes back into the green.
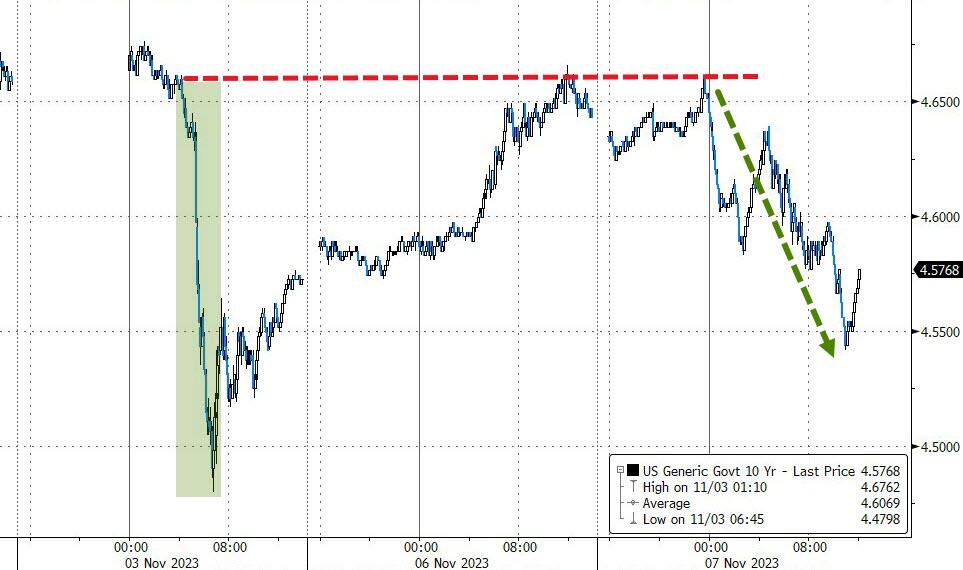
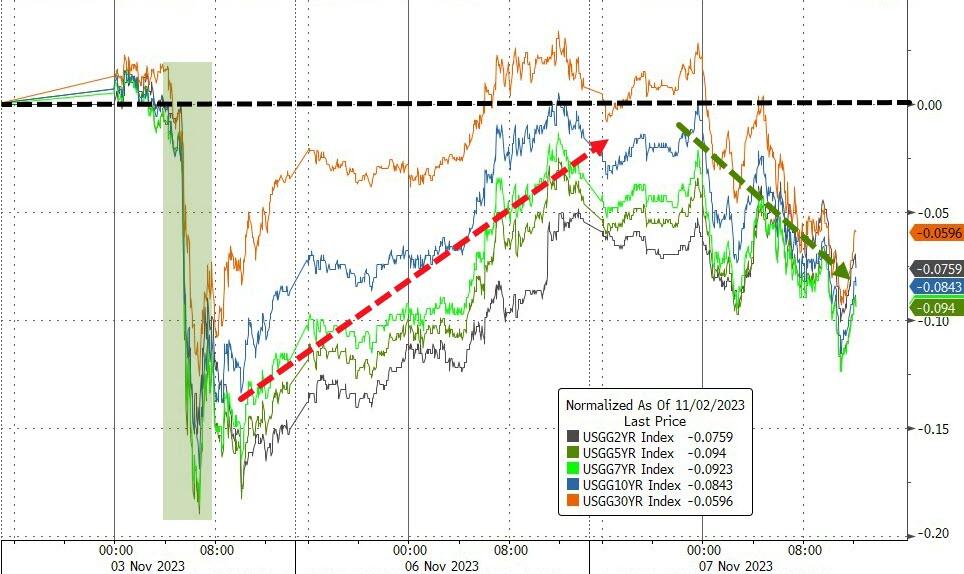
Tech stocks rose as yields retreated, with the yield on the 10-year Treasury note dropping about 7.5 basis points to 4.575%. Some notable winners included Microsoft, Amazon, and Advanced Micro Devices.
Traders wondered if last week’s rally was a fluke or a trend after all three indices had their best week in 2023. However, some feared that a fierce rally like this one was too good to last.
The November surge was a sharp contrast to a dismal October in which the S&P 500 dipped into correction territory. Wall Street cheered up after the Federal Reserve kept interest rates steady following their meeting last week.
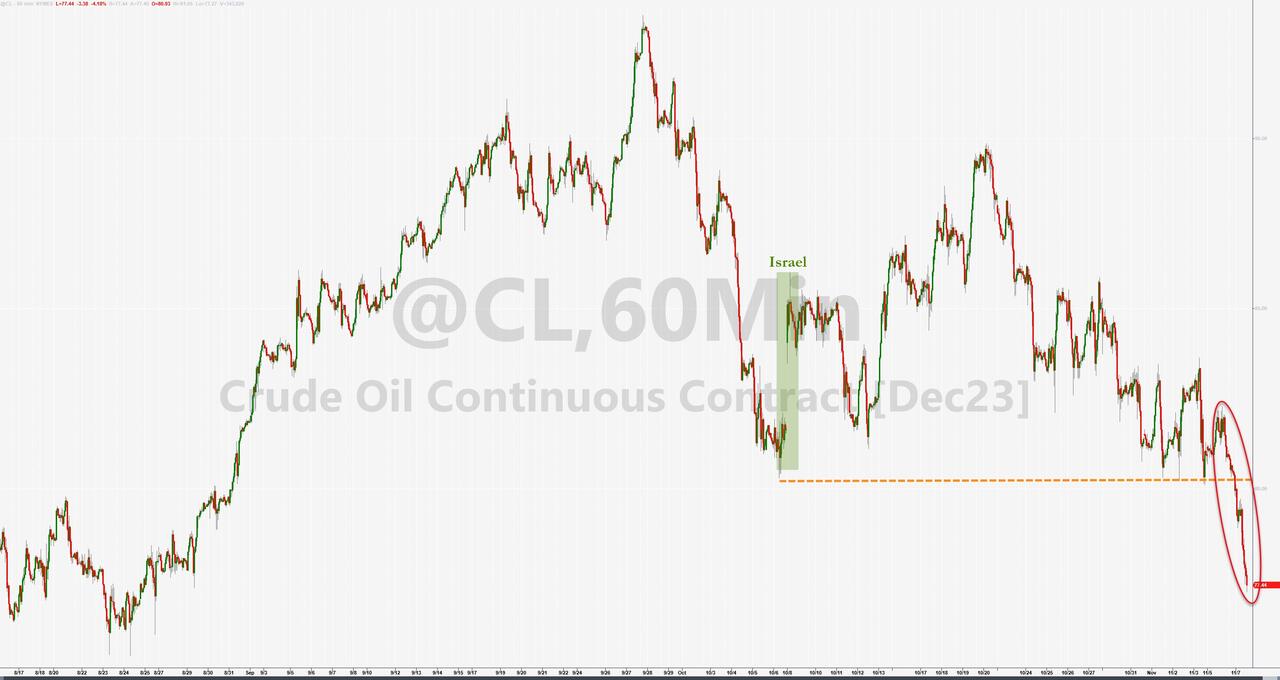
Treasury yields slid and stocks climbed. Sure, lower yields gave a boost to the growth sectors of the market, but falling oil prices also helped ease inflation worries, as drivers enjoyed some relief at the pump.
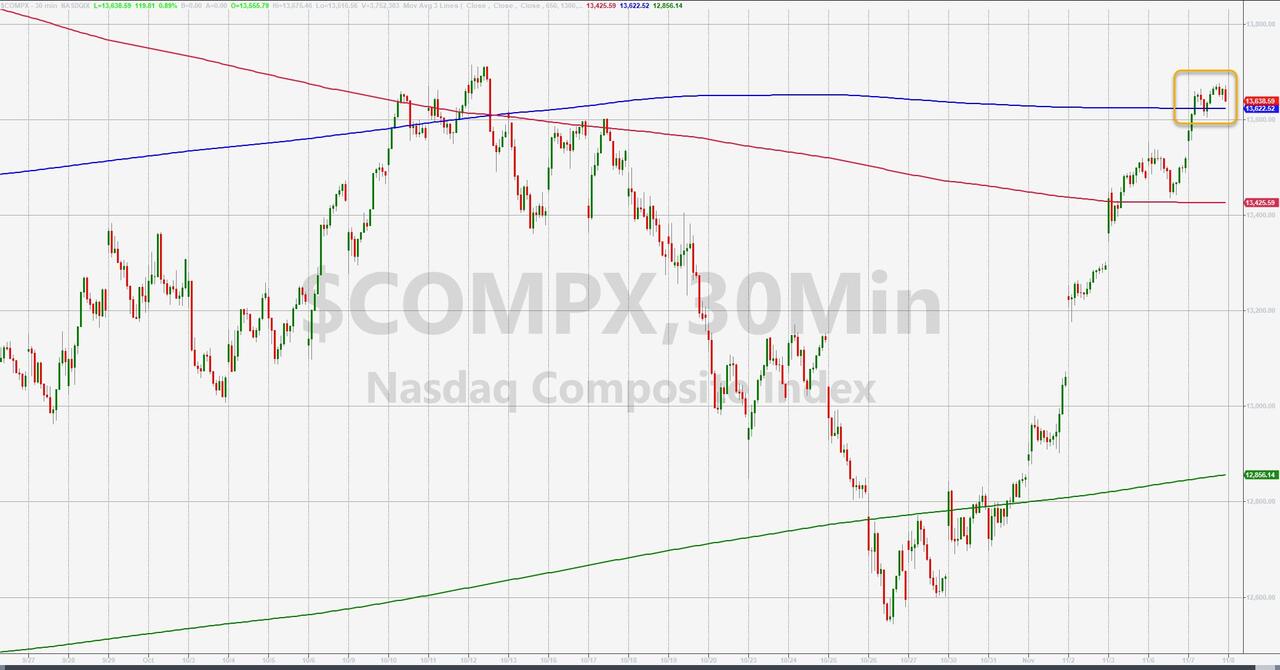
Wolfe Research looked at the technical side of the market and predicted that the early November rally could soon fizzle out, if history repeats itself:
“Each rally since the July peak has fizzled out before making a fresh 1-month high, before tumbling to a new 1-month low…the definition of a downtrend.”
As ZeroHedge noted, another quiet macro day had no major catalysts – even with a bunch of Fed Speakers – since they all sang the same song – data-dependent, job not done, inflation still too high, rates high(er) for long(er), no cuts on the agenda.
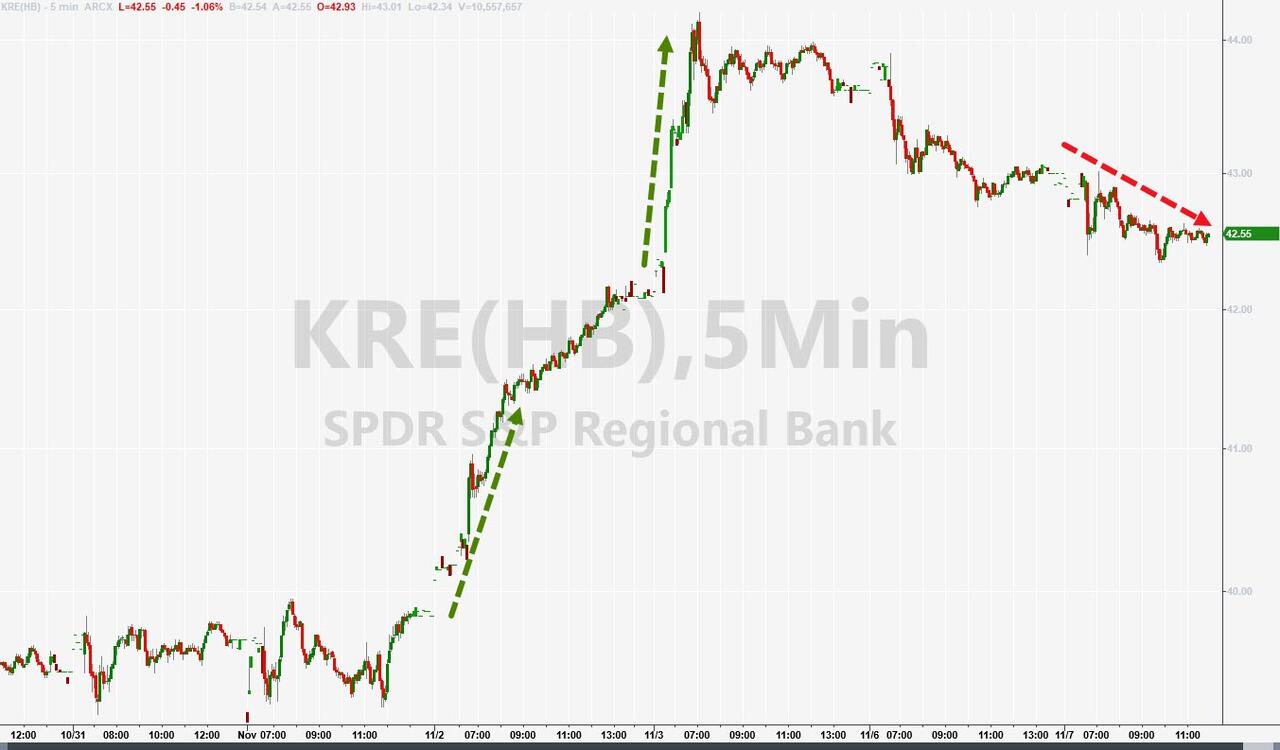
As a result, the Nasdaq zoomed from open to close, The Dow and S&P barely budged, while Small Caps ended in the red. Regional banks struggled and faced some new rules to reign in their risky lending.
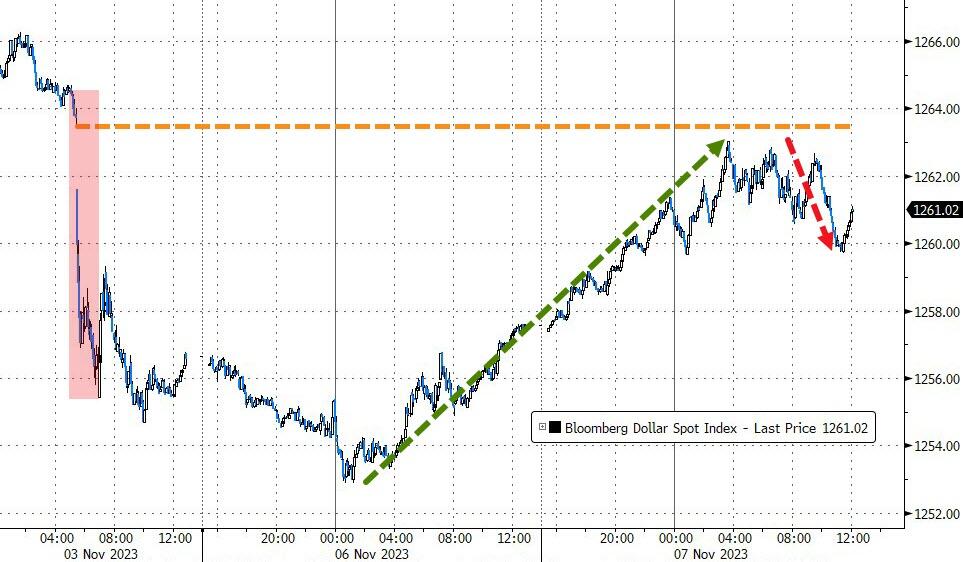
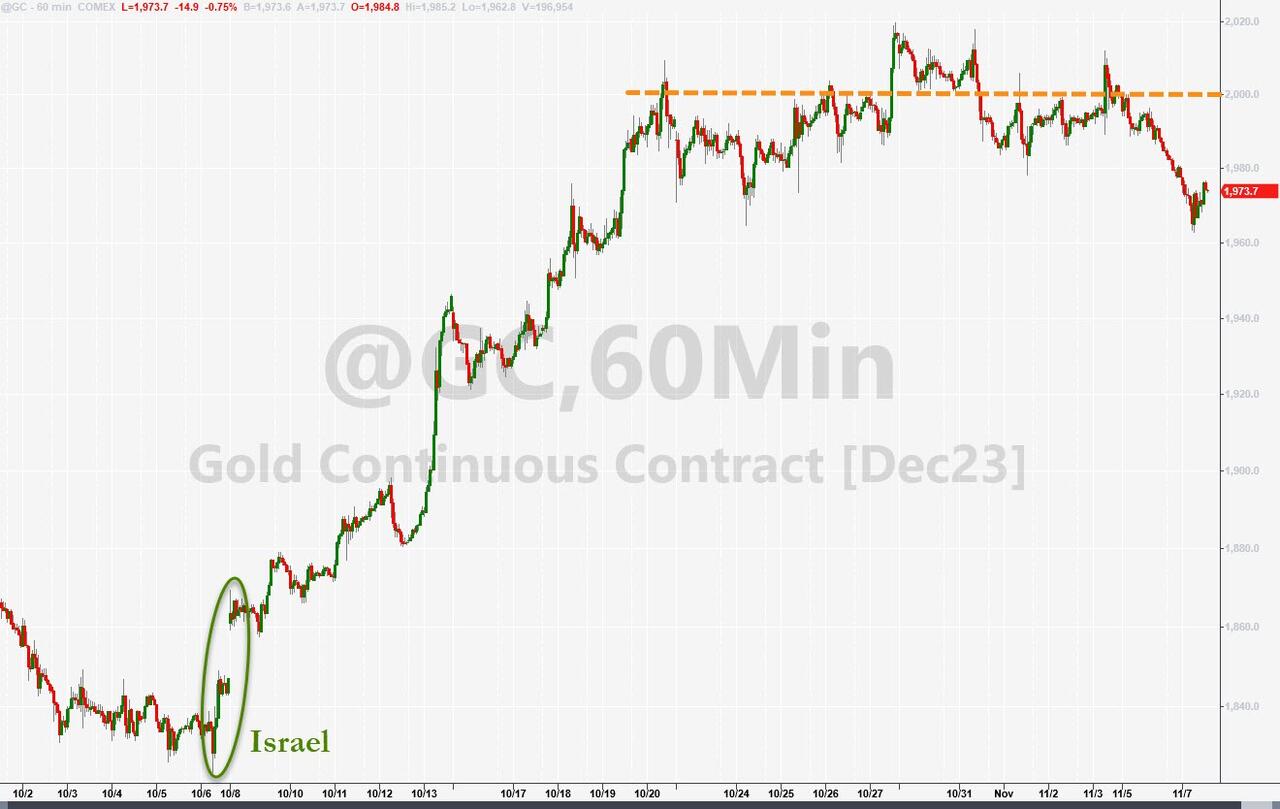
Bond yields pulled back, the dollar gained, while gold drifted lower and crude oil tanked, closing at its lowest level since July.
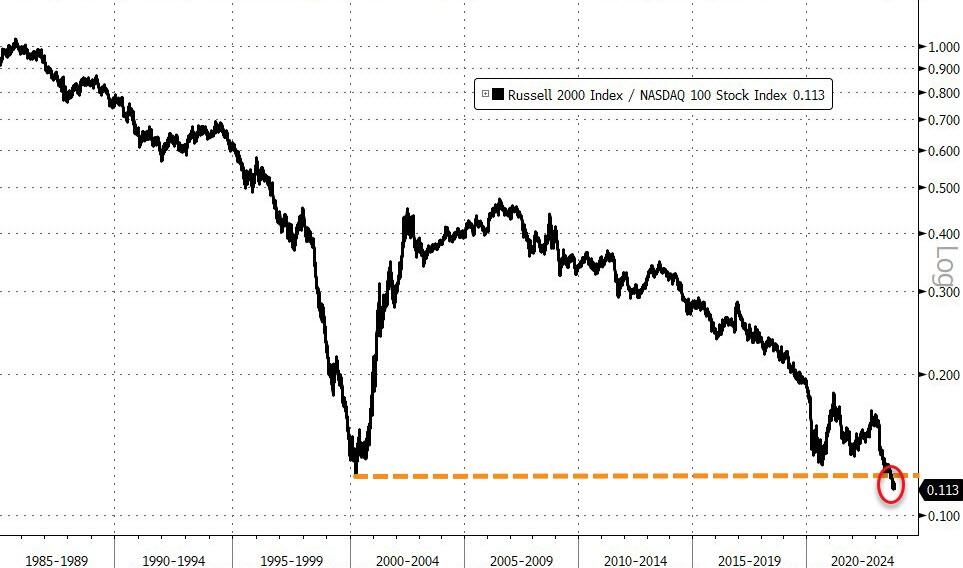
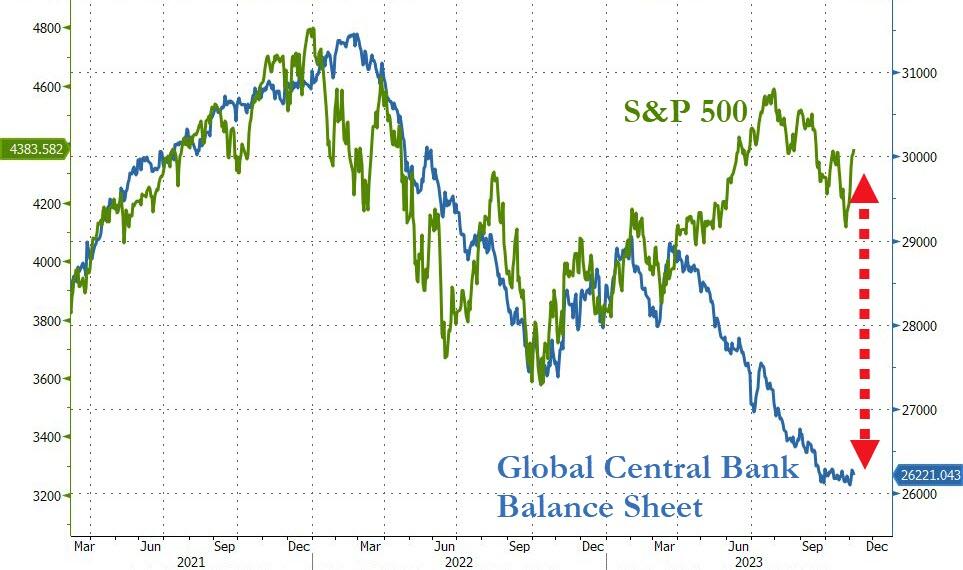
Looking at the big picture, you can see that global central banks are still in tightening mode and are sucking out the excess liquidity from financial markets, causing this gap.
Hmm…Which way will this crocodile mouth snap shut?
2. “Buy” Cycle (12/1/22 to 9/21/2023)
The current Domestic Buy cycle began on December 1, 2022, and concluded on September 21, 2023, at which time we liquidated our holdings in “broadly diversified domestic ETFs and mutual funds”.
Our International TTI has now dipped firmly below its long-term trend line, thereby signaling the end of its current Buy cycle effective 10/3/23.
We have kept some selected sector funds. To make informed investment decisions based on your risk tolerance, you can refer to my Thursday StatSheet and Saturday’s “ETFs on the Cutline” report.
Considering the current turbulent times, it is prudent for conservative investors to remain in money market funds—not bond funds—on the sidelines.
3. Trend Tracking Indexes (TTIs)
The rally was weak and narrow, which dragged down our TTIs. The International TTI also dipped under its trend line once more, indicating that we are still in a downtrend.
This is how we closed 11/07/2023:
Domestic TTI: -2.65% below its M/A (prior close -2.44%)—Sell signal effective 9/22/2023.
International TTI: -0.24% below its M/A (prior close +0.11%)—Sell signal effective 10/3/2023.
All linked charts above are courtesy of Bloomberg via ZeroHedge.
Contact Ulli